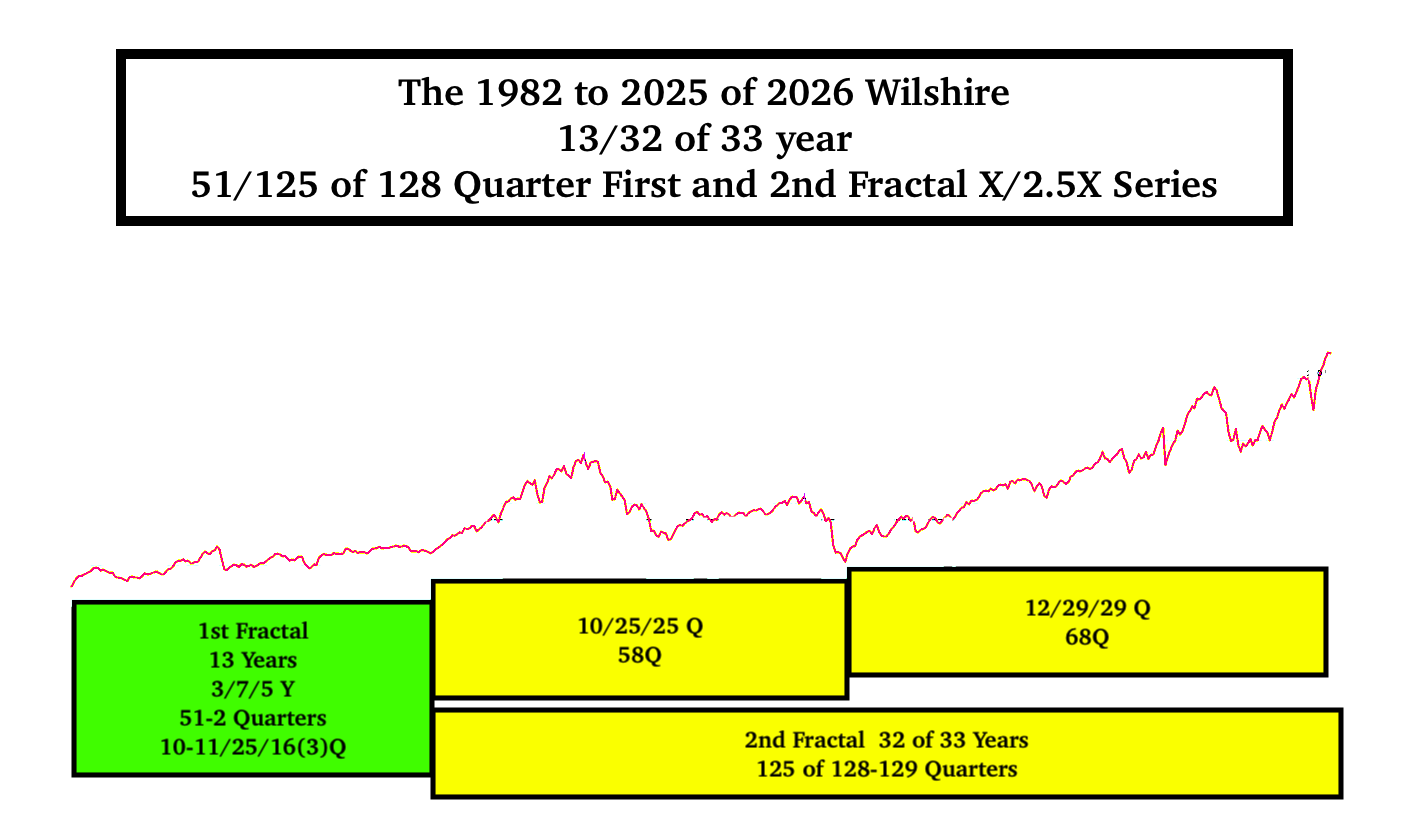
From March 2009 SPX Equity growth has grown to its maximum x/2.5x/2.5x fractal limit :: 11-12/29-30/29 quarters with the 29 quarter 3rd fractal 29 consisting of 6/12/13 quarters :: x/2x/2.5x and 16/32/39 months :: x/2x/2.5x.
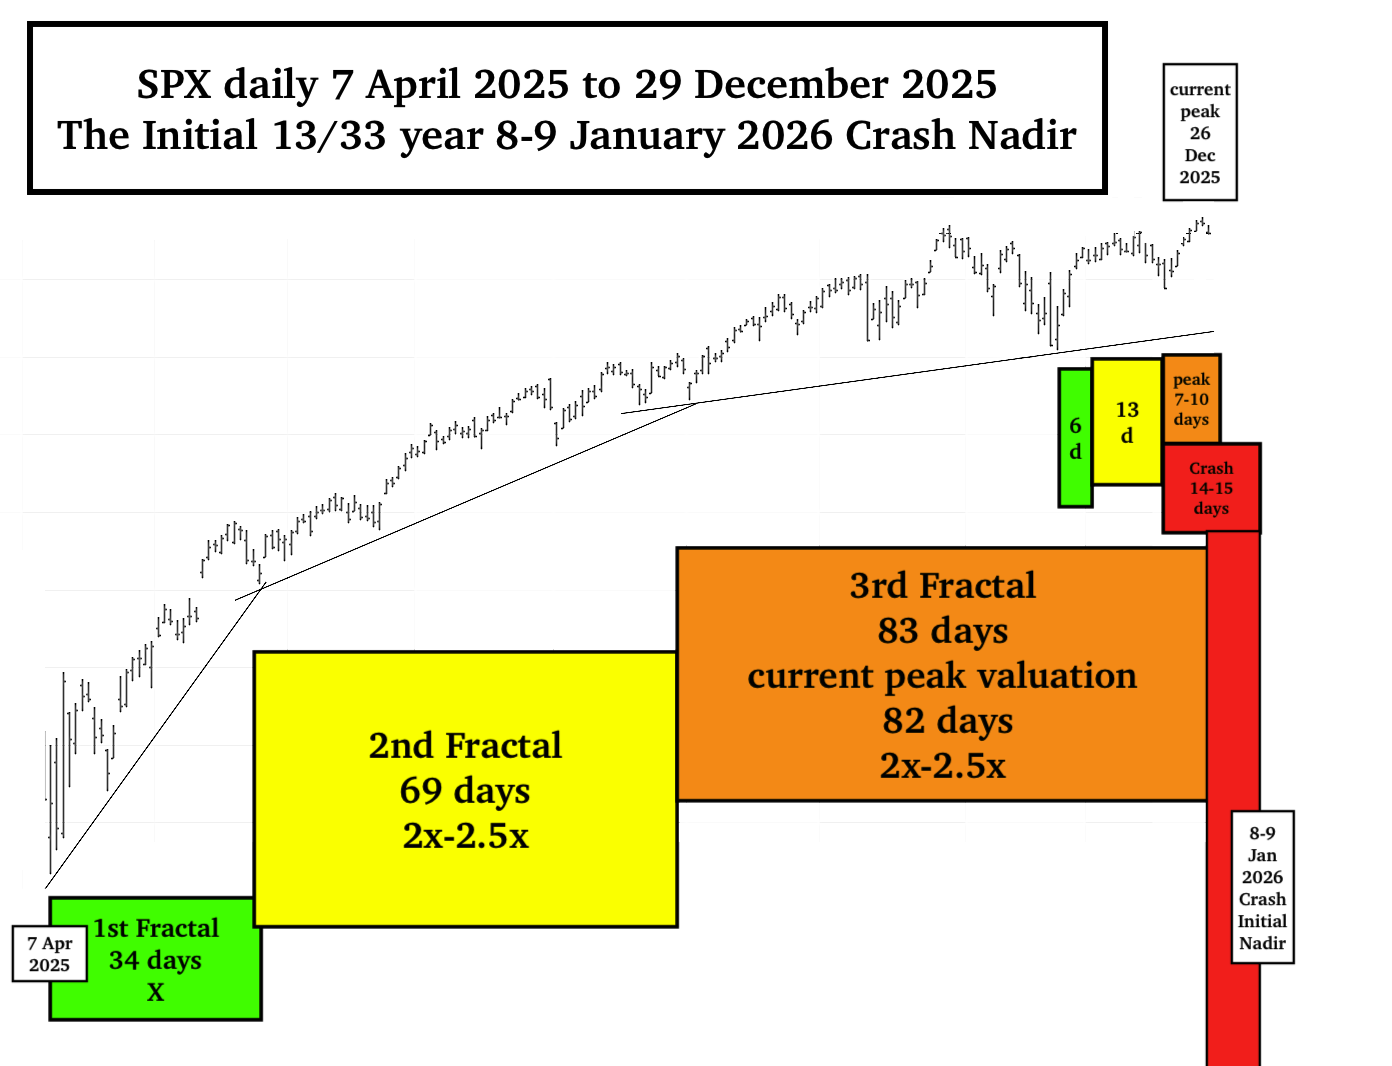
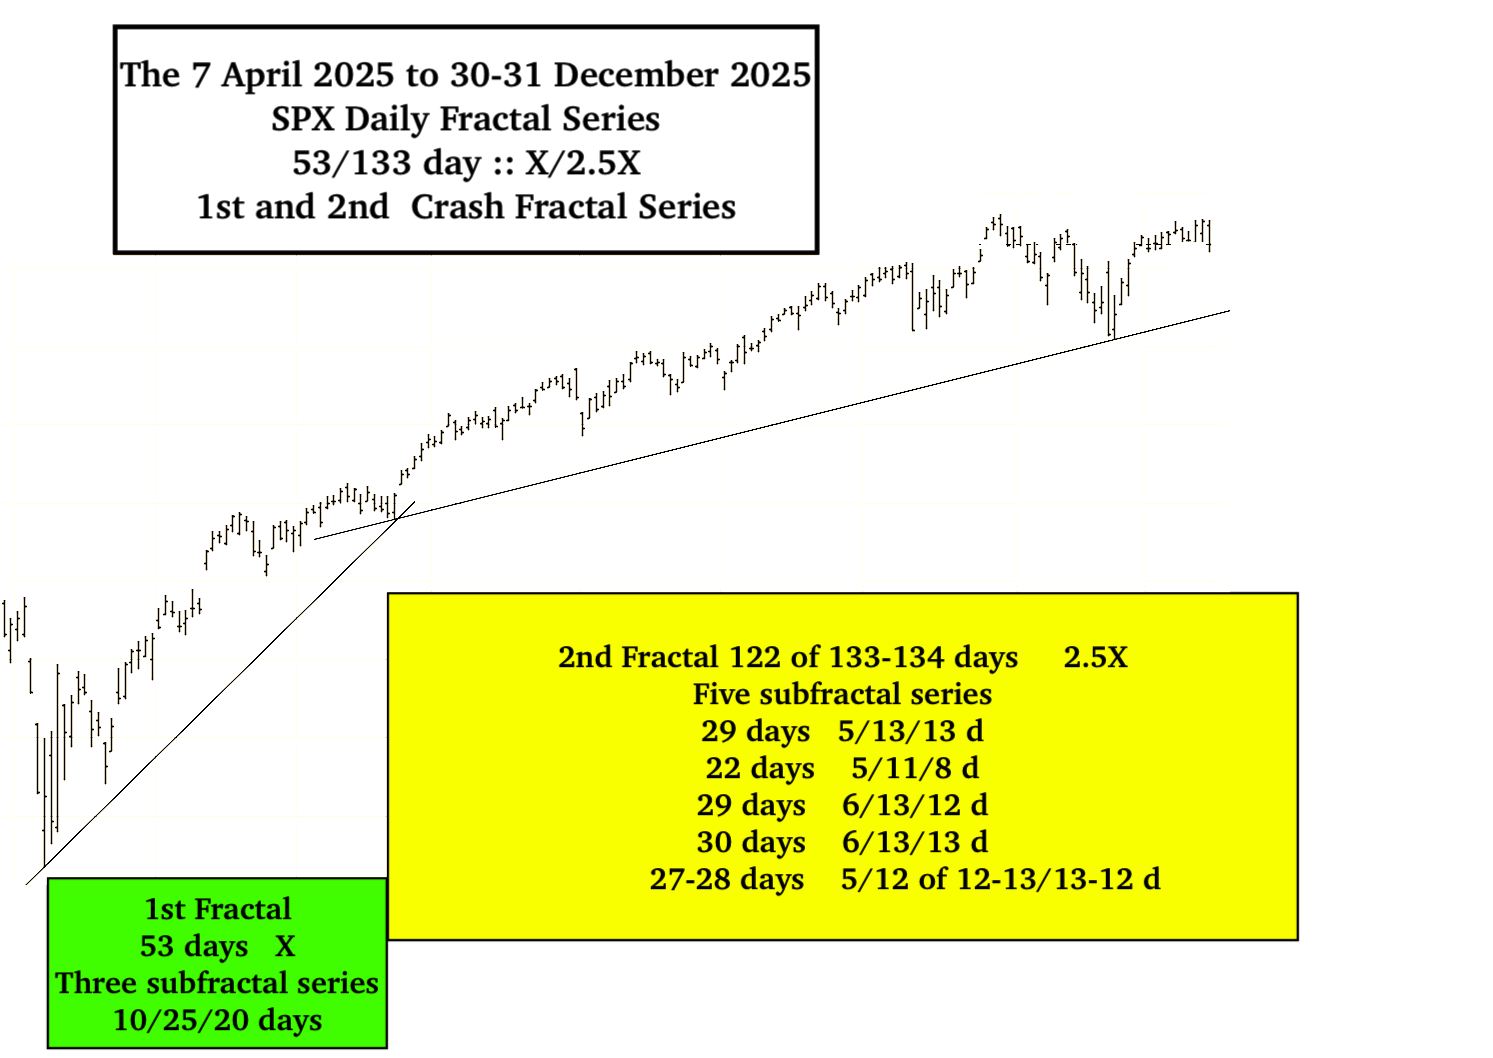
The SPX 16/32/39 monthly terminal 29 quarter 3rd Fractal growth pattern has self similarity to the SPX 7 April 2025 terminal near maximum terminal growth 34/69/83 day :: x/2x/2.5x 26 Dec 2025 current peak valuation.
An 1987 type of crash is expected over next 7 trading days.
The initial phase of the 1982 13/32 0f 33 year global equity crash will occur over the next 6-8 trading days.
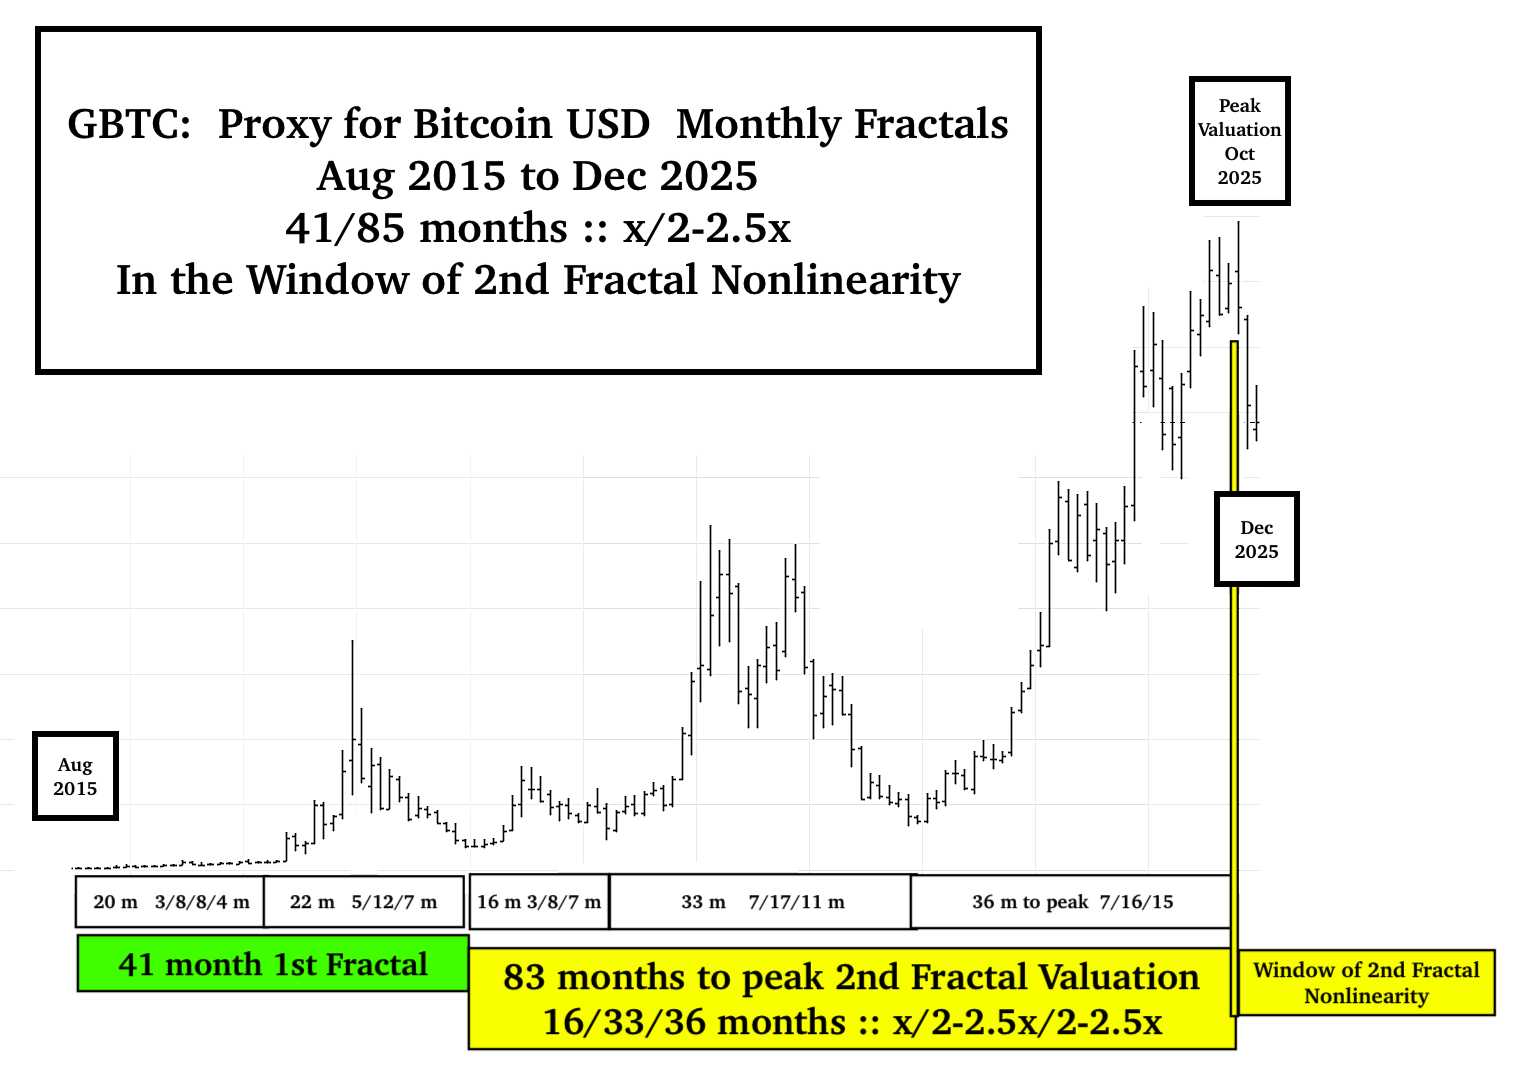
Bitcoin in US dollars has preceded the equity crash with a greater than 30% loss since its peak in Oct 2025, following a GBTC proxy Bitcoin in USD first and second fractal series initiated in August 2015 of 41/85 months :: x/2-2.5x to date The peak valuation and incipient second fractal crash occurred in October 2025 on the 83th month of the 2ndd fractal and is ongoing.
Why are gold and silver in US dollars at their zenith valuations, while Bitcoin in US dollars has fallen 30% from its high valuation?
Other countries who have witnessed the current failing of the successful 75 year American institutional alliances and trade policies – yet still utilize America’s Bitcoin,(not China) have deleveraged their positions. Gold and silver in collapsing US dollars have always been highly valued in all Asian and most European countries. Hence, near the terminal peak of the 1982 13/ 32 of 33 global equity bubble, there has been a weakening-dollar-denominated rise in gold and silver valuations vice a non paradoxical decline in Bitcoin dollars.
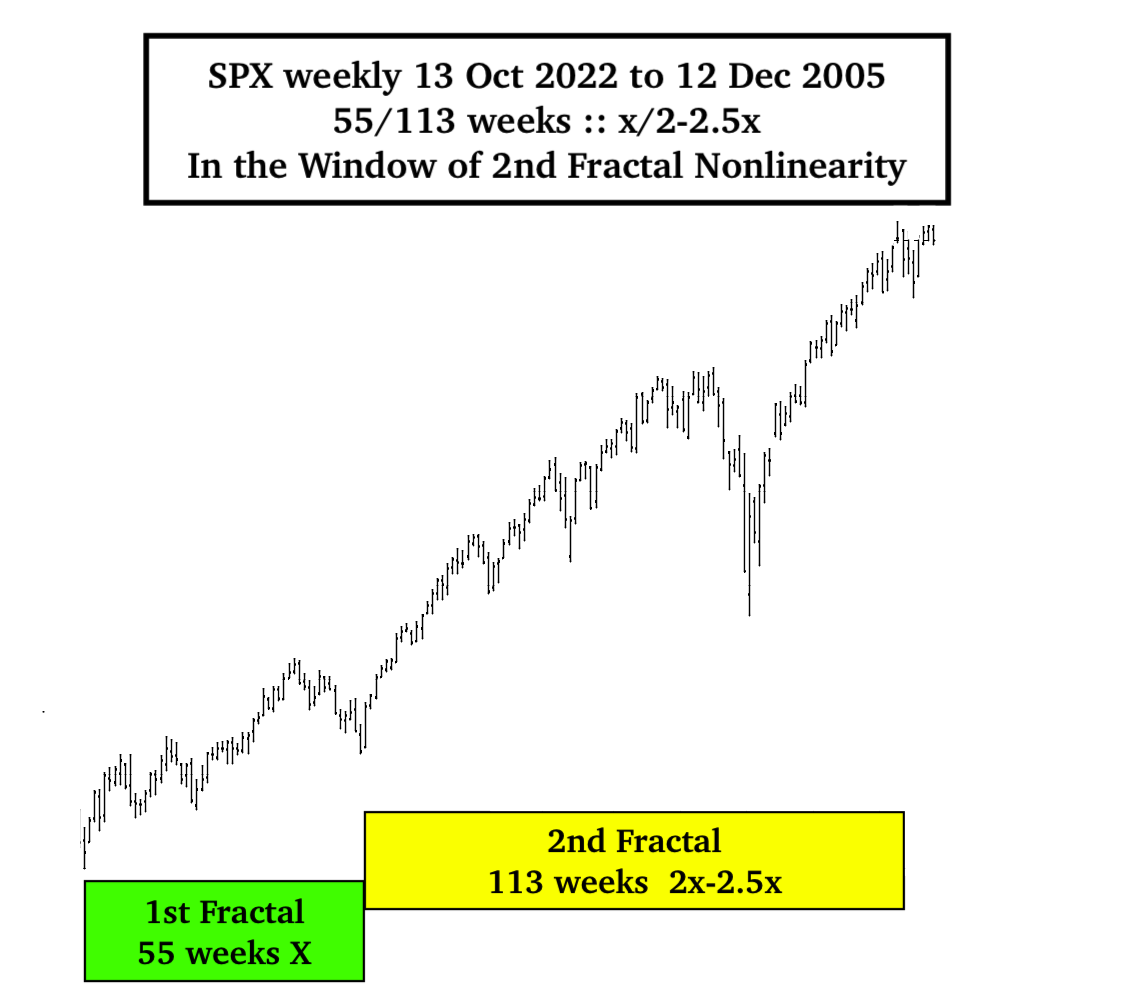
From the Economic Fractalist 15 May 2005 Mainpage Re: 2nd Fractals (Cycles) : “A sudden nonlinear drop in the last 0.5x time period of the 2.5X is the hallmark of a second cycle and characterizes this most recognizable cycle.” … “This means that the second cycle can last anywhere in length from 2x to 2.5x.“
In the Window of Power Law Distribution 2nd Fractal Asset-Debt Macroeconomic System Self-Organized Criticality:
The original 7 April 2025 53/133-134 day :: x/2.5x 1st and 2nd fractal series ending 30-31 December 2025 is the correct fractal model with the incipient 1982 13/32 0f 33 year :: x/2-2.5x crash in the final trading days of December 2025.
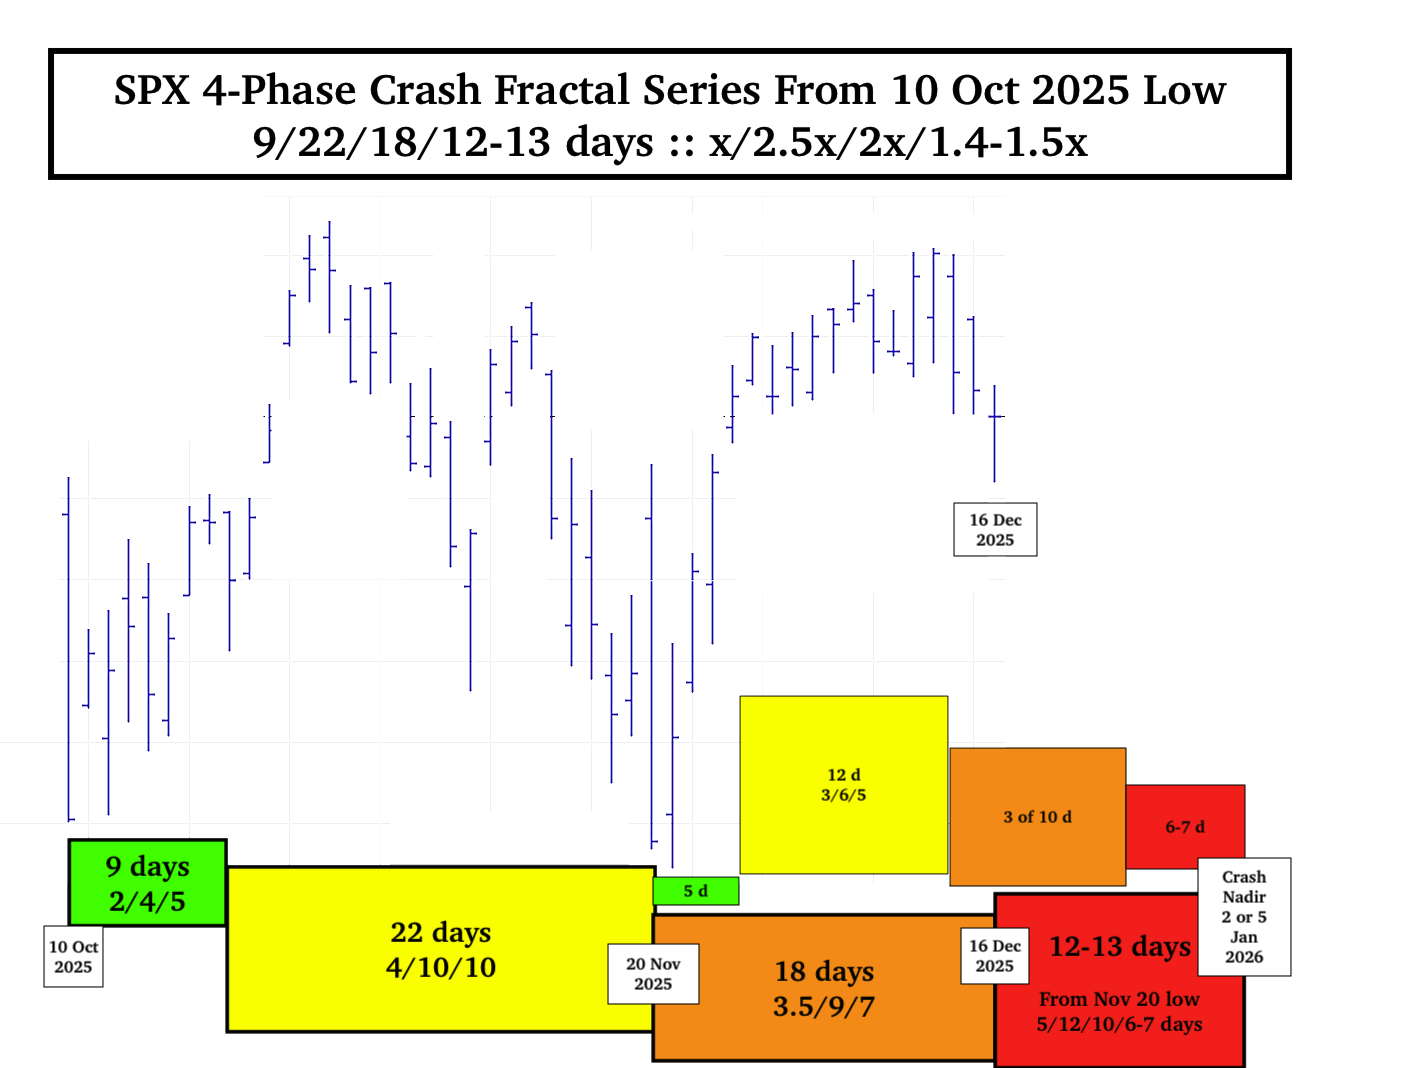
On 20 November 2025 the asset debt system self-ordered a SPX 5/12 of 12-13/13-12 day :: x/2-2.5x/2-2.5x fractal series to initiate the terminal portion of the 12 Aug 1982 13/32 of 33 year :: x/2.5x 1st and 2nd fractal series; the terminal portion of a 13 Oct 2022 55/113 of 138 week :: x/2-2.5x 1st and 2nd fractal series, and the terminal portion of a 7 April 2025 53/122 of 133-134 day :: x/2-2.5x 1st and 2nd fractal series. The nonlinear crash will be during the last days of the December 2025 12-13 day 3rd fractal.
The incipient end December global equity crash will be an affirmation for those economists interpreting the copious data as showing extreme weakness of the American consumer, the American consumer-based economy, and the world economy. It will be a wake-up call for those who measure the economy primarily by equity market performance.
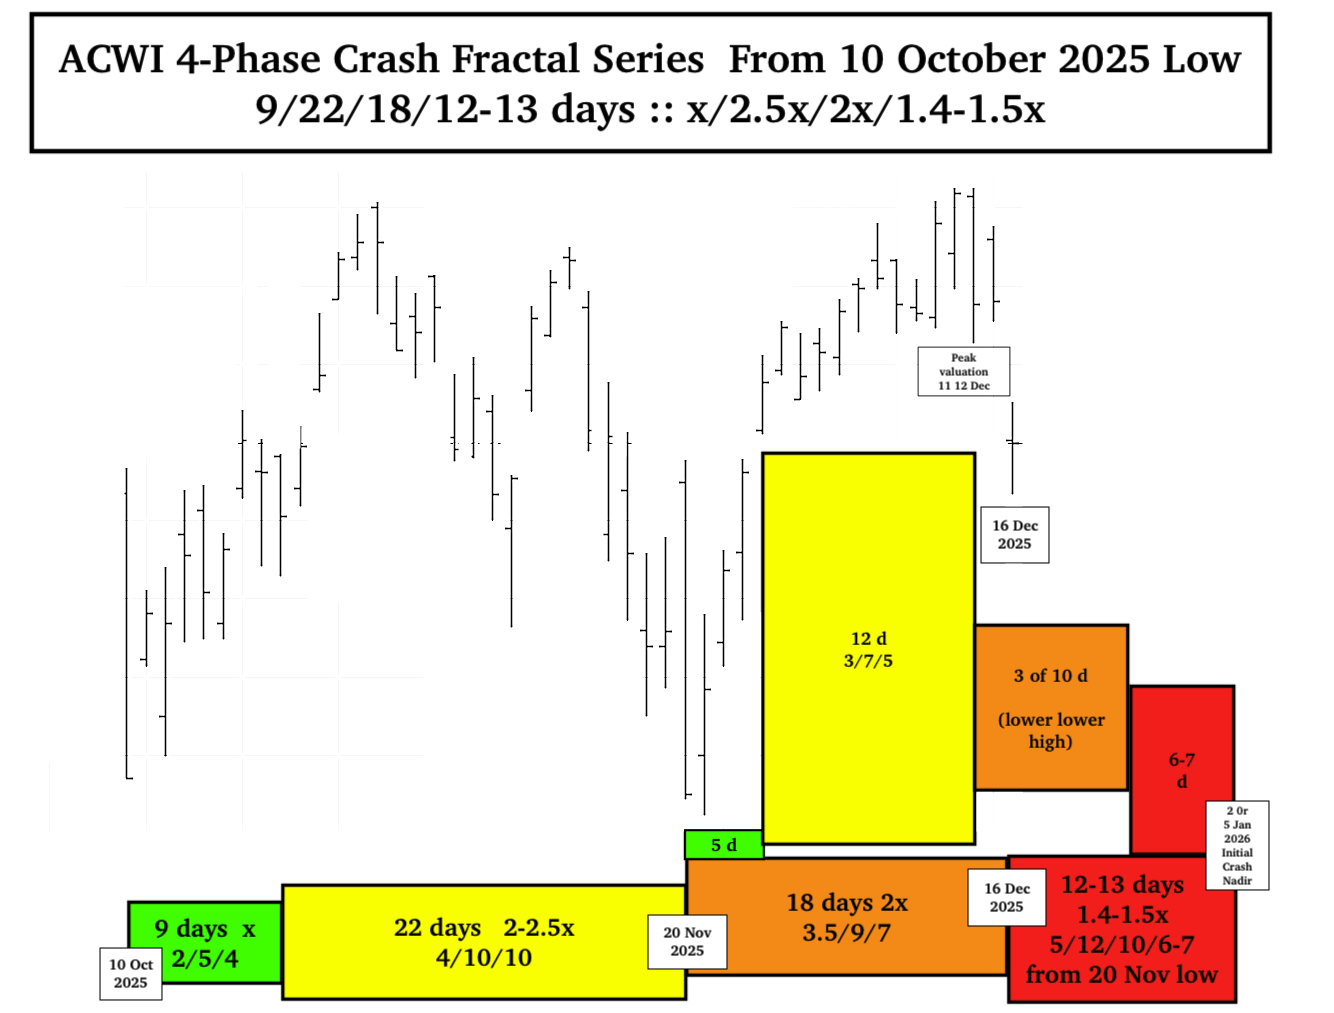
The 10 Oct to 20 November 2025 day fractal subseries is now observed as a 6/13/13 day :: x/2-2.5×2-2.5x fractal series with trend lines better seen on SPX futures. While the SPX has not exceeded its 29 Oct 2025 peak valuation, the Wilshire 5000 and the global ACWI, propelled by rotation of money into the ‘safer stocks of the DJIA’ had valuation peaks on 11 and 12 Dec 2025.
Will the end December 2025 initial lower low nonlinearity reach below the 7 April 2025 valuations? This nonlinearity is the beginning of about a 45 week progression to a final lower low valuation with an expected 80-90 % loss of equity valuation. There will be sharp valuation counter growth periods within this overall decay time frame.
Added 16 Dec 2025.
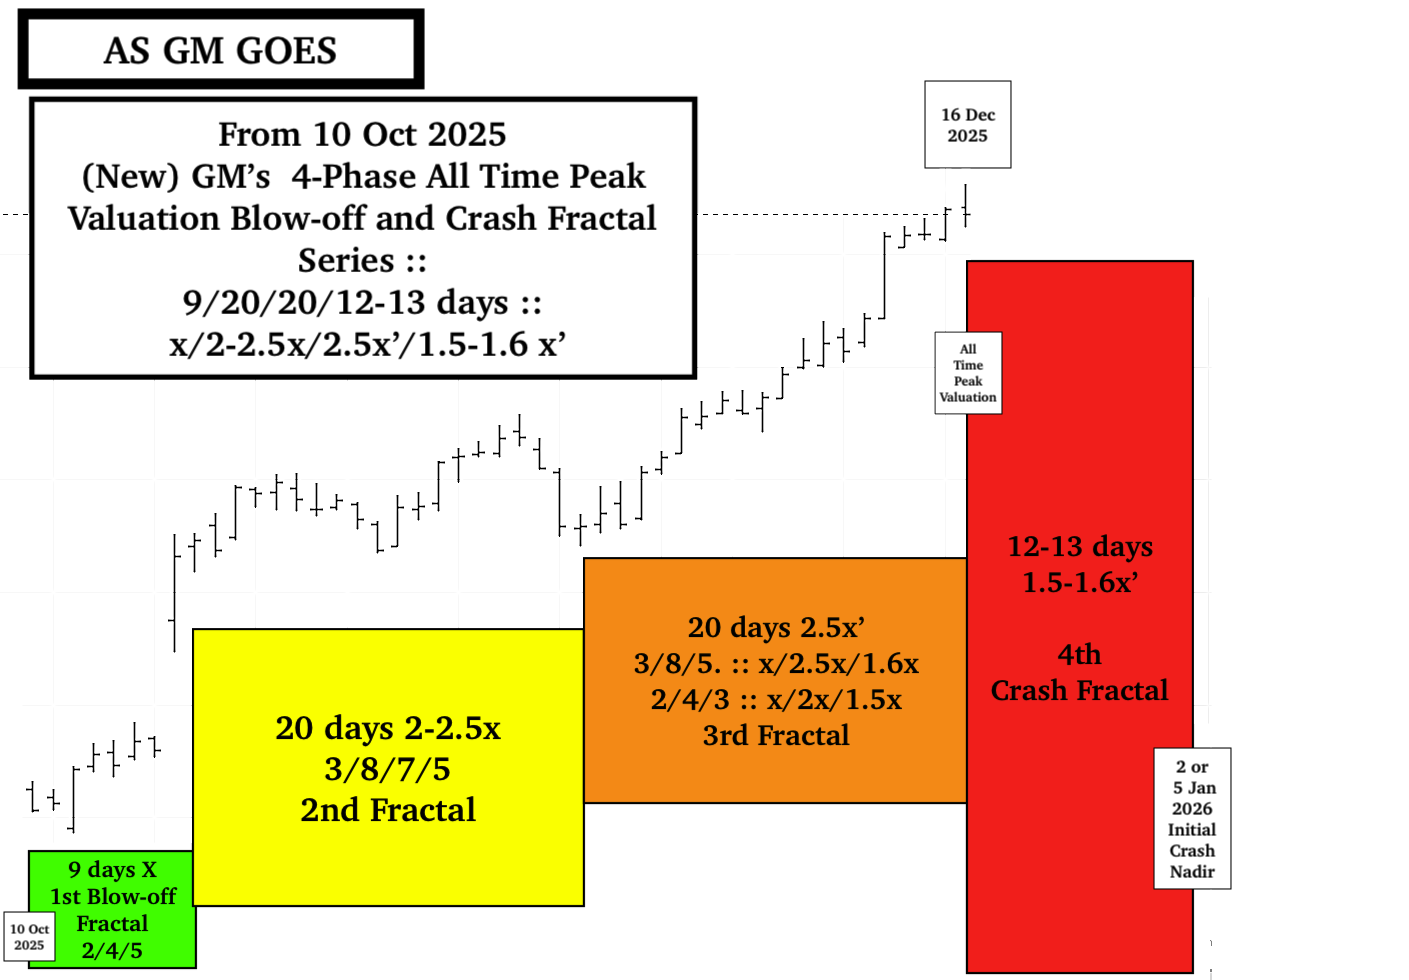
Blow-off intrahigh valuation for GM and gap lower valuation for the 92 trillion dollar equivalent ACWI …
The last of the speculative money has rotated into the ‘safest equities and major banking equities with blow-off valuation in both areas. Paradoxically the 92 trillion global equity composite ACWI had a gap down lower on 16 December, rising during the day but unable to fill the gap. Retrospectively both the 2-phase and 3 phase 7 April models may be correct with an initial targeted crash nadir on 2 or 5 Jan 2026.