The energy-mass units of protons, quarks, electrons, photons, and neutrinos will ultimately be shown to be sequential time-based fractal rearrangements of subunits on the order of 10 E7-E18 Planck length units with rearrangements occurring on the order of 10 E7-E18 Planck time units, far too small for human discernment, creating the mathematical ‘macroscopic’ probabilistic wave functions of Schrodinger. The fractal rearrangements transient from high entropy-low ordered states to low entropy – relatively highly order states and vice-versa with complete conservation creating spin, angular momentum, and directional vectors.
The human asset-debt macroeconomic system evolves in a time based fractal manner from peaks of high asset valuation and high levels of bad unrepayable private debt to nadir low asset valuations with low levels of bad unrepayable private debt.
For the 1807 US US hegemony, 36/90/90/54-57 year :: x/2.5×2.5x/1.5-1.6x represents the fractal evolution of the asset-debt macroeconomic system with asset valuations nadired in 1807/1842-43, and 1932. The 90 year 3rd fractal and the 54-57 year 4th fractal are composed of a 1932 10-11/22-23/22-23 year :: x/2x/2x fractal series ending in 1982 and a 1982 13/33/33/20 year :: x/2.5x/2.5x/1.5x fractal series ending in 2077.
Quantum particle physics and Lammert Fractal Economics have somewhat similar problems for human definition and understanding: the former has fractal time scales and sequential fractal rearrangement energy/mass unit lengths too short for human perception(Einstein was right regarding determinism in the quantum world); the latter has major peak and nadir asset valuation time scales too long in human lifetime units for mass population pattern recognition.
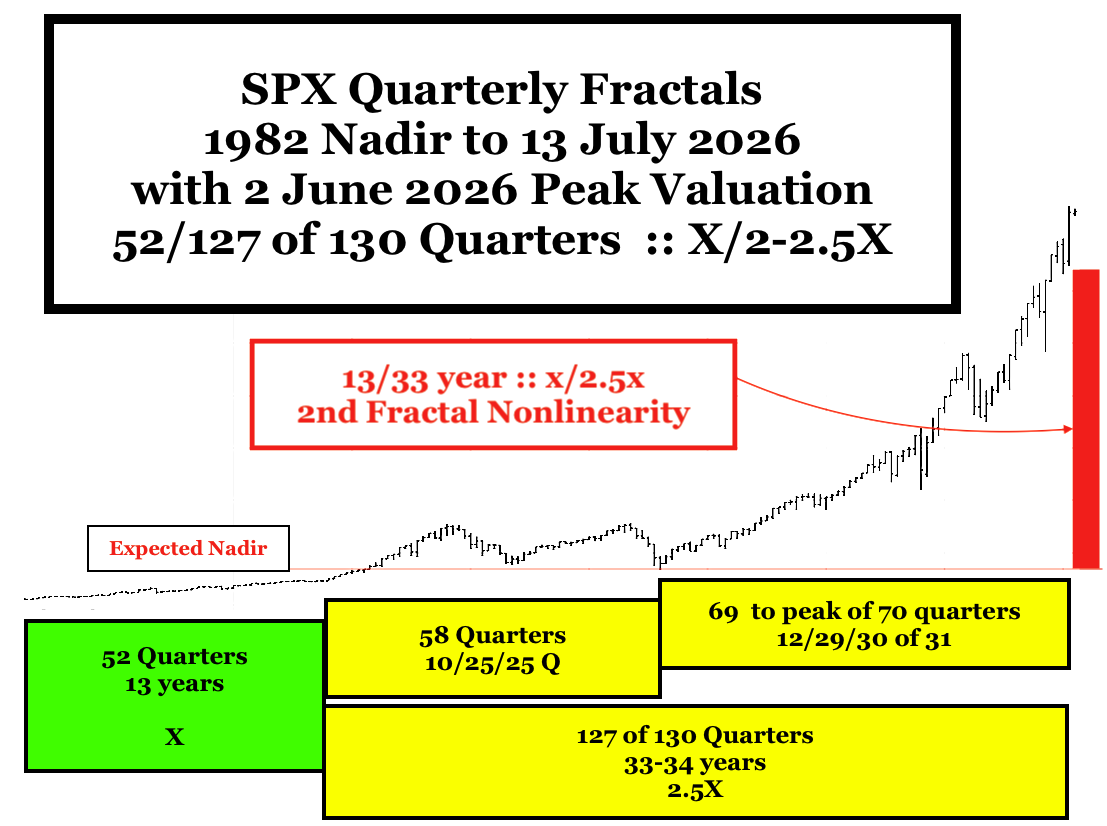
The terminal portion of the 1982 to 2026 13/33 year :: x/2.5x 1st and 2nd fractal series began 7 April 2025 following an ACWI 11+/23/28-29 week :: x/2-2.5x/2.5x terminal growth series ending 2 June 2026.
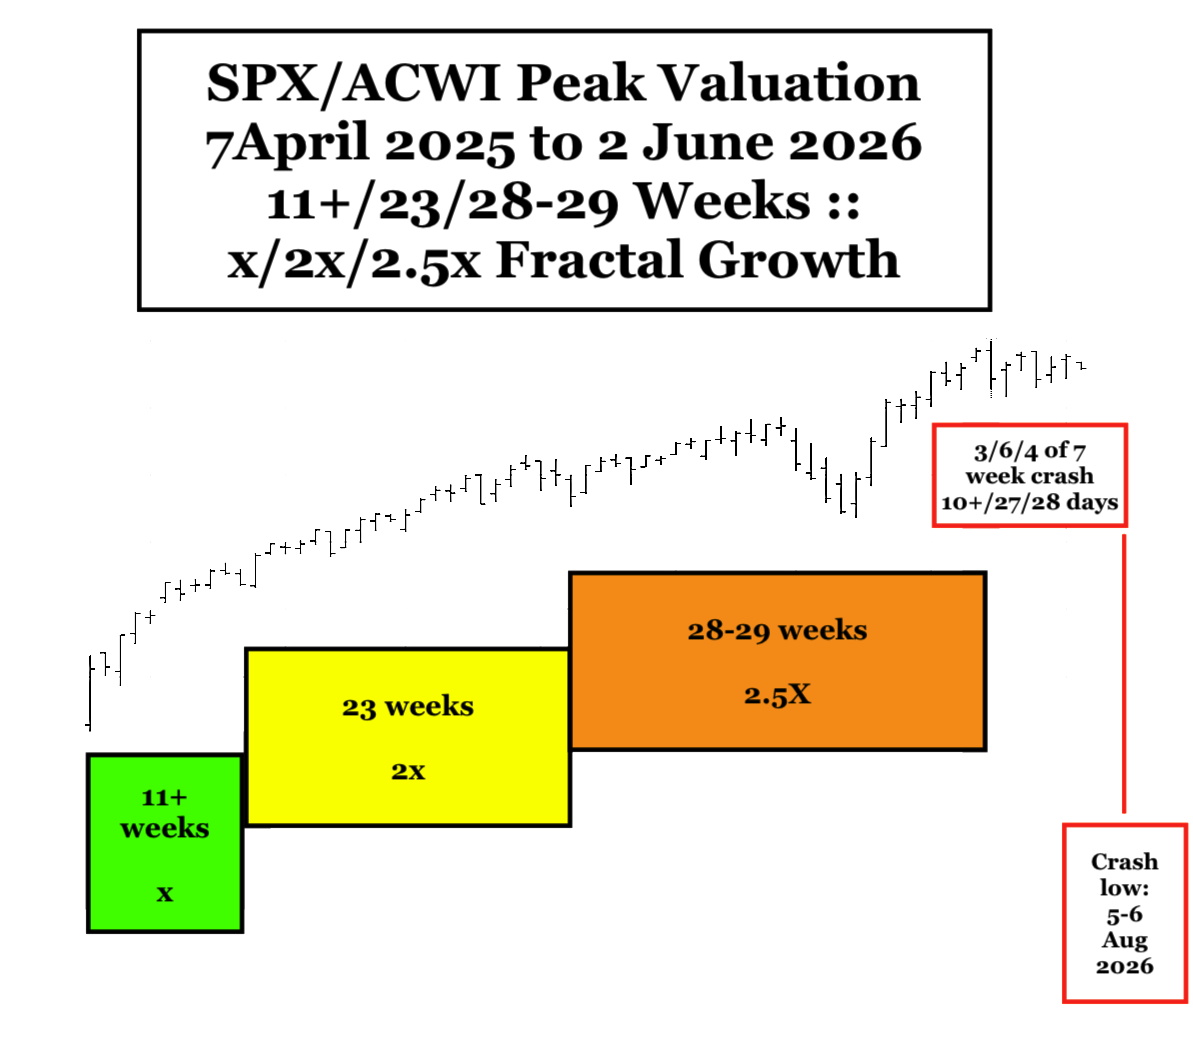
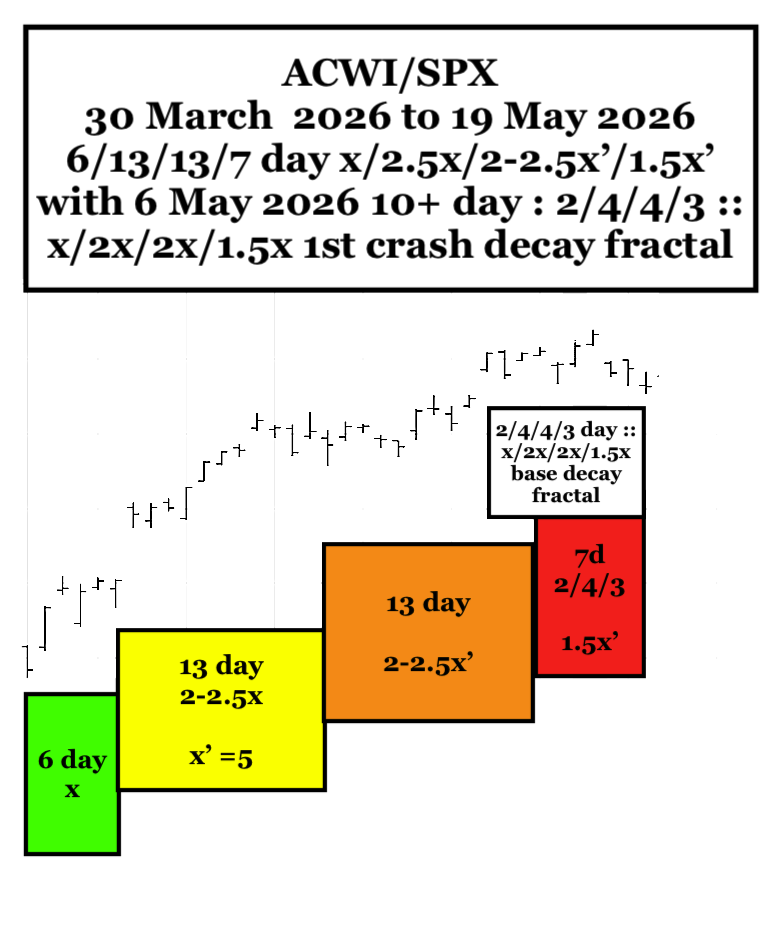

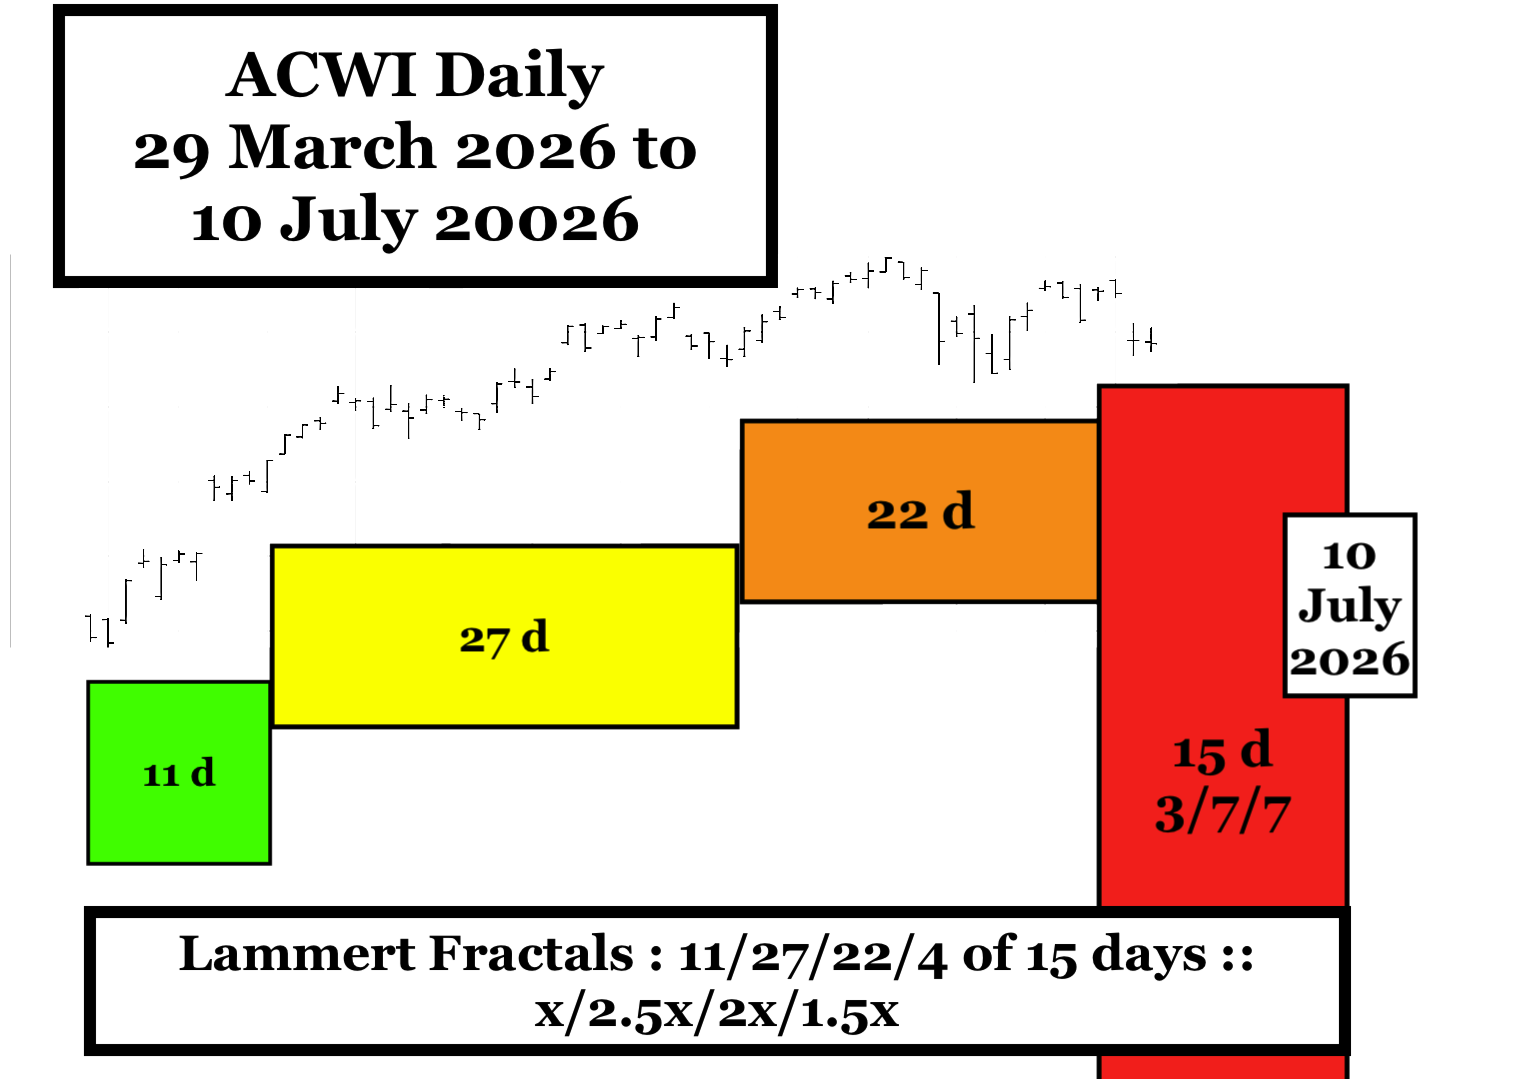
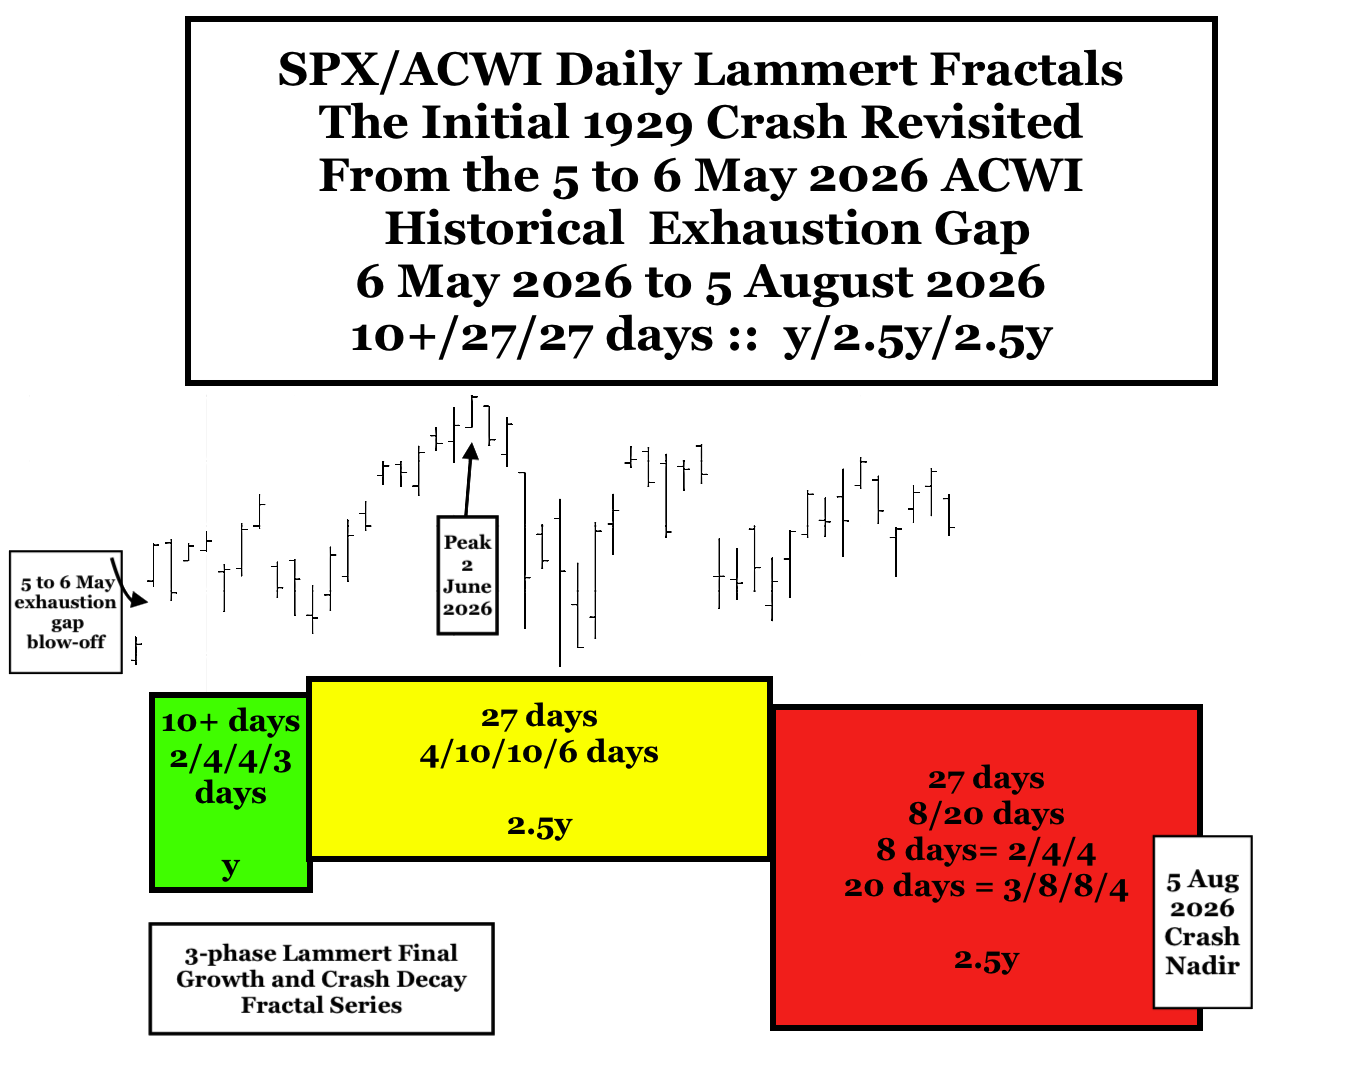
After a historical daily exhaustion gap between 5 and 6 May 2026, the ACWI is following a 6 May 2026 10+/27/27-28 day, 1929-like :: y/2.5y/2.5y crash 3-phase crash fractal decay series. As of 13 July 2026 ACWI is on day 11 of the 27-28 day 3rd crash fractal with an initial crash nadir expected on 5-6 Aug 2026. Initial Major Fractal Crash Decay begins in Final Terminal Fractal Growth.
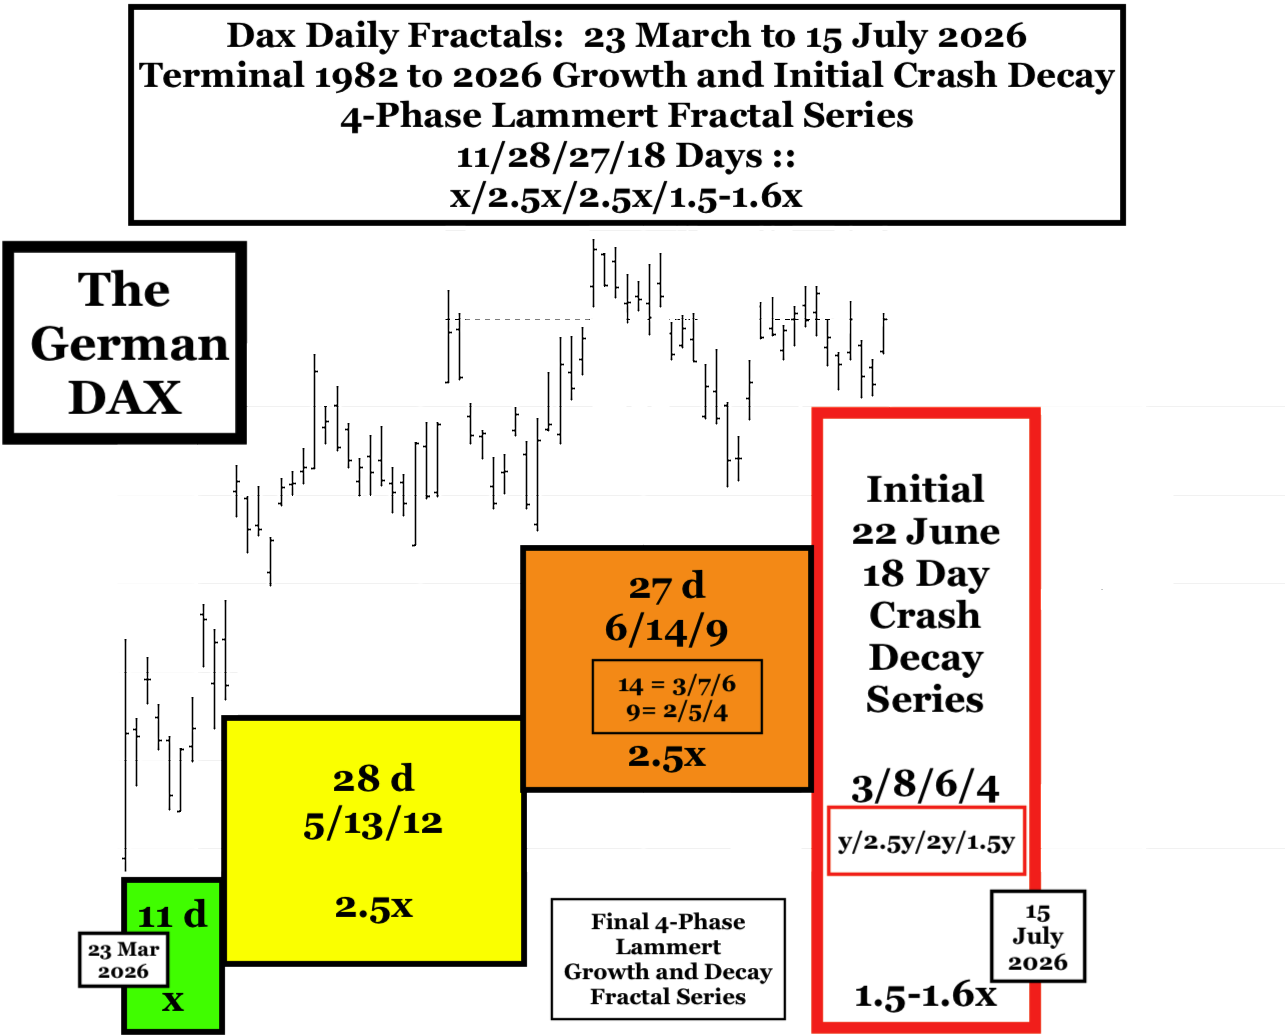
Added 18 July 2026: The Final SPX/ACWI 6 May to 15 July 2026 Lammert fibonacci growth sequence in the 1982: 13/33 year :: x/2.5x sequence.
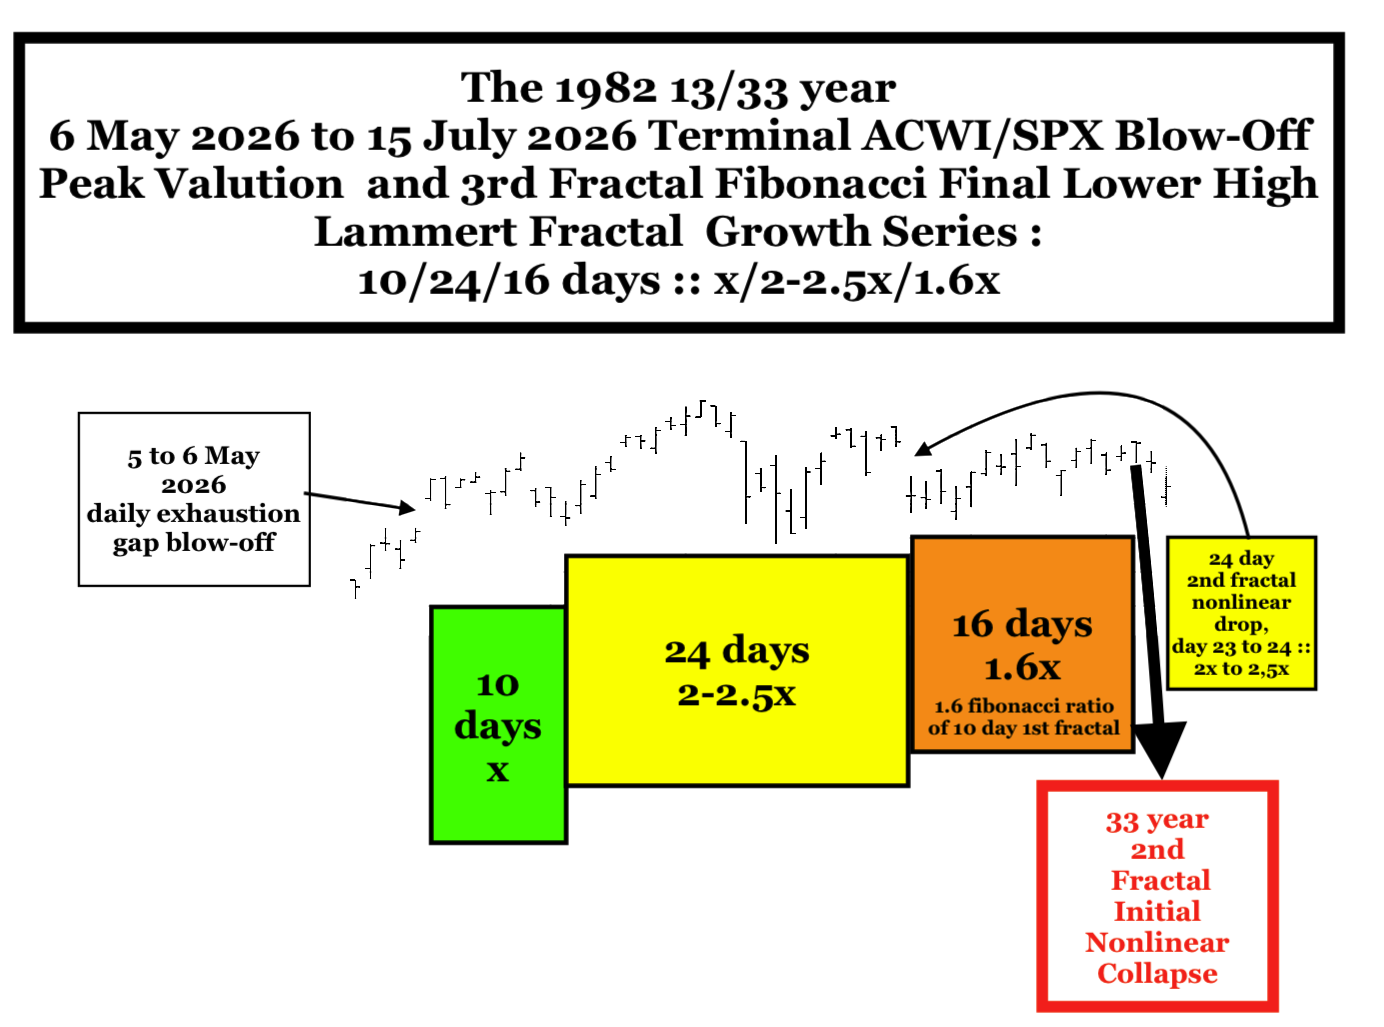
The ACWI/SPX peaked on 2 June 2026, the 10th day of a 24 day 2nd fractal of a 6 May to 15 July 10/24/16 day :: x/2.5x/1.6x 3-phase terminal Lammert fractal series. The series started on 6 May 2026, which represented a historical daily exhaustion blow-off from the 5 May close for the ACWI composite global equity index. The 6 May 10 day 1st fractal was composed of 2/4/4/3 day :: x/2x/2x/1.5x 4-phase Lammert fractal series. The 24 day 2nd fractal was composed of a 3/7/8 day and a subsequent 2/5/4 day 3-phase Lammert fractal series with the 2 June peak valuation composed of an interpolated 2/5/5 day :: x/2.5x/2.5x maximum growth series. A nonlinear lower low gap occurred between day 23 and 24 of the 24 day 2nd fractal in the terminal 2x-2.5x range which characterizes 2nd fractals (see 2005 Main page of The Economic Fractalist). 15 July 2026, the 16 day 3rd fractal final lower high is day 6 of a 23 June 29026 4/8/6 day :: x/2x/1.6x Lammert fractal series and represents a 1.6 fibonacci ratio of the 10 day 1st fractal phase to appropriately conclude the 1982 13/33 year x/2.5x growth.
From the 15 July 2026 lower high peak valuation 2.5x, 33 year 2nd fractal unprecedented valuation nonlinearity is expected. The global equity crash is secondary to historically extreme equity valuations and leveraged and malinvested historically high private debt. The timing is occurring with the inception of Oil’s 3rd fractal growth within a 9/21/3 of ? 18-21 week :: x/2.5x/2-2.5x 3-phase growth series congruent with an escalating Iran war and historically low US oil strategic storage reserves.
Within the last two years declines in market valuations have been associated with tariff announcements and the initiation of the Iran war. The coming massive decline will be associated with the current escalation of the war and dramatic increases in energy prices.