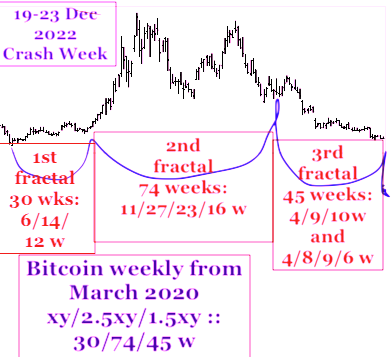
Friday 13 January 2023 ; The Nonlinear Global Nadar Valuation. (Nikkei 21/53/42/30 Day x/2.5x/2x/1.5x Fractal)
Does the global Asset-Debt Macroeconomy self Organize into defined time-based fractal patterns under the conditions set by central banks and more recently consumer inflation?
That is the question this blog has attempted to answer. Do the two simple time-based fractal patterns: a 4-phase x/2-2.5x/2-2.5x/(peak)/1.4-1.6 x pattern and a three phase x/2-2.5x/1.5-2.5x pattern define the math of an asset-debt self-assembly system with mathematical self-organizing characteristics similar to astrophysics, physics, chemistry, biochemistry, and hence biology?
Certainly the US 1807 36/90/90 year :: x/2.5x/2.5x pattern ending with an 8 November 2021 high for the composite Wllshire and bitcoin in the 90th year third fractal fit three elements of the four element four phase pattern with lows in 1842-3 and 1932.
From 1932 to 1982 a x/2x/2x pattern is observable of10-11/21/21 years. Since 1982 a 13/28 year pattern is observable.
The monthly self-assembly fractal groupings for US equities since the massive 2009 QE programs have been:
5/13/10/7 months :: a x/2.5x/2x/1.5x fractal pattern
3/7/7 months and 8/17/17 months both x/2-2.5x/2-2.5x fractal patterns
10-11/26/16 months: a x/2-2.5x/1.5x fractal pattern
and starting in March 2020. 8/17/11 of 12 months :: a x/2-2.5x/1.5x fractal pattern
After the pandemic start and a 6/15/15 day :: x/2.5x/2.5x crash devaluation nadiring in March 2020, global central banks and governments have created a short lived super bubble involving real estate, equities, commodities, and used cars. 40 year high consumer inflation provided the feedback control measure on western central banks who have ramped up interest rates in a historical accelerated fashion with absolute levels not seen since 2007. Qualitatively the crash in equities and commodities will later be explained by the interest rate increases and the unmanageable debt burden on heavily indebted individuals, corporations, and sovereigns impacted by those increases.
The Nikkei with Japan’s high total debt to GDP ratio is the best proxy for the asset-debt system and its self-organizing fractals.
The monthly/weekly, and daily self-assembly fractals for Japan’s Nikkei since March 2020 are:
Monthly: 8/17/11 of 12 months
Weekly: 33/72/42 of 45 weeks (72 week low 8 March 2022) :: x/2-2.5x/1.5x
Daily: the final 42 of 45 weeks:
13/30/28 days :: x/2-2.5x/2-2.5x and
{(2)/5/10/7 =21}/53/42/30 days :: x/2.5x/2x/1.5x
The final 30 days from day 42 the secondary peak on 30 Nov2022 is a (2)/5 /12 of 13/13 days with a nonlinear nadir low ending on Friday 13 January 2023.
