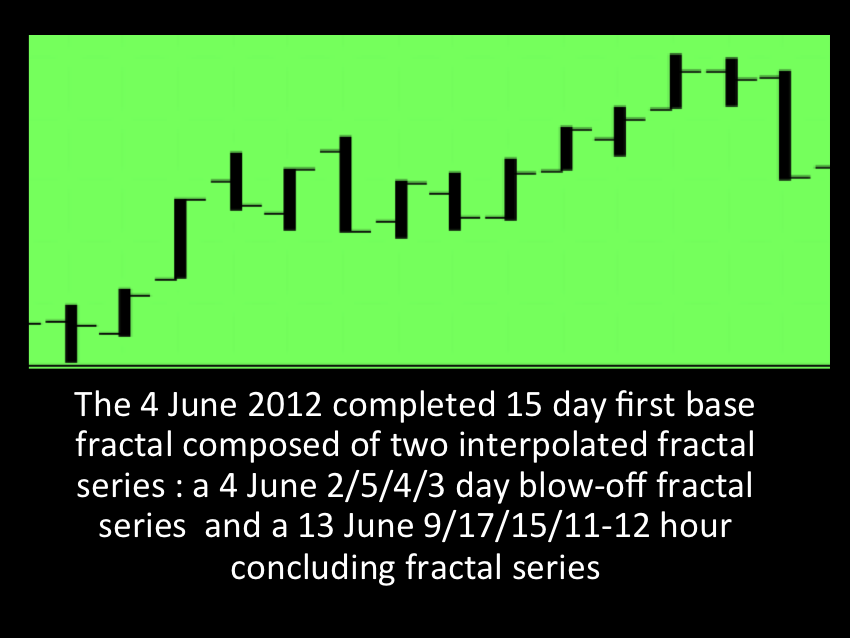
The 13 June to 21 June 2012 interpolated averaged 7.5/18.7/15/11-12 hour :: x/2.5x/2x/1.5-1.6x Lammert fractal series.

The incipient evolution of the 4 June 2012 third fractal of the 4 October 2011 54 day base fractal shows within its fractal progression that an equity blow – off pattern will occur (and finish):
the 4 October 2011 three phase Lammert growth fractal series,
the 2003 three phase Lammert growth fractal series,
the 1990 three phase Lammert growth fractal series,
the 1982 first and second Lammert growth fractal series,
the 1932 three phase Lammert growth fractal series,
and the 1789 US two phase Lammert growth fractal series.
Global money will preferentially flow into the relatively (much) stronger US equity system and money will temporally exit US debt instruments driving US long interest rates temporarily higher and flow into the US equity composite system. This is the qualitative reason behind the US equity blow-off.
But it is the mathematical fractal pattern development that shows a blow-off in US composite equities is coming the end of June and July, August, and perhaps early September. See the previous posting for the initial 2/5/4/3 day Wilshire blow-off.
The incipient 4 June 2012 third fractal is composed of two conjoined and interpolated Lammert fractal series. The first is a blow-off series of 2/5/4/3 days.
A underlining slope line is curvilinearly up, that is, the slope line from day 1 on 4 June 2012 to 21 June 2012 does not contain all of the intervening valuation points.
The final 3 day blow-off of the 2/4/5/3 day fractal which represents 17 trading hours was the second fractal of an interpolated 9/17/15/11-12 hour fractal series.
The macroeconomic debt-asset system is an integrated precisely mathematical deterministic paradigm.
A 9 and 17 hour, first and second fractal series, would have as an ideal mathematical x/2.5x pattern 7.5 and 18.7 hours. The averaged fractal pattern would be 7.5/18.7/15/11-12 hours :: x/2.5x/2x/1.5-1.6x.
This combined interpolated series completes a 15 day (first day is upgoing in valuation) base fractal (note the underlying slopeline from day 1 to day 15 contains all intervening valuation points) with an expected blow-off sequence of 15/30/16-30 days :: x/2x/1.1x-2x.
Look for a nonlinear drop on day 30-31 of the second fractal. The third fractal should start thereafter. The peak valuation time frame is still the end of August 2012 or early September 2012.
The Wilshire’s 11 October 2007 nominal high was about 15940 or about 2025 points away from the Wilshire’s 22 June 2012 closing valuation.
It will likely be bested.


