The 1981 13(-)/31 Year :: x/2.5x Macroeconomic System’s Great 31 Year Second Fractal 21 February to 31 March 2023 Nonlinear Devaluation

(Updated 26 February 2023) Contained within the US Hegemony’s 1807-2074 36/90/90 /54 Year Great Fractal Series :: x/2.5x/2.5x/1.5x with lows in 1842/43 and 1932 and a 90 year high in (November) 2021 is an interpolated first and second fractal series of 13 (minus)/31 years :: x/2-2.5x starting in 1981. The first 13 year base fractal was composed of a 3/7/5 years series and the second 31 year fractal composed of two sub fractals: 3/7-8/7-8 years and 3/6/6/4 of 4 years.

It is the assertion of this website that the asset-debt macroeconomic system self-organizes its nadir/peak valuation points into two elegantly simple and highly efficient mathematical valuation growth and decay time-based fractal patterns, either a three phase pattern or a four phase pattern. Nadir valuations define the time length of all fractal (subunit) in the three phase fractal series. For the four phase fractal series, nadir points define the time lengths of first, second, and fourth fractal subunits with a peak valuation point defining the third fractal subunit. The fourth decay fractal starts at the peak valuation of the third fractal. Cycles of debt and the money supply expansion grows asset variety and asset valuations until an intrinsic maximum production and maximum valuation peak is reached under prevailing interest rates conditions and consumer saturation; thereafter asset valuations decline as bad debt liquidation and asset overproduction, asset over-ownership, and asset over valuation causally result in a devaluation, (often nonlinear) of asset prices to a natural nadir valuation.  The second fractal subunit of both the three phase and fourth phase fractal series is associated with nonlinear lower gap devaluations.

All of asset-debt macroeconomic system’s cycles described in the first paragraph represent large time scale yearly cycles falling into the macroeconomic system’s two ubiquitously observable, self-organizing, elegantly simple, time-based fractal patterns: either a four phase fractal series: x/2-2.5x/2-2.5x/1.5-1.6x or a three phase fractal series: x/2-2.5x/1.5-1.6x to 2.5x . Each subunit, i.e. , x, 2-2.5x, et.al., is described as a ‘fractal’ with four individual fractals in the four phase fractal series and three fractals in the three phase fractal series. Each yearly fractal can be subdivided in shorter time scale subunits , ie, quarterly or monthly, weekly, daily, hourly, and minutely with transient shorter time scale saturation buying peak valuations and saturation selling nadir valuations. 


Large time scale qualitative money and debt expansion cycles occur via fractional banking lending, financial engineering via derivatives, CMO’s, CDO’s, et. al., lowered interest rates, recent QE programs associated with near zero to negative interest rates and outright money printing recently associated with central bank MBS’s. These money debt expansion modalities support cyclical asset creation and asset valuation. Central bank interest rate increases then contract debt and money growth. Fed funds rate increases have preceded the 2000 and 2008 bubble collapses. Unprecedented money growth during Covid is now being QT’ed in a historically unprecedented and accelerated fashion to combat consumer inflation. Whipsaw QE/QT operations wlll continue during the US’s 54 year Fourth Great Fractal from its November 2021 90 year (2.5x) high in response to the system’s asset valuation declines counterbalanced by the system’s interest rate, labor shortage, and commodity shortage dependent countervailing associated consumer inflation.

The interpolated 1981 13/30-31 year first and second fractals (interpolated among the larger 1807 US hegemonic Great Four Fractal Series) described in the first paragraph represent a period starting with US interest rates in the 17-20 % range with a ratcheting-down of interest rates to nearly zero (negative in Europe) associated with general asset growth and valuation appreciation for over 40 years. The 30-31 year second fractal of the 1981 interpolated 13/30-31 year two fractal series is expected to undergo a historical terminal second fractal nonlinear devaluation as described in the 2005 main page of this website.

Look to Gold in USD for the conclusion of the 13/31 year first and second fractal cycle with similar nonlinear devaluations in global equities, commodities, and crypto.

Gold from its monthly low: 13/32/26/ 19 of 20 months.
From gold in USD’s recent 29 day base fractal 29(x)//(19/46 = 64 = 2.5x’, ideal base x’ = 26 days)//1.5x’ = 39 days.

From gold’s peak 12 day base fractal 3/7/4 days; 12//(9/18 =26)//15 :: x/2-2.5x’/1.5x’ ending 31 March 2023 …

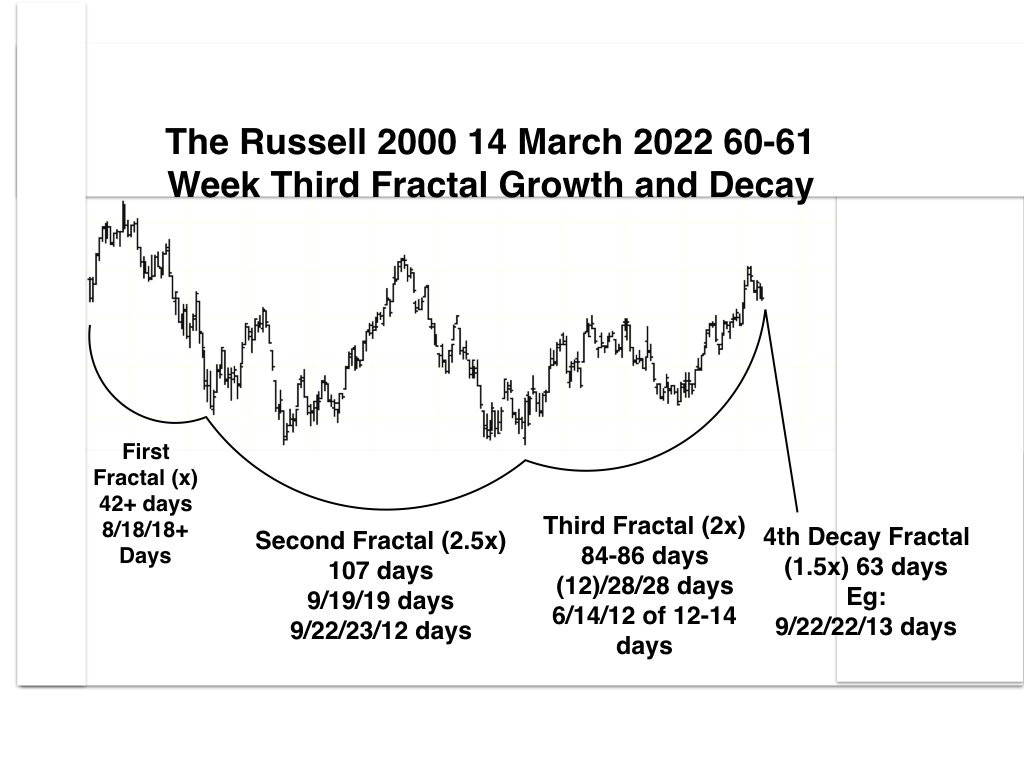
For US equities a March 2020 x/2.5x/2x ::28/70/56 week peak is being concluded by an interpolated 4/10/10/1 of 6 week :: x/2.5x/2-2.5x/1.5x fractal series ending 31 March 2023 with an equivalent daily series of 19/48/38/28 days :: x/2.5x/2x/1.5x.

Bitcoin in USD starting trading in Sept 2014. Its first fractal series is 30 months in length and is composed of two fractal subseries: (4)/8/8 months and 3/6/6 months. The second fractal is composed of two recurrent monthly fractal patterns 7/17/15 months and 7/17/14 of 15 months or 30/73 months and is following the same daily pattern as US composite equities with an expected low valuation on 31 March 2023.

Expect historical asset nonlinear devaluation.

The Mathematical Quantitative Collapse of the 2009 American Asset Super-bubble

Do the valuation of assets under the QE/QT parameters set by the central bank in response to recessions, asset valuation collapses, and countervailing consumer inflation, self assemble into defined time-based fractal patterns?

The argument for this proposition is contained under an identifiable US 1807 36/90/90/54 year ongoing umbrella quantitative x/2.5x/2.5x/1.5-1.6 fractal pattern with valuation lows in 1842/43 after the valuation asset high Panic of 1837, with the 90 year low in 1932 after the valuation high in 1929, and with the 1932 to 2021 90 year high valuation in (November) 2021.

The asset-debt valuation system’s two quantitative self-assembly patterns are composed of either one: a four phase pattern: x/2-2.5x/2-2.5x/1.5-1.6x which represents the big picture 1807 36/90/90/54-56 year US hegemony pattern or two: a x/2-2.5x/1.5x-2.5x three phase pattern. The nomenclature in identying the subunits of the 4 phase pattern are arbitrarily named as the first, second, third, and fourth fractal of the fractal series and for the three phase phase pattern, the first, second, and third fractal. Hence the 4 phase fractal is composed of 4 fractals (subfractals) and the three phase fractal is composed of 3 fractals(subfractals). With the central bank’s QT response to consumer inflation, the length of the second fractal of each series determines the ideal length of the first base fractal and hence the ideal length of the third (and fourth) fractal.

Since 1932, the third 90 year and fourth 54-56 year fractals are composed of two interpolated fractal patterns which also conform to the two patterns defined above. The first is a 10-11/20-21/20-21 year fractal series :: x/2x/2x ending in 1981-82 and the second series a 13/31-33/31-33/20 year pattern ending in about 2074. The 1981-1982 13 year base fractal is composed of a 3/7/5 year fractal series followed by two subseries: the first a 3/7/7 year fractal series ending in 2009 and a second 4/10/6-7 year fractal series ending in 2025 or 2026. The second yearly fractal series is composed of a series of interpolated monthly fractal series: the sequential monthly fractal series since 2009 have been 5/12/10/7; 3/8/6; 8/17/17; 10/26/16; and 7/17/14 of 17 ending in May 2023. A super-bubble second fractal nonlinear devaluation is expected in the 13/31-33 year time frame, whose second fractal nonlinearity is described in the 2005 web site opening page,

Since the March 2020 low valuation, the weekly fractal series is 33/72/49 of 60-61 weeks. With the historical QT to contain consumer inflation, the ideal base of the second 72 week second fractal was shortened to 29 weeks, which became the determinant base time period for the third decay fractal. The third decay fractal for the March 2020 three phase series started on 14 March 2022 and is composed of a 10/23/18 of 18/12-13 week series ending in May 2023. A global hard landing crash economic recession will generate another monthly fractal series ending in 2025 to 2026.

Using the the Russell 2000, from 14 March 2022, the 60-61 week third fractal is composed of 42+/107/84 of 84-86/63 days :: x/2.5x/2x/1.5x.

Over the next 63 trading days and ending in May 2023 expected a nonlinear crash in the 2009 US asset Super Bubble created by the US central bank through extraordinary QE and ex nihilo money creation activity.

Equity, Gold, Bitcoin, Commodity Crash Alert: The Big Picture: Volcker’s 1981 Great Second Fractal  13/31-33 Year Asset Valuation Crash.

The US Asset-Debt system is undergoing an 1807 36/90/90/54 year  :: x/2.5x/2.5×1.5-6x Self-Assembly Great Fractal Cycle with asset valuation lows in 1842/43 and 1932, and a high in 2021.

The 90 year Third Fractal and the 54 year Fourth Fractal are composed of two interpolated equity fractal series  starting in 1932. The first series was a 10-11/21/21 year fractal ending with a yearly low in 1981/82. The second equity series, the Volcker US bond low series, began in 1981/82: and consists of 13/33/33/18-20 years, ending in 2074-76

The Volcker Second Fractal series started with a 3/7/5 year 13 year base  equity fractal from 1981/82 to 1993/94.   The second fractal to this first base was compose of two sub-series:  3/7/7 year series ending in 2009 and a 4/10/4 of 6-7 year series ending in 2025-2026.

Volcker’s 30 year bond prices decreased from their 15.1% high  in 1981 to 0.8 percent in 2020.  The lowering of bond rates correlated to both one: rapid money supply expansion with the accumulation of 93 trillion dollars of total US debt rising to an unprecedented 350% of GDP,  and two: with an asset  super bubble. Composite US equity valuations rose to the November 2021 90 year  Third Fractal high and housing valuation prices rose beyond the 2007 peak price to wage earning ratio. Financial  corporations, enabled by low mortgage  interest rates and advantaged availability to capital, drove valuations up, crowding out wage earners.

The Fed’s recent mini Volcker attack on consumer price inflation has taken  the fed funds rate in less than a year from 0.25  to 4.25-4.50, an unprecedented 1800% increase above the nadir rate. This percentage increase has never happened before. With the massive  US debt to GDP ratio and extreme housing valuations, this accelerated interest rate increase will result in a nonlinear 13/30-33 year 1981-82 second fractal  asset valuation price collapse.

At 93 trillion dollars of debt supported by only 26 trillion GDP,  mostly service job related, the US asset-debt system cannot tolerate 3.5-4.7 interest rates. During the US Fourth Fractal’s next 52-54 years, interest rates will not only return to zero levels, they will (must), like Germany, become negative for  to the asset debt system to survive. The disparity between the working class and those individuals and entities with disproportional access to capital and having financial assets grown disproportionally by negative rates, will become greater. The rich will enable a sympathetic populist to gain control of the political system.

The final 6-7 years of the 2009 4/10/6-7 year second subfractal series is likely composed of two subfractals : a March 2020 8/17/13 of 13 of 17 month subfractal series with a possible repeat of a similar monthly fractal sequence.

Over the next 11-12 trading days expect nonlinear declines in the Wilshire, Gold, and Bitcoin to conclude the Equity March 2020 8/17/13 of 17 month subfractal series.