Google’s (Alphabet’s) Interpolated Self Assembly and Self-Similar Fractal Interpolation into the 1790-2073 284 Year US Great Hegemonic (18)/36/90/89/54 Year :: 0.5x/x/2-2.5x/2-2.5x/1.5-1.6x Fractal Series

Slide02


Google’s (Alphabet’s) Interpolated  Self Assembly and Self-Similar Fractal Interpolation into the 1790-2073 284 Year US Great Hegemonic (18)/36/90/89/54 Year :: 0.5x/x/2.5x/2.5x/1.5x Fractal Series

Individual composite  asset valuation Fractal units are  defined by their easily identifiable composite nadir valuations. Nadir US Asset valuations in 1790, 1807, 1842-43, July 1932 and in July 2020 define the yearly  demarcations  of the  respective 18/36/90 and 89 year fractal units. Self similar quarterly, monthly, weekly, daily, hourly, and minutely  fractal series units  compose the sub-fractal series that compose these yearly US Hegemonic Great Fractals. The 18 year fractal from 1790 to 1807 was an ‘initiating’ fractal sequence which has a self similarity and correlation to Google’s (now alphabet’s)  emergence as an IPO entity on 19 August 2004. 

Composite and individual asset valuation growth is dependent on debt expansion creation; hence the appropriate descriptive terminology of the Asset-Debt macroeconomic system.

When the leveraging bad debt is no longer repayable (US corporate debt in 2020), the valuation growth undergoes devolution to a nadir point with counter growth activity in the deterministic march to a yearly low.

 The Asset-Debt Macroeconomic system follows simple mathematical fractal patterns whose exact counterbalancing growth and decay  fractal repetitions  elevate Macroeconomics  to a science.

Reducing these patterned  ‘laws’ to the two most inclusive and most basic self similar fractal series : 

 x/2-2.5x/2-2.5x/1.5-1.6x

*(the 3rd 2-2.5x sub-fractal in this 3 phase growth and one phase  decay fractal  series represents a peak valuation followed by 1.5-1.6x decay)

and

 x/2-2.5x/1.5-2.5x.  

*(the ideal third fractal length is the observed length of the second fractal divided by 2.5)

*(in the July 1932 89 year third fractal both peak growth valuation is closely followed by nonlinear decay occur near the terminal portion of the portion of 1.5-2.5x third sub fractal specifically the final months of the 89th year)

The final weekly fractal sequence ending the 1932 89 year US Great Third Fractal started in  December 2018.  The final weekly Fractal Crash Series: 11/28/28/18 weeks :: x/2-2.5x/2-2.5x/1.5-1.6x

The final 17-18 week fractal series is composed of a 3/7/6/1 of 5 weekly fractal series :: 2/2-2.5x/2-2.5x/1.5-1.6x series. 

The final devolution ending in July 2020  will take the composite global equity indices, commodities denominated in US dollars, including gold and cryptocurrencies  to a low 85 per cent below their 2020 peak valuations.

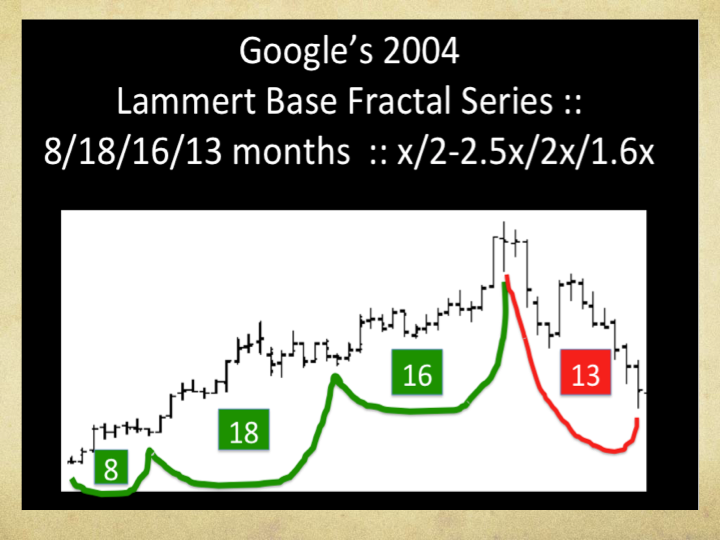
Google’s initial 8/18/16/13 month fractal starting on 19 August followed  the x/2-2.5x/2-2.5x/1.5-6x pattern.

The 19 August 2004  8 month base  fractal was composed of two 17 and 15 weekly sub-series or 31 weeks.

The first 17 week fractal sub-series was composed of 15/30/38 days ::  x/2-2.5x/1.5-2.5x. The 15 week second of the two  was composed of a  10/21/20/15 day ::  x/2-2.5x/2-2.5x/1.5-1.6x fractal series. The total 31 week base fractal  is  composed of 133 days. 

Self similar to the US 18 year 1790-1807 initiating fractal and its the US  Base fractal of 36 years from 1807-1842-3 would have been a 4 month initiating fractal (66 days) starting on 17-18 May 2004.  The ‘e’ funding based IPO was announced by its founders on 30  April 2004.

The monthly count for the first fractal  was (4)/8/18/16/13 = 55  with 2.5x or  138 months as the  expected maximum  second fractal monthly  length .

The 137 of 138 monthly second fractal  is composed of 4 sub-series: 43//32/32/33 of 34 month series  

a) 43 months  = 5/11/7  + 3/8/8 + 2/4/5 (base subfractal of second 138 month fractal)

b1) 32 months = 6/12/10/7

b2)32 months = 6/13/15 

b3) 34 months =5/12/12/ 7 of 8 (ending July 2020)

b1, b2, and b3 are the components of second sub fractal to the first 43 month sub fractal base. Notice that the 43/95 of 96 months second fractal is also of a configuration of a first and second  x/2-2.5x fractal subsidies.  Second fractal nonlinearity between 2-2.5 x characterizes second fractals. (See blog main page). The  55/138 month and 43/96 month nonlinearity  are synergistic and timed with end of the 89 year end of the 1932 US Third Fractal  in July 2020.

Google’s expected 138 month second fractal will end in July 2020.  Google’s   55 month 5 year ‘first’ fractal served as the initiating base fractal  for a 2.5x 13 year ‘second’  fractal which, like the US 1807 36 year first first fractal to its 1790 18 year initiating fractal series, is the ‘true’ first fractal for Google’s valuation growth ascent.

A 13/28/27 year :: x/2-2.5x/2-2.5x  series (or 54 more years) would coincide with the end of the US  Hegemonic  Asset-Debt Fractal Series of (18)36/90/89/54 years in 2073 :: x/2-2.5x/2-2.5x/1.5-1.6x.

From the SPX March 2020 lows the weekly 3/7/6/1 of 4-5 :: x/2-2.5x/2-2.5x/1.5-1.6x fractal series corresponds to a final SPX  daily fractal sequence  of (1)3/7/4(13)//(29)//(26)//(1of 19)days :: x/2-2.5x/2-2.5x/1.5-1.6x.

The terminal low for composite equities, the CRB index, gold in US dollars and bitcoin in US dollars  will occur on 18 July 2020  if trading halts don’t extend the final low valuations to a later July 2020 date.

This will end the 89 year US Hegemonic Asset-Debt Macroeconomic Third Fractal  beginning in July 1932 and commence the 54 year US 4th Fractal.

WHY A SPX OF LESS THAN 1000 BY JUNE 18 2020? BECAUSE AN ACCUMULATED PROPORTIONAL SUN TO EARTH MASS AMOUNT OF UNSUSTAINABLE BAD GLOBAL CORPORATE, PRIVATE, FEDERAL, STATE-EQUIVALENT AND MUNICIPALITY DEBT – WITH OPPOSITIONAL SOCIAL AND GOVERNMENTAL CONTRACT OBLIGATIONS – ARE NOW UNDERGOING A NONLINEAR PHASE TRANSITION OF REVALUATION COLLAPSE – AKIN TO AN AGED STAR WITHOUT SUFFICIENT NUCLEAR FUEL UNDERGOING BLACK HOLE COLLAPSE

From the December 2018 SPX weekly low:

11/26/26/16 of 18 week final fractal series :: x/2.5x/2.5x/1.6y.

Nonlinearity and rapid phase transitions are  characteristic of the observable universe: supernova and GRB events, black hole event horizons, tornados, earthquakes,  breaking dams, mudslides and  death.

Observable from the December 2018 low for the hegemonic US proxy SPX and concluding the US Hegemonic 89 year Third Fractal starting in 1932 and  which was composed of two subfractal series  of 51 and 39 years: 

 is a  11/26/26/16 of 18 week fractal :: x/2.5x/2.5x/1.6y.

Historical US Third Fractal 89 year nonlinearity is expected  over the next 7 equivalent trading days.

Trading halts are anticipated. Friday 5 June 2020 was an easily observable technical gapped blow-off. The final daily fractal growth has its third fractal length near a Fibonacci if the 11-12 days ideal base: 10-13/29/18 days .. The final third 18 day fractal  is composed of two fractal sequences : 2/5/4/3 and 2/4/4 days

Nonlinear gapped 5 June 2020 secondary global equity peak valuation occurred on the 16th day of the 18 day final fractal;  global asset equity and commodity valuation collapse  will follow with unrepayable bad debt revealing the quality of its bankruptcy  …

Why the  Equity and commodity great decline valuation ahead?

The US Debt clock estimates  the debt obligations and liabilities of the US.  The federal debt now stands at 130% of GDP.  The composite corporate, private, and governmental debt liabilities of the Euro and Asian countries are  similar. The debt obligations are both enormous and unrepayable. Only necessary negative interest rates or – Debt Jubilee for all parties – can sustain these debt loads.

A Great  Global Nonlinear fractal transition  is now transpiring; first the final nonlinear  gapped  composite equity valuation blow-off occurring on Friday 5 June 2020, followed by two days of up and  lateral price movement. This final growth valuation growth activity will be followed with a fractal decay of historical nonlinear valuation collapse of equities and commodities. (Within the second 29 day  and third 18 day fractals this is an interpolated fractal series of of 9/21/18 days :: x/2-2.5x/2x)

Individual asset valuations will be revalued in the remaining denominator of the repayable good debt and the collectively re-equilibrated totality of worth of the Global Asset Valuation Integral.

At the base of the economic pyramid are global service workers who obligate themselves with debt to purchase automobiles,  motor bikes, furniture, appliances, cell phones,  and other wage debt-attainable commodities.   Robotics in the next decade will replace millions of  global factory workers. 

While the virus provides an explanation for the global service worker debt-creation collapse, its appearance occurs near the 26 week of the final 11/26/26 week SPX valuation growth fractal series. This will be a source of speculation in the future after the mathematical simple fractal  quantitative reiterations  of saturation asset-debt macroeconomics prove it conclusively  to be a patterned science.

The daily fractal decay series to the March 2020 SPX low was  2/5/4 and 3/8/8 days or 25 days. The second decay fractal series is expected to be 62-63 day with this 25 day decay base.

The final gapped peak valuation  and nonlinear valuation collapse is expected in a single  29 May 2020 fractal transitional  daily growth and  decay series   of 3/8/6  or 3/7/7 days.  


The  Case for the  Science of Observational Quantitative Fractal Valuation Growth And Decay Asset-Debt  Saturation Macroeconomics:

From the December 2018 Composite Equity nadir valuation low: x/2-2.5x/2-2.5x/1.6y :: 11/26/26/16 of 18 weeks : on a daily basis nonlinearity can be observed between the 22nd and 23rd week of the second 26 week fractal. (see main page regarding second fractal nonlinearity)

This correlates to 3/7/7/4 of 5 months.  The CRB is following an interpolated final daily fractal series of 8/20(5)/(11)/ 20 of 27 days.

This web site makes  the observation  that the asset debt economic  system is mechanistic and quantitative in its nature following simple growth and decay fractal valuation patterns  so precise that ‘the mathematical laws’ and ‘self assembly’ of asset valuation  growth and decay are similar to physics and chemistry and biology.

 Asset Debt Saturation Macroeconomics likewise has the quality and property of a science.

The simple ever recurring and easily observed quantitative fractal ‘mathematical laws’ determined by the nadir asset valuation are:(y connotes final valuation low for the individual fractal series pattern)

x/2-2.5x/2-2.5y  

x/2-2.5x/2-2.5x/1.4-1.6y

and x/2-2.5x/1.5 to 2.5y 

(the second fractal length of 2-2.5x determines the ideal base first fractal length; the third fractal is a 1.5 multiple of this ideal base.

Qualitatively, the facilitated creation of excessive debt leads to overvaluation, overproduction, and over-ownership of assets. The system is self correcting with liquidation of bad debt and a lower re-equilibrium of asset valuations with a lower total denominator of composite system wealth near the nadir of bad debt liquidation and lower asset composite valuation. 

All individual asset valuations are denominated in first time derivative of the composite of all other valuations.

The fractal mathematical laws  of the composite asset valuations of the asset debt system are elegantly simple. 

While Central Banks’ interventions can cause observational rises of subfractal components, the fractal grouping patterns are still there.

In fact the observational patterns show the direct effect of central bank intervention. 

The US  Hegemonic Asset Debt Macroeconomic  grand Fractal series had an initiating fractal base of about 18 years near the initiation of its constitution in 1790.

The  first fractal started in 1807-8 and ended after the panic of 1837 in 1842-43 for a base fractal of 36 years. Its 90 year second fractal ended with nadir composite equity valuations in  1932.  Its 89 year third fractal is expected to end very shortly (now in 7 trading days  on Thursday 18 June  2020.  A fourth Great US Hegemonic   Fractal is expected to end in 2074. (1.5y) The US 54 year fourth fractal will be supported with necessary debt creation. 

A Look at the 1982 second subfractal series: 9/20/12 year :: x/2-2.5x/1.5y concluding US 1932 third fractal series:

The monthly fractal progression of US composite Equities from the low in 2003 was made of two fractal series: 6/13/15/10 months :: x/2-2.5x/2.5x/1.6y and a decay fractal of x/2-2.5x/1.5y : 9/20/12 months: The ideal base of a second 20 month fractal is 8 months with 1.5 times 8 months yielding a 12 month third fractal.

What was the composite equity and CRB valuation  fractal effect of the global Central Bank intervention  on the 2008-2009 collapse? The 2/5/5/3 month fractal series composing the 12 month  third decay fractal begins a valuation climb in March 2009 at the beginning of  its third 5 month fractal.

Note the  x/2-2.5x/1.5y fractal similarity of the 1982 9/20/12 year fractal series (completing the 89 year US Third Fractal) to the 9/20/12 month fractal series completing the second 20 year subfractal series which started in 1990. 

Sans global  central Bank coordinated intervention, the expected unassisted starting point for the observed March 2009  composite  nadir was at the end of the 2/5/5/3 month natural self assembly fractal series or September 2009

From the expected September 2009 low (unassisted by Central Bank assumption of toxic debt and collaborative interCentral bank money printing and  interbank borrowing),  the two monthly subfractal series –  2/5/4/3 and 3/7/8 months ::  x/2.5x/2x/1.5y and x/2-2.5x/2-2.5y, respectively – make up a 26 month base first fractal sequence of the final 12 year third subfractal.

The final 12 year third fractal sequence of the 1982  9/20/12 year :: x/2-2.5x/1.5y decay fractal series (this second fractal subseries follow a 1932 10-11/21/21-22 53 year  first fractal subseries ) is composed of 26/53/52 of 53 months. (x/2-2.5x/2-2.5y)

The second 53 month subfractal of the 26/53/52 of 53 series is composed of two fractal subseries 3/7/6 months and 8/17/17 months (x/2-2.5x/2.5x both subseries)

The third 52 of 53 month series is composed of 10/26/18 of 19 months.  The integrative final series is 10/25/20 months)

The first 10 month fractal is composed of a 2/4/4/3 month series; the second 26 month fractal is composed of a 5/11/11 month series, and the third 19 month series a 3/7/7/4 of 5 months series.

The patterned asset composite valuation activity of the  Asset Debt macroeconomic system is directly observational and is indisputable. What causes the ideal self assembly of mathematically precise  fractal asset valuation  growth and decay patterns?

What causes the  mathematical laws and derived numerical constants of physics and the naturally occurring  self assembly of subatomic particles, atomic particles, molecules, plant and animal embryological development, stars, solar systems, galaxies and the universe? 

The observational  self assembly highly patterned fractals defining the counterbalancing growth and decay of valuations of composite assets composing the asset debt macroeconomic system  confers upon that macroeconomic  system the Properties of a Science.

Why A SPX of Less Than 1000 by June 18 2020? An Accumulated Amount of Unsustainable Underlying Bad Global Corporate, Private, Federal, And State Debt And Social Contract Obligations Is Now Undergoing a Nonlinear Phase Transition of Revaluation Collapse – Akin to An Aged Star Without Sufficient Nuclear Fuel Undergoing Black Hole Collapse

From the December 2018 SPX weekly low:

11/26/26/16 of 18 week final fractal series :: x/2.5x/2.5x/1.6y.

Nonlinearity and rapid phase transitions are  characteristic of the observable universe: supernova and GRB events, black hole event horizons, tornados, earthquakes,  breaking dams, mudslides and  death.

Observable from the December 2018 low for the hegemonic US proxy SPX and concluding the US Hegemonic 89 year Third Fractal starting in 1932 and  which was composed of two subfractal series  of 51 and 39 years 

 is a  11/26/26/16 of 18 week fractal :: x/2.5x/2.5x/1.6y.

Historical US Third Fractal 89 year nonlinearity is expected  over the next 9 equivalent trading days.

Trading halts are anticipated. Friday 5 June 2020 was an easily observable technical gapped blow-off.

Nonlinear gapped 5 June 2020 secondary global equity peak valuation and global asset valuation collapse …

Why the  Equity and commodity great decline valuation ahead?

The US Debt clock estimates  the debt obligations and liabilities of the US.  The composite corporate, private, and governmental debt liabilities of the

Euro and Asian countries are  similar. The debt obligations are both enormous and unrepayable. Only negative interest rates can sustain these debt loads.

A Great  Global Nonlinear fractal transition  is now transpiring; first the final nonlinear  gapped  valuation blow-off occurring on Friday 5 June 2020, followed by a historical nonlinear valuation collapse of equities and commodities.

individual asset valuations will be revalued in the remaining denominator of the repayable good debt and the collectively re-equilibrated totality of worth of the Global Asset Valuation Integral.

At the base of the economic pyramid are global service workers who obligate themselves with debt to purchase automobiles,  motor bikes, furniture, appliances, cell phones,  and

other debt-reachable attainable commodities.   Robotics in the next decade will replace millions of  global factory workers. 

While the virus provides an explanation for the global service worker debt-creation collapse, its appearance occurs near the 26 week of the final 11/26/26 week SPX valuation growth fractal series.

The daily fractal decay series to the March 2020 SPX low was  2/5/4 and 3/8/8 days or 25 days. The second decay fractal series is expected to be 62-63 day with this 25 day decay base.

The final gapped peak valuation  and nonlinear valuation collapse is expected in a single  fractal series 3/7/7 days :: 3/4 (gapped peak valuation) of 7/7 (7.5 hour equivalent)  trading days:  


The  Case for the  Science of Observational Quantitative Fractal Valuation Growth And Decay Asset-Debt  Saturation Macroeconomics

From the December 2018 Composite Equity nadir valuation low: x/2-2.5x/2-2.5x/1.6y :: 11/26/26/16 of 18 weeks : on a daily basis nonlinearity can be observed between the 22nd and 23rd week of the second 26 week fractal. (see main page regarding second fractal nonlinearity)

This correlates to 3/7/7/4 of 5 months.  On a daily basis for the CRB, the fractal progression is 5/11/10/4 of 7 days.  An 1987 like collapse is expected over the next three trading days.

This web site makes  the observation  that the asset debt economic  system is mechanistic and quantitative in its nature following simple growth and decay fractal valuation patterns  so precise that ‘the mathematical laws’ and ‘self assembly’ of asset valuation  growth and decay are similar to physics and chemistry and biology.

 Asset Debt Saturation Macroeconomics likewise has the quality and property of a science.

The simple ever recurring and easily observed quantitative fractal ‘mathematical laws’ determined by the nadir asset valuation are:(y connotes final valuation low for the individual fractal series pattern)

x/2-2.5x/2-2.5y  

x/2-2.5x/2-2.5x/1.4-1.6y

and x/2-2.5x/1.5 to 2.5y 

(the second fractal length of 2-2.5x determines the ideal base first fractal length; the third fractal is a 1.5 multiple of this ideal base.

Qualitatively, the facilitated creation of excessive debt leads to overvaluation, overproduction, and over-ownership of assets. The system is self correcting with liquidation of bad debt and a lower re-equilibrium of asset valuations with a lower total denominator of composite system wealth near the nadir of bad debt liquidation and lower asset composite valuation. 

All individual asset valuations are denominated in first time derivative of the composite of all other valuations.

The fractal mathematical laws  of the composite asset valuations of the asset debt system are elegantly simple. 

While Central Banks’ interventions can cause observational rises of subfractal components, the fractal grouping patterns are still there.

In fact the observational patterns show the direct effect of central bank intervention. 

The US  Hegemonic Asset Debt Macroeconomic  grand Fractal series had an initiating fractal base of about 18 years near the initiation of its constitution in 1790.

The  first fractal started in 1807-8 and ended after the panic of 1837 in 1842-43 for a base fractal of 36 years. Its 90 year second fractal ended with nadir composite equity valuations in  1932.  Its 89 year third fractal is expected to end very shortly (three trading days) in 2020.  A fourth fractal is expected to end in 2074. (1.5y) The US 54 year fourth fractal will be supported with necessary debt creation. 

A Look at the 1982 second subfractal series: 9/20/12 year :: x/2-2.5x/1.5y concluding US 1932 third fractal series:

The monthly fractal progression of US composite Equities from the low in 2003 was made of two fractal series: 6/13/15/10 months :: x/2-2.5x/2.5x/1.6y and a decay fractal of x/2-2.5x/1.5y : 9/20/12 months: The ideal base of a second 20 month fractal is 8 months with 1.5 times 8 months yielding a 12 month third fractal.

What was the composite equity and CRB valuation  fractal effect of the global Central Bank intervention  on the 2008-2009 collapse? The 2/5/5/3 month fractal series composing the 12 month  third decay fractal begins a valuation climb in March 2009 at the beginning of  its third 5 month fractal.

Note the  x/2-2.5x/1.5y fractal similarity of the 1982 9/20/12 year fractal series (completing the 89 year US Third Fractal) to the 9/20/12 month fractal series completing the second 20 year subfractal series which started in 1990. 

Sans global  central Bank coordinated intervention, the expected unassisted starting point for the observed March 2009  composite  nadir was at the end of the 2/5/5/3 month natural self assembly fractal series or September 2009

From the expected September 2009 low (unassisted by Central Bank assumption of toxic debt and collaborative interCentral bank money printing and  interbank borrowing),  the two monthly subfractal series –  2/5/4/3 and 3/7/8 months ::  x/2.5x/2x/1.5y and x/2-2.5x/2-2.5y, respectively – make up a 26 month base first fractal sequence of the final 12 year third subfractal.

The final 12 year third fractal sequence of the 1982  9/20/12 year :: x/2-2.5x/1.5y decay fractal series (this second fractal subseries follow a 1932 10-11/21/21-22 53 year  first fractal subseries ) is composed of 26/53/52 of 53 months. (x/2-2.5x/2-2.5y)

The second 53 month subfractal of the 26/53/52 of 53 series is composed of two fractal subseries 3/7/6 months and 8/17/17 months (x/2-2.5x/2.5x both subseries)

The third 52 of 53 month series is composed of 10/26/18 of 19 months.  The integrative final series is 10/25/20 months)

The first 10 month fractal is composed of a 2/4/4/3 month series; the second 26 month fractal is composed of a 5/11/11 month series, and the third 19 month series a 3/7/7/4 of 5 months series.

The patterned asset composite valuation activity of the  Asset Debt macroeconomic system is directly observational and is indisputable. What causes the ideal self assembly of mathematically precise  fractal asset valuation  growth and decay patterns?

What causes the  mathematical laws and derived numerical constants of physics and the naturally occurring  self assembly of subatomic particles, atomic particles, molecules, plant and animal embryological development, stars, solar systems, galaxies and the universe? 

The observational  self assembly highly patterned fractals defining the counterbalancing growth and decay of valuations of composite assets composing the asset debt macroeconomic system  confers upon that macroeconomic  system the properties of a science.