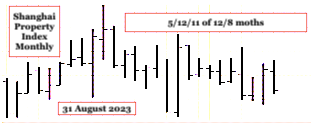
The March 2020 Wilshire 8/18/17/8 of 10 Month :: x/2-2.5x/2-2.5x’/1.5x’ 4 phase Fractal Series

31 August 2023

The Global Asset Debt Macroeconomic system is interlinked. Property overvaluation in China relative to wages and downpayment requirements (80 percent on the first residence) and grossly underwater Chinese large construction companies such as Evergrande and Country Garden who are unable to repay the interest on their debt and unable to construct promised residencies that have been financed, place residency valuations on an overhanging cliff that is beginning a nonlinear collapse.

Compare the expected termination of the monthly 4 phase fractal pattern(s) of the Wilshire (or CAC, DAX, or Nikkei) composite(s) to that of the expected termination of the monthly 4 phase Shanghai property index, the latter which is identical to that of the Bank of Shanghai.

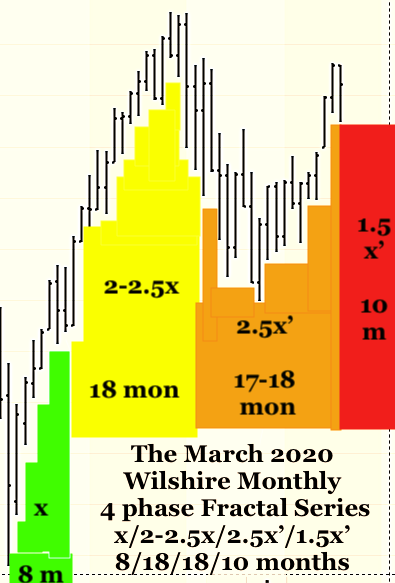
The March 2020 Wilshire is following an 8/18/17/2 of 10 month 4 phase fractal series which is expected to end in 8 months.

The July 2021 monthly 4 phase fractal series for the Shanghai Property Index (the same as the July 2021 Bank of Shanghai) is 5/12/11 of 12/8 months ending in 8 months.

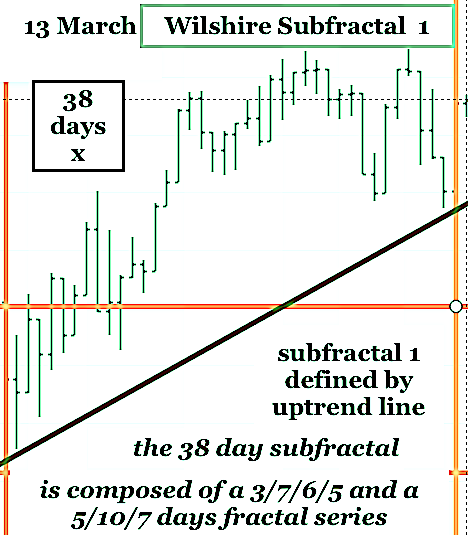
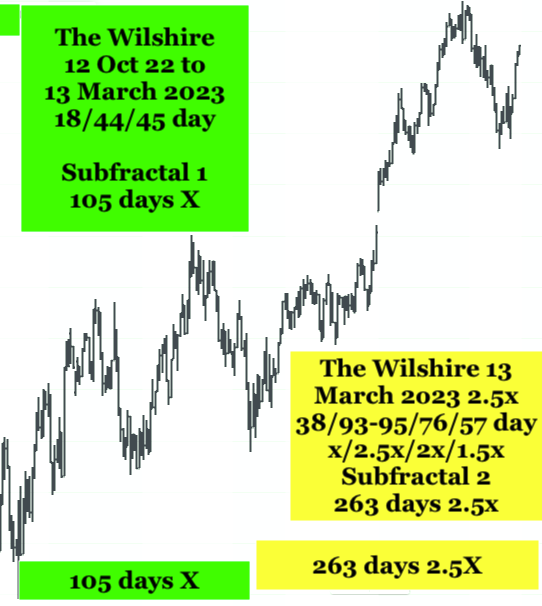
From the Wilshire’s low on 12 October 2022 a 18/44/45 day three phase fractal series of 105 days in length and ending 13 March 2023 was followed by a 13 March 2023 four phase fractal series of 38/83 of 93-95/76/57 day fractal series which would complete the remainder of the expected 8 months.

Subfractal 2 (second fractal, old term)) nonlinearity for the 38/83 of 93-95 day subfractal 1 and subfractal 2 series is expected over the next 10-12 trading days.

The Bank of Shanghai is following a three phase daily unit series starting 27 June 2023: 10/25/13 of 25 days which is expected to also end in 12 trading days.

Expect unexpected second fractal nonlinearity.


A Primer on Fractal series

The beginning and ending boundaries of time based fractal series are defined by uptrend and downtrend lines with positive and negative slopes, respectively, that are formed by connecting the two low points at the beginning and the end of the fractal series.

In a bar chart, unit bars can be minutes, hours, days, weeks, months, and years. It is the hypothesis of this website that the asset debt macroeconomic system is deterministic and the growth and decay of the ongoing unit time valuations of its asset classes automatically self assembly in the most efficient manner with self similar fractal patterns of the unit time based bars. 

There are only two elegantly simple laws of self-assembly time-based fractal asset-debt valuation growth and decay macroeconomics:

While money and credit growth (and contraction)by central banks and government spending is periodically irregular, equity and commodity composite valuations grow and decay by only two distinct time-based fractal patterns(mathematical laws):

a three phase pattern: composed of three subfractals:1/2/ and 3 :: x/2-2.5x/1.5-2.5x – where x is the base first fractal time length in days, weeks, months, and years.

and a four phase pattern: composed of 4 subfractals: 1/2/3/ and 4 :: x/2-2.5x/2-2.5x/1.5-1.6x, where x is the base first fractal time length in days, weeks, months, and years. In a four phase fractal series the sum of the length of subfractal 1 and 2 may be exceeded by the sum of the length of subfractal 3 and 4 by 0.1x.

The time length of subfractal 2 (2-2.5x) of the 3 and 4 phase fractal series often determines the ideal time length of subfractal 1 : (x’) upon which the lengths of sub-fractals 3 and 4 are based: e.g., the 4 phase fractal pattern’s time lengths become x/(2-2.5x divided by 2.5 = x’)/2-2.5x’/1.5-1.6x’.

The US Hegemony macroeconomic system is following an 1807 4 phase fractal series of 36/90/90/54 years with a 90 year Subfractal 3 high on 8 November 2021 for for the Wilshire and Bitcoin/USD. Smaller unit time based fractal series make up the 36,90,90 and upcoming 54 years.

The Wilshire’s 13 March 2023 38 Day (x) Subfractal 1

A Primer on Fractal series

The beginning and ending boundaries of time based fractal series are defined by uptrend and downtrend lines with positive and negative slopes, respectively, that are formed by connecting the two low points at the beginning and the end of the fractal series.

In a bar chart, unit bars can be minutes, hours, days, weeks, months, and years. It is the hypothesis of this website that the asset debt macroeconomic system is deterministic and the growth and decay of the ongoing unit time valuations of its asset classes automatically self assembly in the most efficient manner with self similar fractal patterns of the unit time based bars.

There are only two elegantly simple laws of self-assembly time-based fractal asset-debt valuation growth and decay macroeconomics:

While money and credit growth (and contraction)by central banks and government spending is periodically irregular, equity and commodity composite valuations grow and decay by only two distinct time-based fractal patterns(mathematical laws):

a three phase pattern: composed of three subfractals:1/2/ and 3 :: x/2-2.5x/1.5-2.5x – where x is the base first fractal time length in days, weeks, months, and years.

and a four phase pattern: composed of 4 subfractals: 1/2/3/ and 4 :: x/2-2.5x/2-2.5x/1.5-1.6x, where x is the base first fractal time length in days, weeks, months, and years. In a four phase fractal series the sum of the length of subfractal 1 and 2 may be exceeded by the sum of the length of subfractal 3 and 4 by 0.1x.

The time length of subfractal 2 (2-2.5x) of the 3 and 4 phase fractal series often determines the ideal time length of subfractal 1 : (x’) upon which the lengths of sub-fractals 3 and 4 are based: e.g., the 4 phase fractal pattern’s time lengths become x/(2-2.5x divided by 2.5 = x’)/2-2.5x’/1.5-1.6x’.

The US Hegemony macroeconomic system is following an 1807 4 phase fractal series of 36/90/90/54 years with a 90 year Subfractal 3 high on 8 November 2021 for for the Wilshire and Bitcoin/USD. Smaller unit time based fractal series make up the 36,90,90 and upcoming 54 years.

Previously, this post had defined a 13 March 18/45/36 day growth fractal series with an expected Subfractal 4 decline of 27 days. This model violated the uptrend line definition defining fractal units.

The current model is based on a 13 March 4 phase 38/93-95/76-95/54-58 day fractal series.

22 August 2023: Completed: day 3 of the 13 day Subfractal Three: the 27 July 2023 Wilshire 5/13/13 Day 3 phase decay series Analogous to the Aug to November 1929 11/26/28 day 3 phase decay series: Asset-Debt Saturation Macroeconomics

There are only two elegantly simple laws of time-based  fractal asset-debt macroeconomics: 

While money and credit growth (and contraction)by central banks and government spending is periodically irregular, equity and commodity composite valuations grow and decay by only two distinct  time-based fractal patterns(mathematical laws): a three phase pattern: composed of three subfractals:1/2/ and 3  ::  x/2-2.5x/1.5-2.5x – where x is the base first fractal time length in days, weeks, months, and years.

and a four phase pattern: composed of 4 subfractals: 1/2/3/ and 4  :: x/2-2.5x/2-2.5x/1.5-1.6x, where x is the base first fractal time length in days, weeks, months, and years.   

The time length of subfractal 2 (2-2.5x) of the 3 and 4 phase fractal series often determines the ideal time length of subfractal 1 : (x’) upon which the lengths of sub-fractals 3 and 4 are based: e.g., the 4 phase  fractal pattern’s time lengths become x/(2-2.5x divided by 2.5 = x’)/2-2.5x’/1.5-1.6x’.

Using the Wilshire 5000, 31 July 2020, the Wilshire’s secondary high to its 8 November 2021 high was day 36 of subfractal three of a 18/44/36 day blow-off growth fractal series starting 13 March 2023.

For an ideal 4 phase fractal series of x/2.5x/2x/1.5x, the length
of subfractal four would equal 27 days, 1.5 times subfractal one, 18 days.

Decay starts in finale of growth valuation saturation.
A decay fractal series starting 27 July 2023 , which includes the peak on day 36, 31 July 2023 of 5/13/13 days would complete a three phase fractal and complete a subfractal four 27 day peak to nadir valuation process.

Subfractal two of this decay series lasted 13 days and is composed of a 3/6/6 day fractal.

Subfractal three of the 5/13/13 day series started on 18 August and completed day 3 of 13 days. Day 3 may have completed subfractal three’s maximal saturation growth. Using 30 minute fractals, two fractal series are observed: an 18 August 4 phase fractal series of 3/6/7/5 units followed by a 5/11/7 of 8 unit x/2-2.5 / 1.5-1.6x (final peak growth.) Like subfractal two, a 3/6/6 day three phase decay series for subfractal three seems likely.

Notice the tangent slope lines touching the lowest valuations of day 1 and day 5 of the 5 day subfractal one vice day 1 and day 13 of the 13 day subfractal two. The rate of deterioration is increasing.

If this model is correct, the slope of the 13 day subfractal 3 will be significantly and nonlinearly down.

The 27 July 2023 three phase 5/13/13 day decay fractal series is proportionally similar to the August-November 1929 11/26/28 day :: 3/7/7 week three phase incipient decay fractal series.