Monthly Archives: April 2013
24 April 2013: Little Speculator Population Exhaustion in Japan’s Nikkei; Incipient Crash in the West
The world is at a precipice.
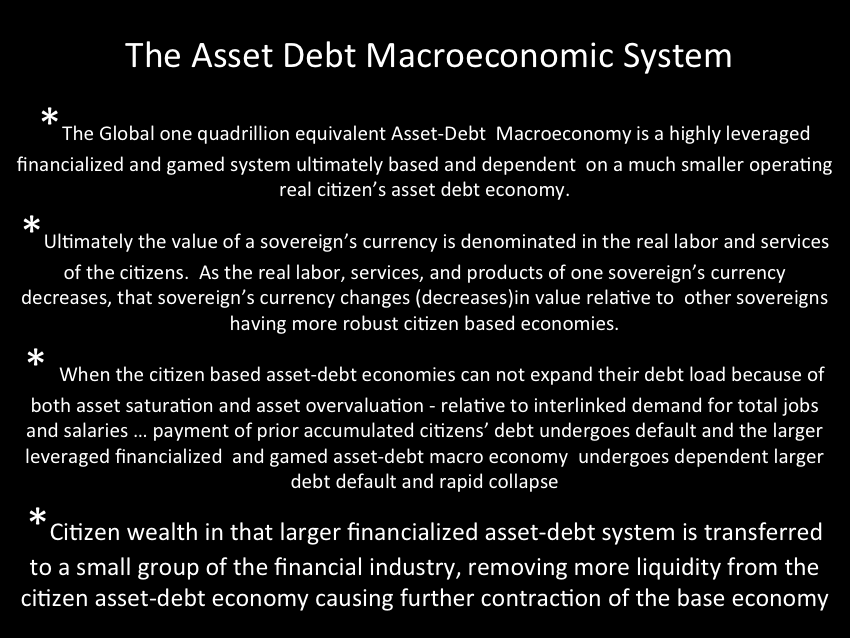
The exact value of self assembly quantum fractal asset-debt macroeconomics is this: its ability to determine the macroeconomy’s speculative asset saturation precipice with great accuracy: determining the timing of the complete exhaustion of the small speculator population in the secondary dominant speculative economy and the subsequent crash devaluation of both the speculative asset markets and of the real citizen economy.
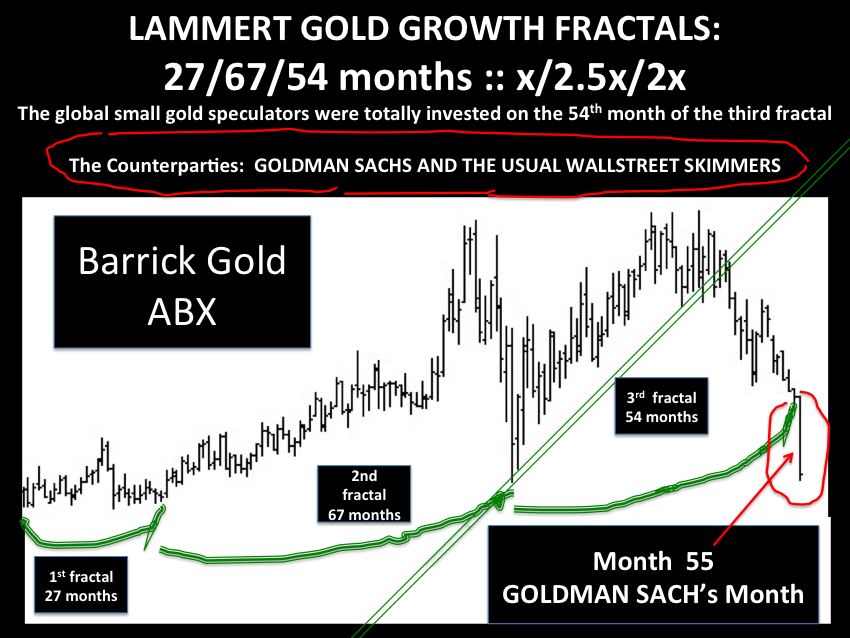
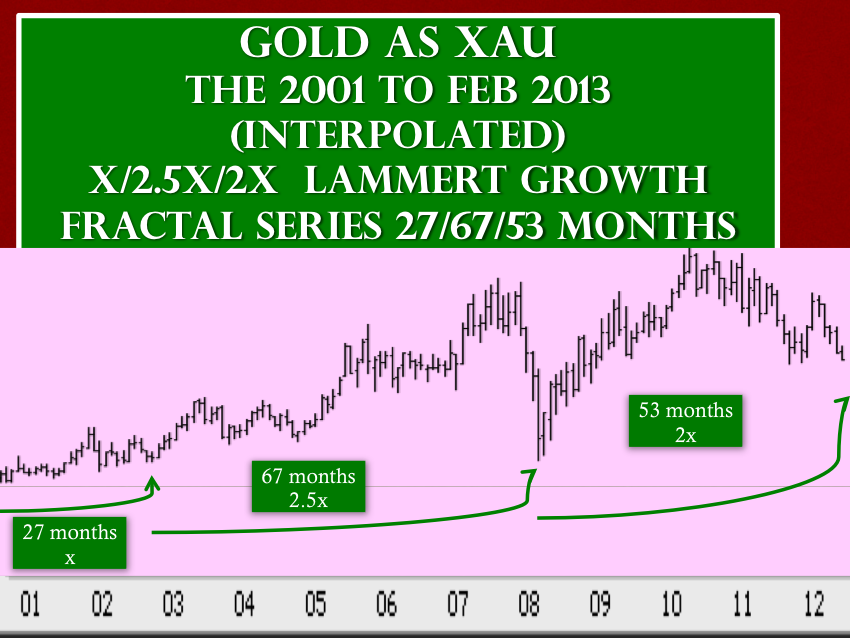
It has done this with the elegant gold market. The crash came on the 55 month of a 27/67/54 month Lammert growth fractal with complete depletion of the small speculator population’s ability to buy further into the market.
Speculative crashes deplete wealth from the citizen base who use that wealth for collateral credit and exchangeable direct money equivalents to be used in the real economy. This citizen wealth is sequestered by the financial industry few who have little desire to purchase the quantities of real economy assets that wealth distributed among the citizen mass has and will purchase. This is exactly the cause of deflation and depression in the real economy as a causal aftermath of a speculative asset bubble collapse with widespread small speculator losses.
With the speculative asset bubble collapse the real citizen economy is burdened yet more with existing citizen debt which become relatively heavier and with citizen-liable over-valued assets -which like gold – contract further in value as demand in the real economy contracts and, with that demand contraction, occurs falling correlative wages.
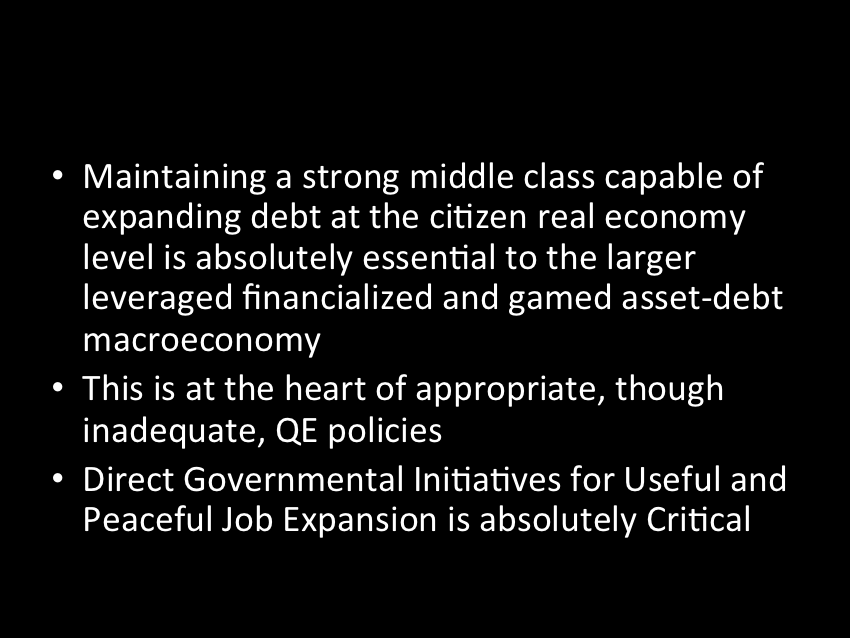
Since the 1982,the financial industry speculative economy has become the dominant force in the asset debt macroeconomy, knocking off Glass-Steagall and allowing 30:1 leverage during its politically-infiltrating, rapidly-metastatic evolution.
Since 2009 the speculative financial industry economy has attracted more and more money from the those citizens with a job and with some savings which because of the lessening demand in the real citizen economy produced negligible interest returns.
In January 2013, US savers gave up in mass and joined the small speculators dumping 77 billion dollars of their savings into equities. The previous US record at 24 billion was in February 2000 – before the March 2000 equity peak valuation.
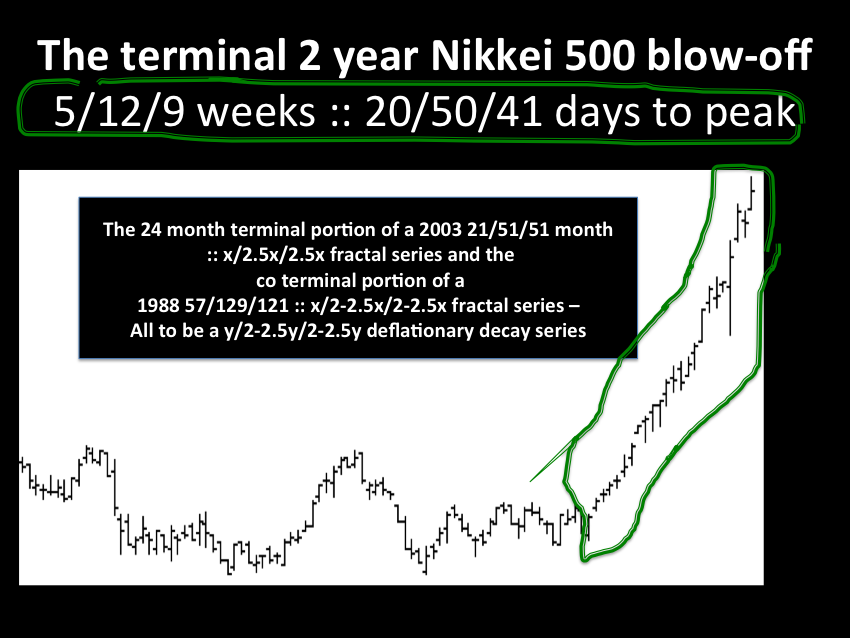
24 April 2013 Japan’s highly debt leveraged Nikkei:
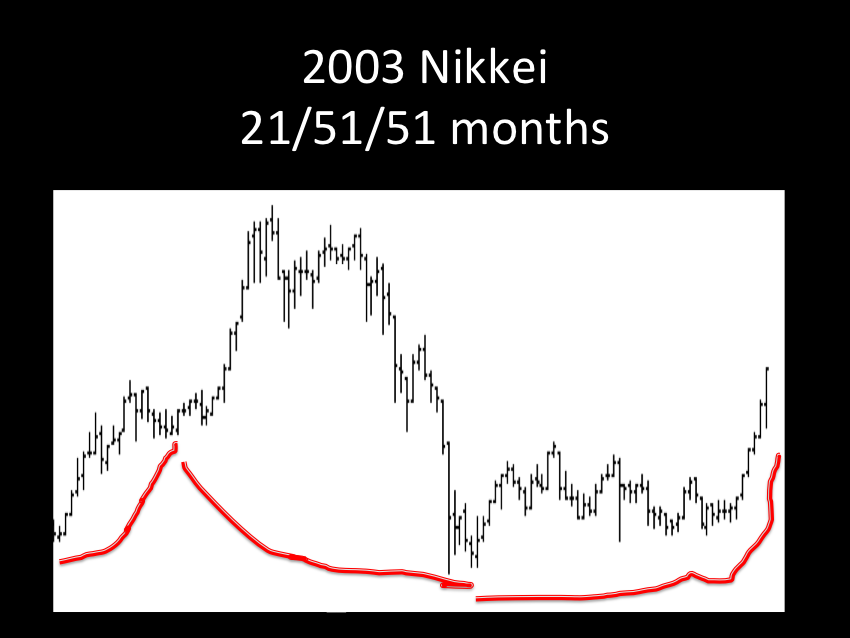
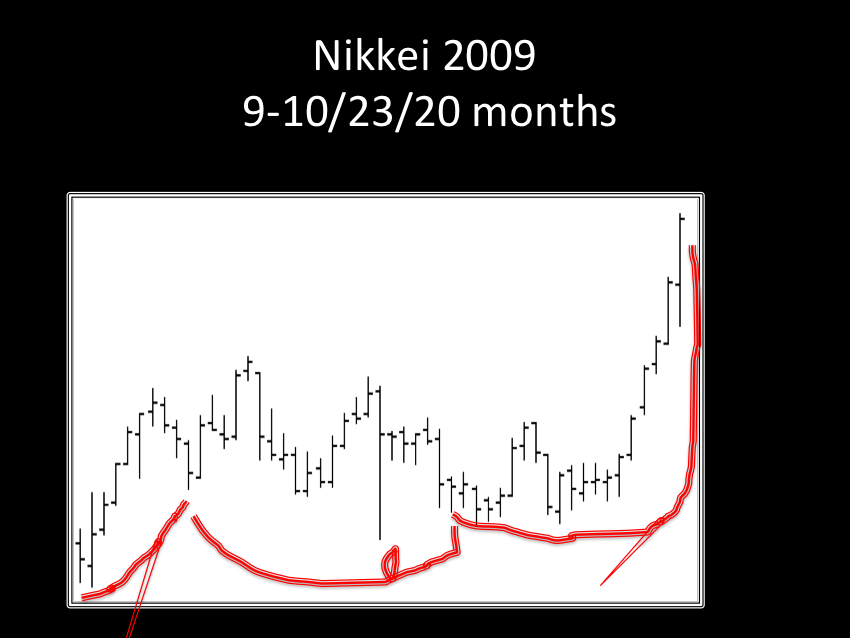
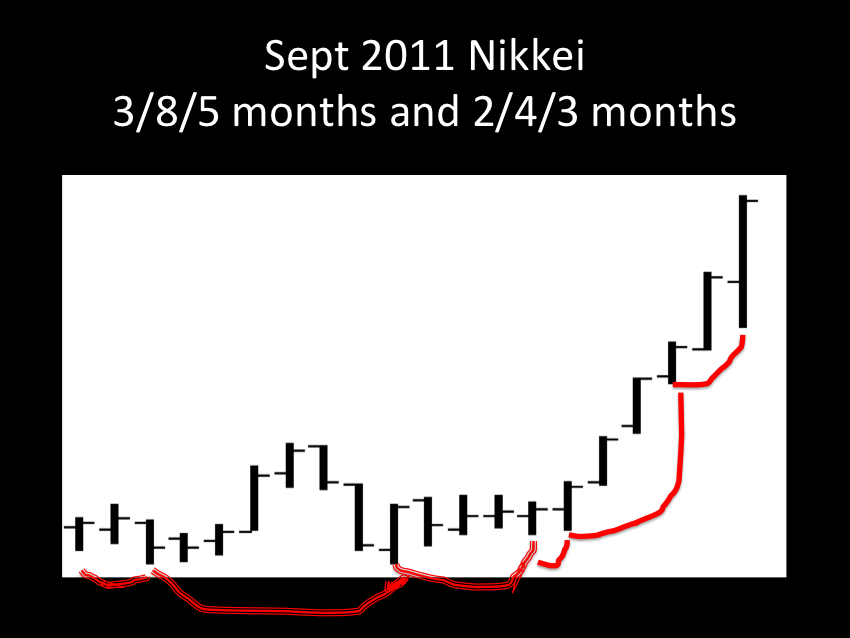
1988 57/129/122 months; 2003 21/51-52/51-52 months; 2009 9-10/23/20 months; Sept 2011 3/8/5 and 2/4/3 months and …
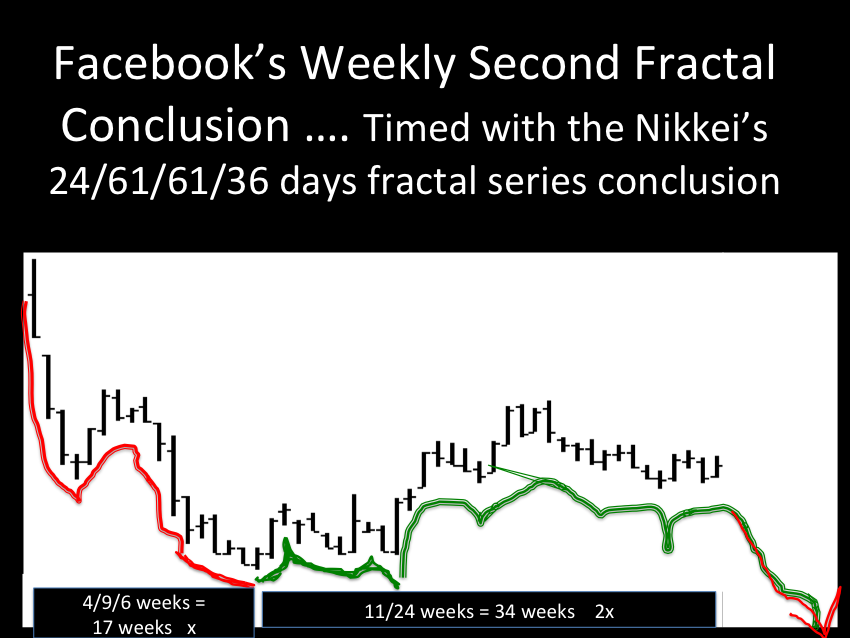
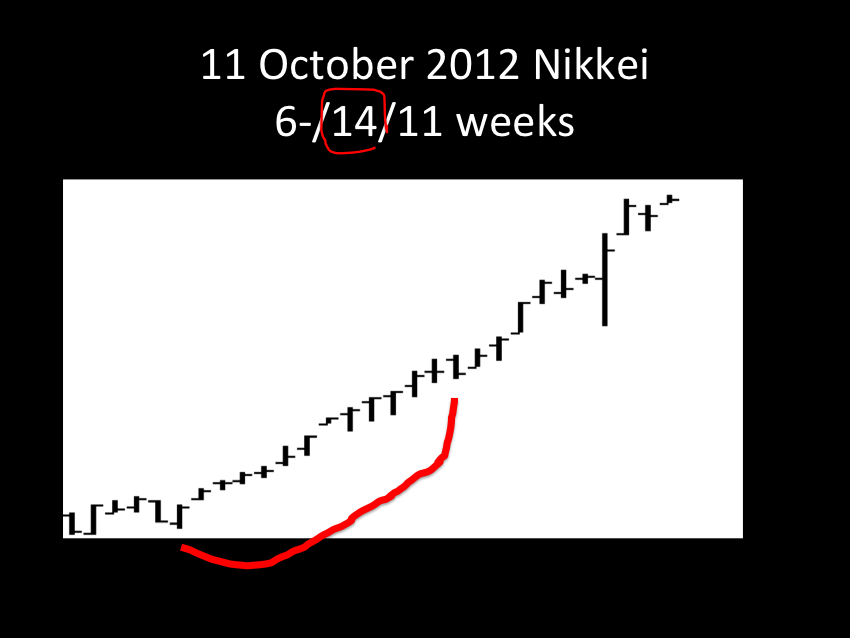
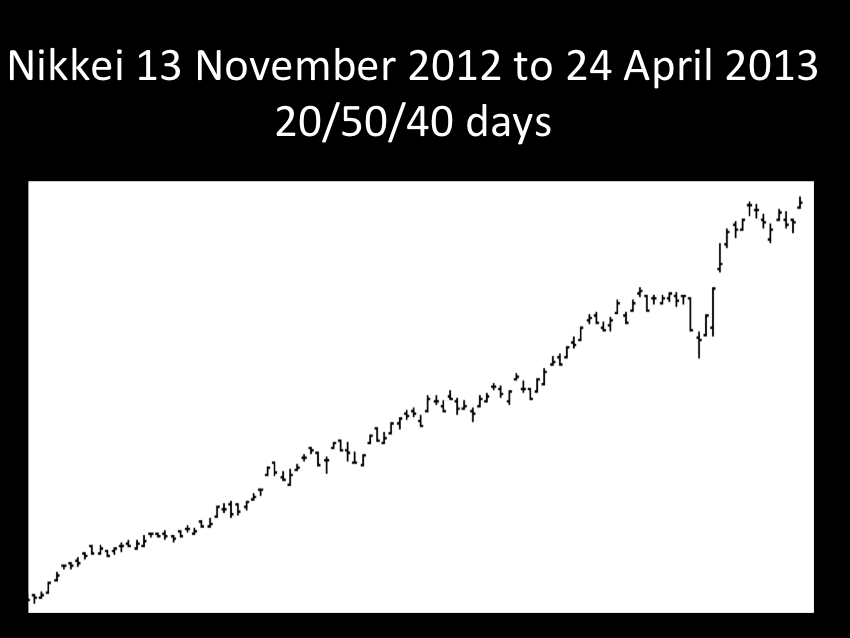
11 October 2012 24/61/48 days and 13 November 2012 20/50/40 days … both ending with small speculation population exhaustion and depletion on 24 April 2013.


23-24 April 2013: ASSET- DEBT SATURATION MACROECONOMICS: GLOBAL SMALL SPECULATOR EQUITY POPULATION EXHAUSTION — GOLD FRACTALS AND Global Gold Small Speculator Population Depletion as the Preceding CANARY in the GLOBAL EQUITY COAL MINE
From the 17 February 2013 posting ….
After the 54th month of growth of the third fractal, all global small speculators were fully invested in gold, the small speculator buying population was depleted.
Who were the counterparties who have an understanding of the asset-debt system? The money-changers of Wall Street…
Does the timing of the global depletion of small buying speculators in the global gold market have a correlation to the timing of the global depletion of global small speculators in global equity markets?
Who will be the gaining counterparties of the losing global small speculators in the global equity markets?
From the main page…..
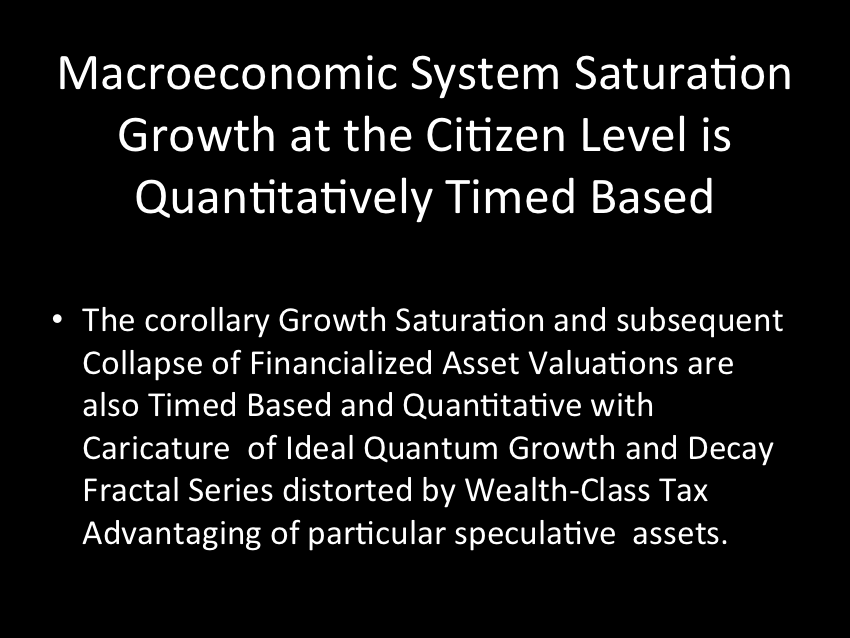
The ideal (Lammert) growth fractal time sequence is X, 2.5X, 2X and 1.5-1.6X. The first two cycles include a saturation transitional point and decay process in the terminal portion of the cycles. A sudden nonlinear drop in the last 0.5x time period of the 2.5X is the hallmark of a second cycle and characterizes this most recognizable cycle. After the nonlinear gap drop, the third cycle begins. This means that the second cycle can last anywhere in length from 2x to 2.5x. The third cycle 2X is primarily a growth cycle with a lower saturation point and decay process followed by a higher saturation point. The last 1.5-1.6X cycle is primarily a decay cycle interrupted with a mid area growth period. Near ideal fractal cycles can be seen in the trading valuations of many commodities and individual stocks. Most of the cycles are caricatures of the ideal and conform to Gompertz mathematical type saturation and decay curves.
G. Lammert
This page was last updated on 15-May-2005 01:21:59 PM .
http://www.youtube.com/watch?feature=player_detailpage&v=7VOWnnEphjI#t=737s
24 April 2013 is the 48th day of a 24/61/48 day Nikkei fractal series and the 40th day of a 20/50/40 Nikkei fractal series … How exquisitely precise is the timing of the global exhaustion of the global pool of small speculators in the global equity market?
(Imagine if all equity trading was halted for five years on 24 April 2013 and all trading leveraged positions were cancelled as part of an Equity Price Stabilization Act…. Imagine if the government then purchased equity frozen in value on 24 April 2013 and owned by individuals for up to 300,000 dollars in value with payment in T-bills funded(printed, accounted for) by the Federal Reserve. That stabilization act would protect the ongoing purchasing power of the citizen economy (consider 1929 to 1940) and really do a job on the counter parties of Wall Street.)
