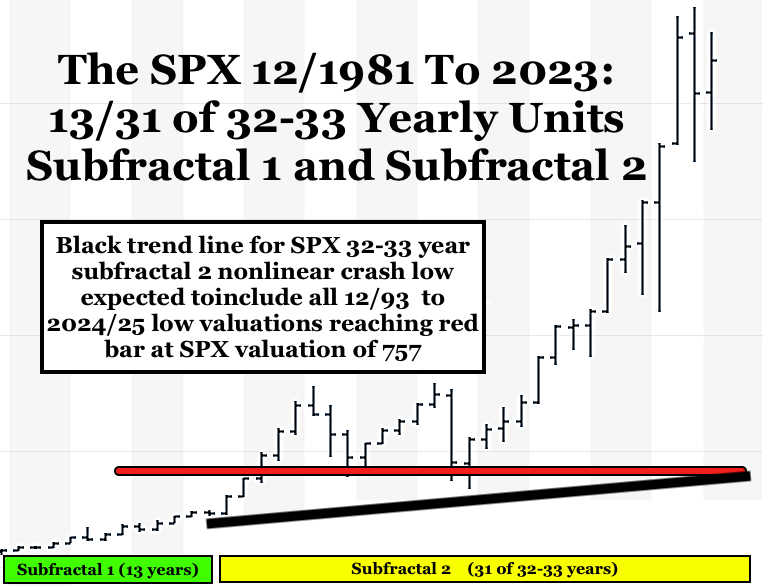
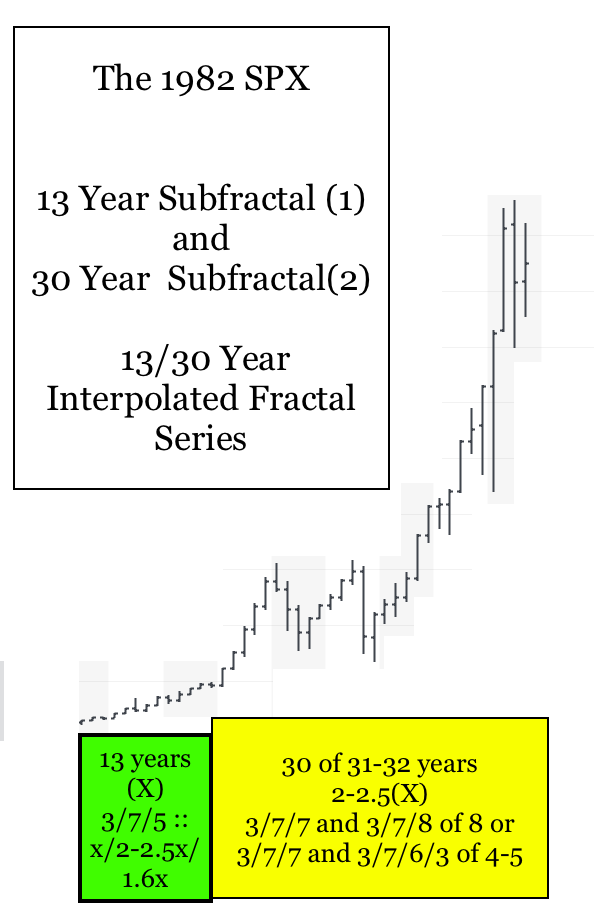
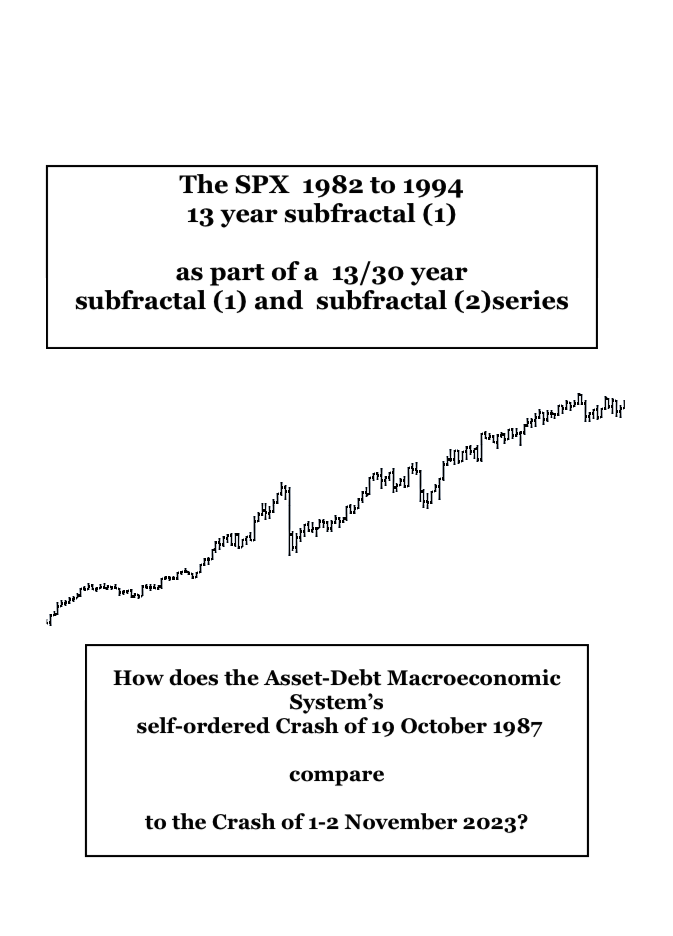
Within the Great 1807 US hegemonic 36/90/90/54 year :: x/2.5x/2.5x/1.5x Fractal series – with a 36 year low valuation in 1842-43, a 90 year low valuation on 8 July 1932, a 90 year peak valuation on 8 November 2021, and an expected low in 2074, a several decade interpolated fractal series of x/2-2.5x started on 11-12 August 1982 of 13/30 years with a 13 year subfractal (1) low valuation ending in 1994. This is depicted below.
Subfractal (2) series end in nonlinear devaluation. This can occur over months as occurred for the 90 year subfractal (2) ending in 1932 or more suddenly as in October 1987 and on 6 May 2010.
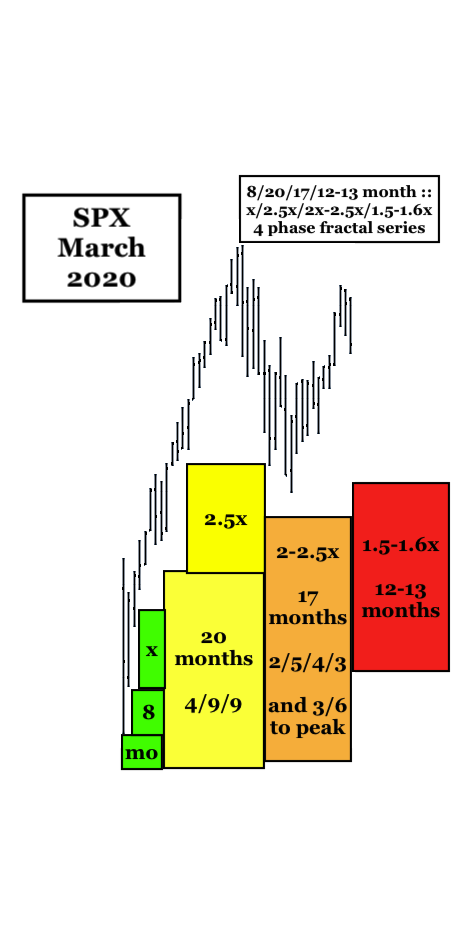
Interpolated within the 1994 30 year subfractal (2) is a terminal March 2020 4 phase fractal series whose x/2.5x/2-2.5x lower high growth is completed. See below:
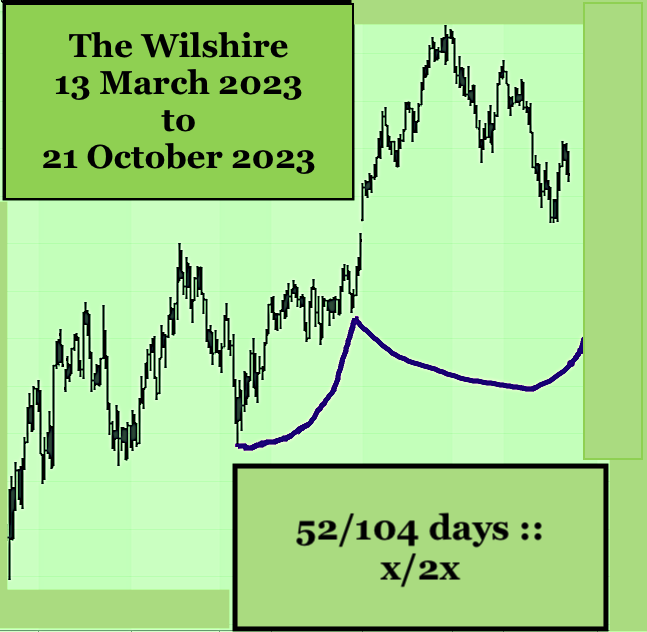
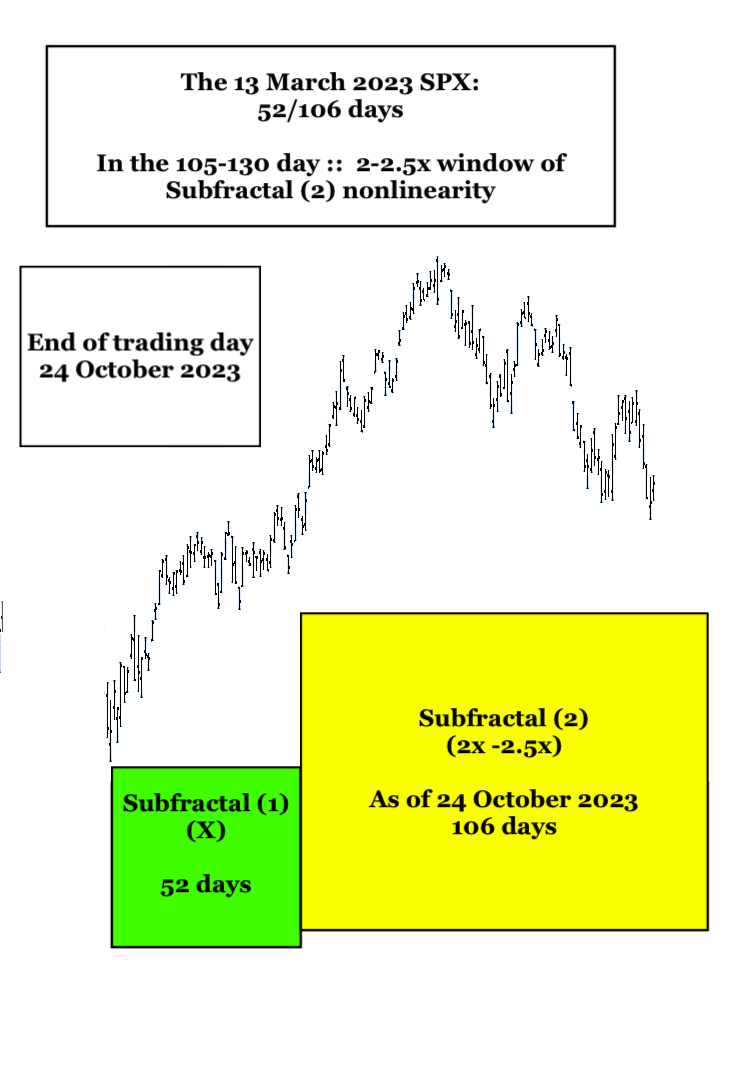
The terminal 3/6 month growth of subfractal (3) 17 months is composed of a two fractal sub fractals: subfractal (1) starting 13 March 2023 of 52 days and subfractal (2) staring on 24 May 2023, which as of 24 October 2023 end of trading day, is on day 106 days and is within the 104 to 130 day :: 2x-2.5x window of subfractal (2) nonlinearity. See below.
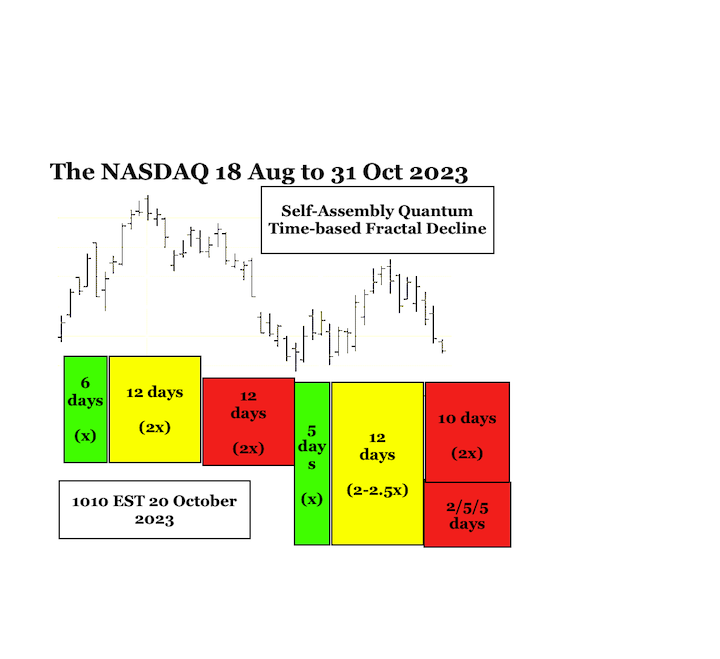
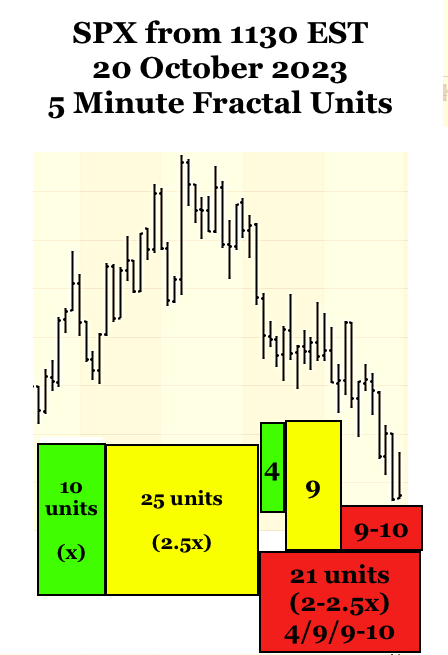
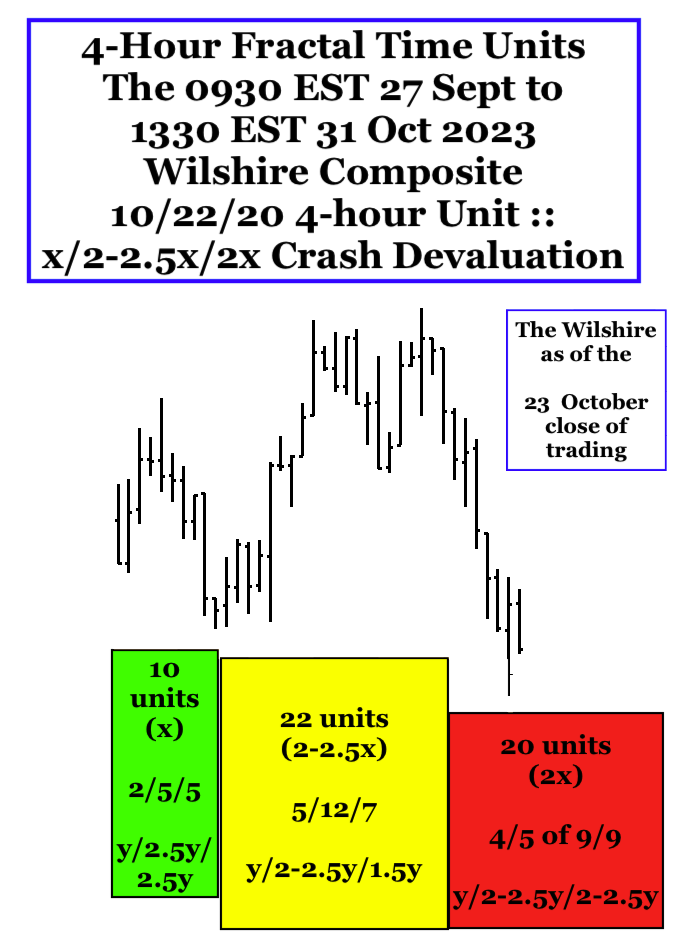
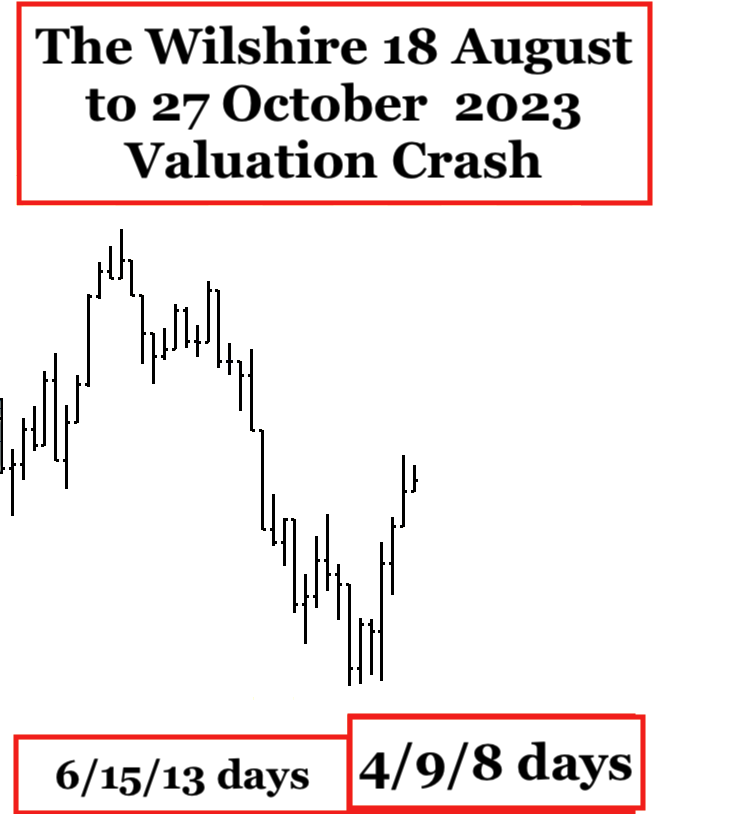
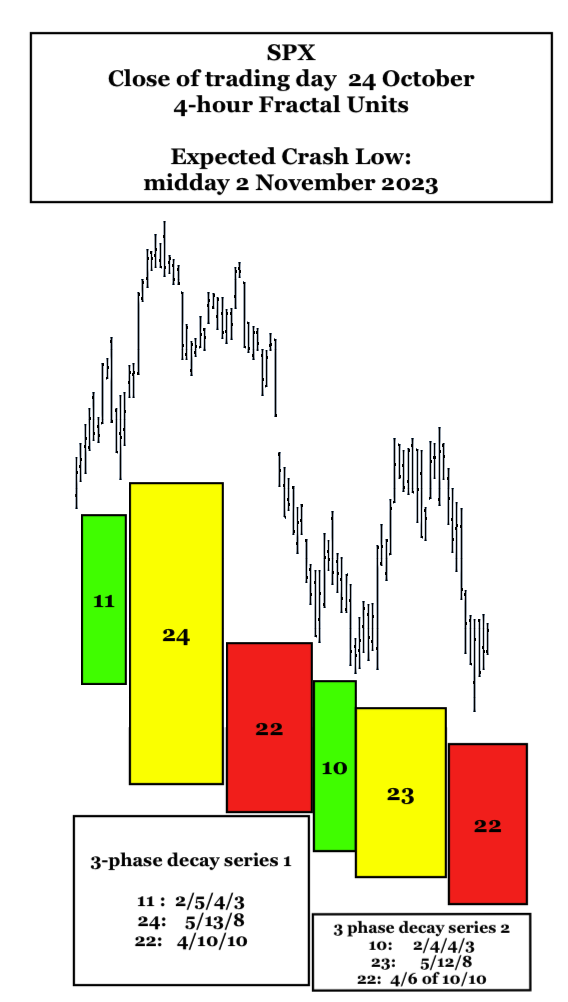
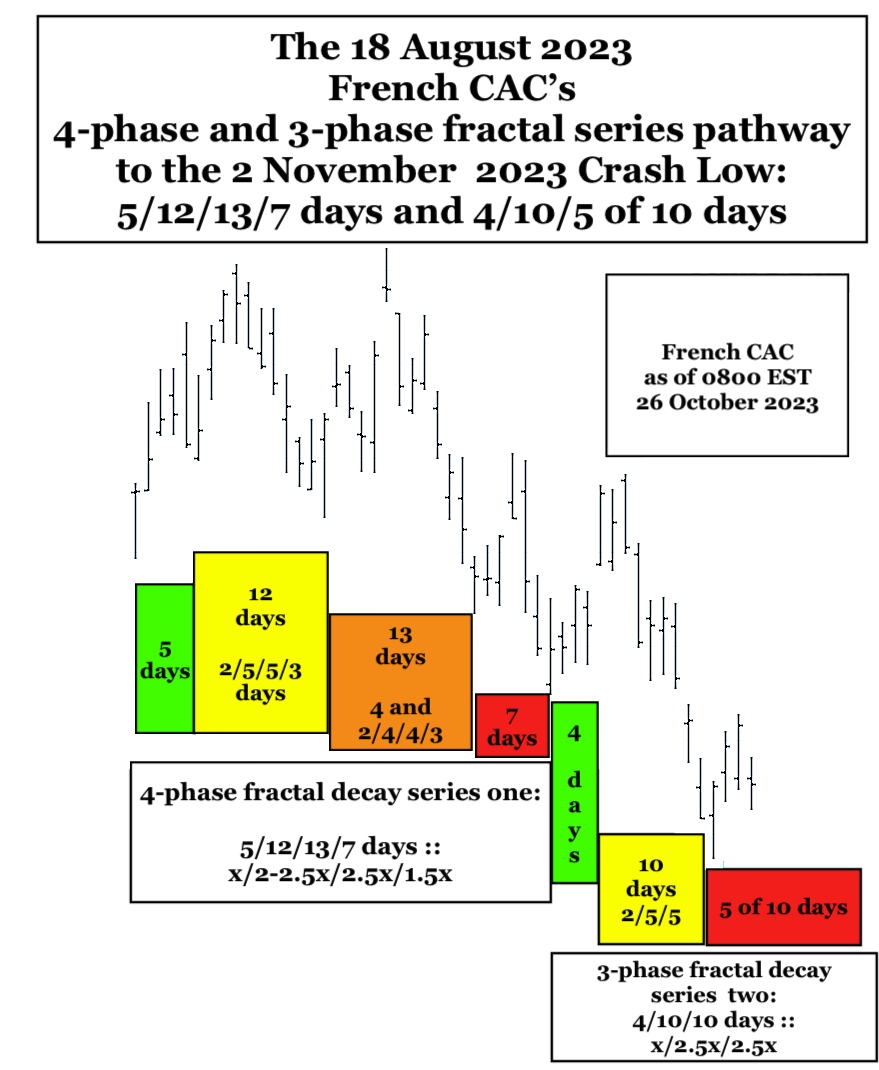
Starting 18 August 2023 two 4-hour unit fractal series occur sequentially as depicted below and ending mid trading day on Thursday 2 November 2023. See below:
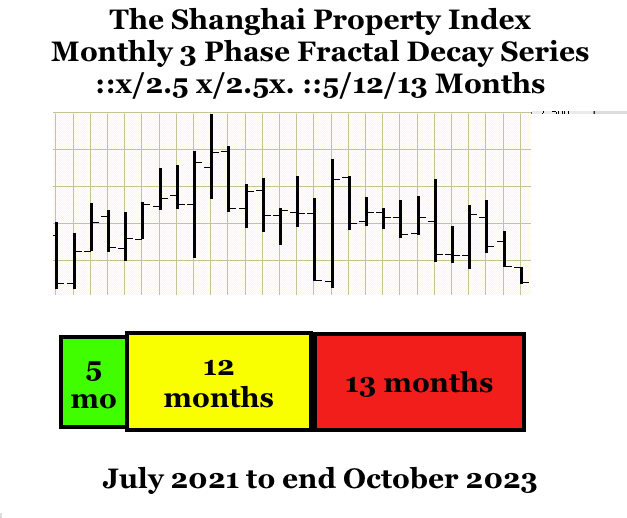
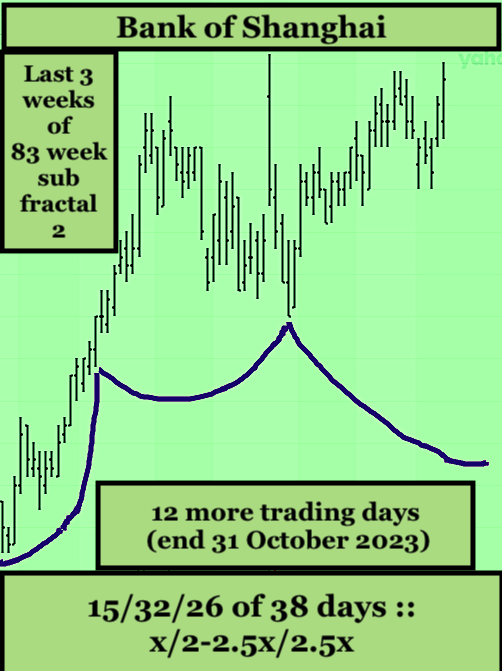
The Bank of Shanghai is the following the massive China’s property collapse and a current default on rollover debt owed by mega construction corporations. The Bank of Shanghai has an expected intermediate subfractal (2) low on the 83rd week of a 33/83 week fractal series with a subfractal (3) low in 1.5x -2x or 49 to 66 weeks. See below: This chart was created two weeks ago and the 83 week subfractal (2) is currently in the 82nd week of the 83 weeks.
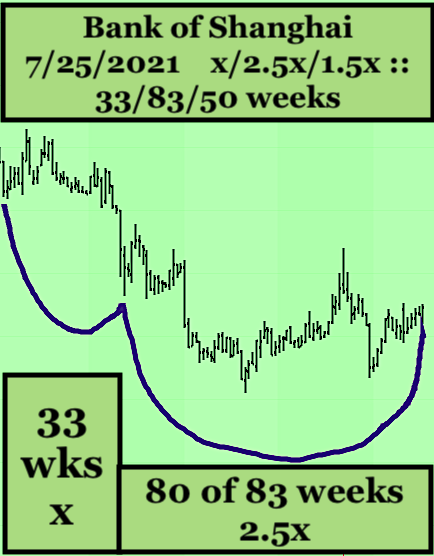
The final 18 weeks of the 83 week subfractal (2 ) is composed of a 10/25/14-15 day fractal series and a 7/18/17 day fractal series ending on 2 November 2023.
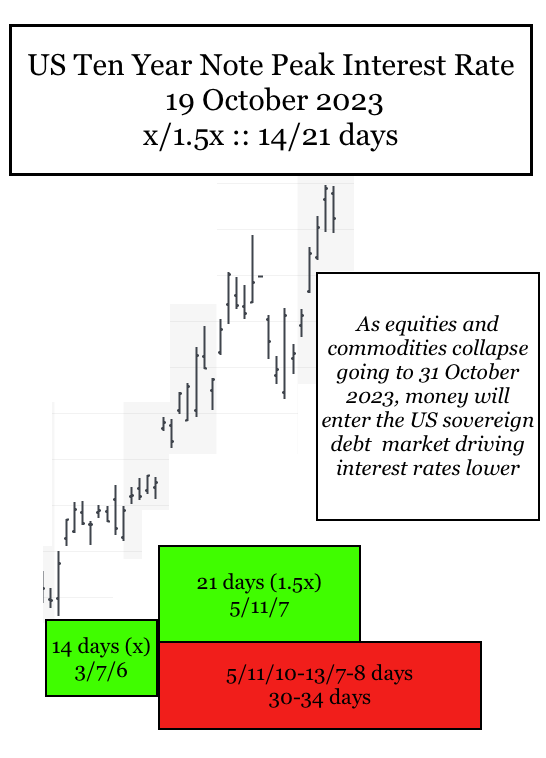
All asset classes will undergo synchronous nonlinear devaluation to 2 November 2023 except held sovereign US debt which will rise in value (lower interest rates).
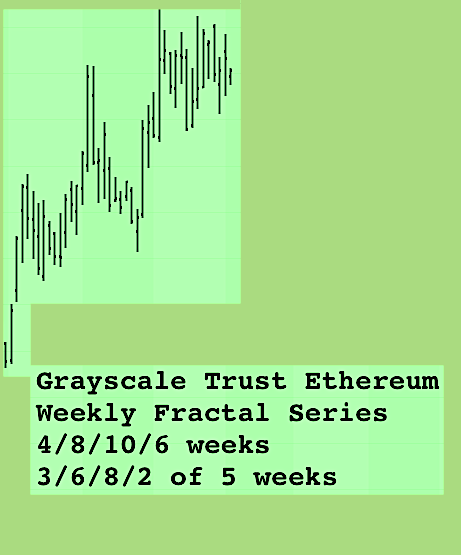
A 20/44/44 month :: x/2-2.5x/2-2.5x growth fractal series for Bitcoin in USD that started in January 2015 with a final lower high gapped peak on 24 October 2023 will undergo a crash devaluation. Cryptocurrencies (use GBTC as a proxy) have undergone a 26 September 2023 short squeeze blow-off of 4/10/8 days :: x/2.5x/2x with a gapped high today and likely ending on the low of the day. This blow-off series will convert to a crash devaluation series of 4/10/10/6 days. The final 6th day of this crypto fractal series is 2 November 2023 and coincides with the expected terminal day of a weekly 29 Sept 2021 gold fractal series of 15/38/37/22 weeks :: x/2.5x/2.5x/1.5x with the final 22 weeks composed of a 7 June 2023 15/37/33/22 days :: x/2.5x/2-2.5x/1.5x ending on 2 November 2023.
A Primer on the the Self-Assembly Time-scale Fractal Nature of the growth and decay of asset valuations within the deterministic asset-debt macroeconomic system:
There are only two elegantly simple laws of time-based fractal asset-debt macroeconomics:
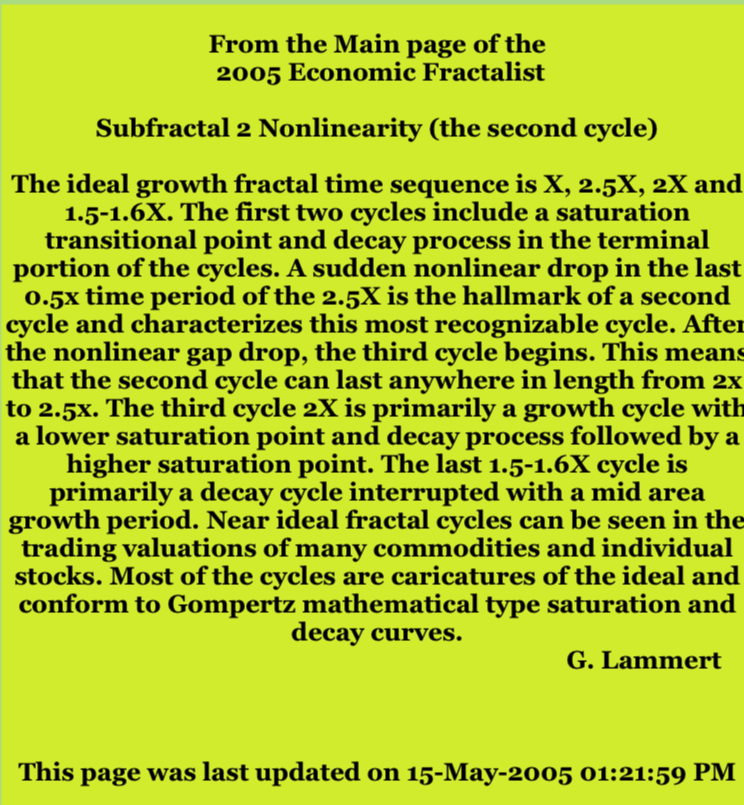
While money and credit growth (and contraction)by central banks and government spending is periodically irregular, equity and commodity composite valuations set order their growth and decay by only two distinct time-based fractal patterns(mathematical laws): a three phase pattern: composed of three subfractals:1/2/ and 3 :: x/2-2.5x/1.5-2.5x – where x is the base first fractal time length in days, weeks, months, and years.
and a four phase pattern: composed of 4 subfractals: 1/2/3/ and 4 :: x/2-2.5x/2-2.5x/1.5-1.6x, where x is the base first fractal time length in days, weeks, months, and years. Subfractal(3) of the 4 phase fractal series pattern can be a peak valuation such as the 2.5x 90 year subfractal (3) on 8 November 2021 or a low valuation in a declining fractal series.
The time length of subfractal 2 (2-2.5x) of the 3 and 4 phase fractal series often determines the ideal time length of subfractal 1 : (x’) upon which the lengths of sub-fractals 3 and 4 are based: e.g., the 4 phase fractal pattern’s time lengths become x/(2-2.5x divided by 2.5 = x’)/2-2.5x’/1.5-1.6x’.
Added 26 October 2023 0847 EST: Below is depicted the French stock market composite CAC’s sequential two daily fractal decay series to the nonlinear 2 November 2023 Crash low.
The Fractal History of the 19 October 1987 global crash and the comparison to the 2 November 2023 crash:
The 1987 SPX and global crash occurred in the subfractal (2) 2-2.5x nonlinear devaluation widow of two interpolated subfractal (1) and. subfractal (2) monthly fractal series. The first was a 20/45 of 46 months fractal series starting in July 1982 and the second, an interpolated fractal series of 11/26 of 27 months fractal starting in November 1984.
Preceding the Sept-Oct 3 phase daily crash fractal series was a self-ordered 20 May 1987 4-phase 13/32/25/18 day :: x/2.5x/2x/1.5x fractal series ending 21 September 1987. The 4/9/10 day :: x/2-2.5x/2.5x 3-phase crash series occurred from 21 September to 19 October 1987 with a peak to nadir loss of 33%.
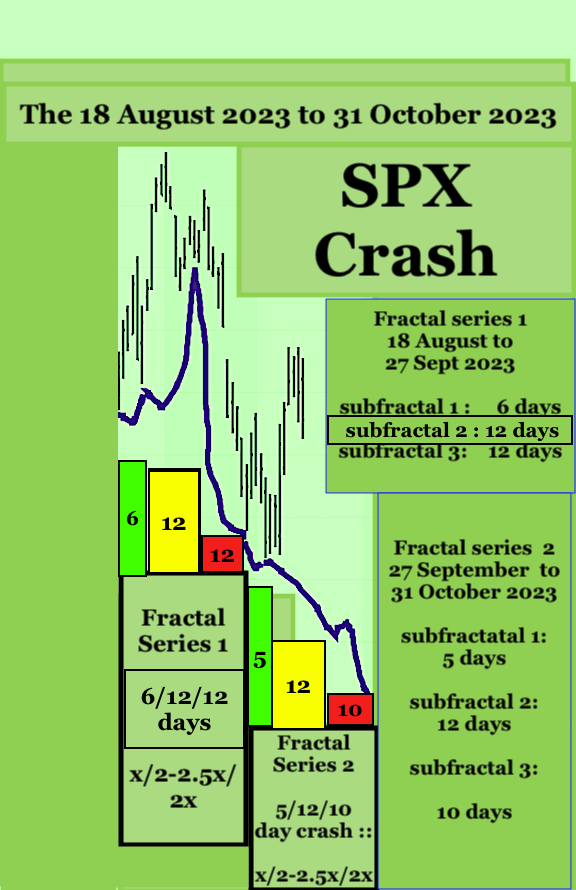
The SPX is again in the terminal 2x-2.5x nonlinear devaluation window of two subfractal(1) and subfractal (2)series: a 1982 13/30 year fractal series and a 13 March 2023 52/107 day fractal series. The crash daily decay fractal series appears to be a 27 September to 2 November 2023 5/12/12 day :: x/2-2.5x/2-2.5x series. At a 4-hour unit level the last 12 days appear to be following a 4/10/10 4-hour unit :: x/2.5x/2.5x 3-phase fractal decay series ideally ending around noon on the trading day of 2 November 2023. The greatest decline will likely occur in the last units of the final 10 4-hour unit sequence.
Added: 0946 EST 26 October: A Comparison of The Crash of September-19 October 1987 to the Crash of October to 2 November 2023.
A History of October 1987 Quantum Fractal Series:
The 1987 SPX and global crash occurred in the subfractal (2) 2-2.5x nonlinear devaluation widow of two interpolated
subfractal (1) and. subfractal (2) monthly fractal series. The first was a 20/45 of 46 months fractal series starting in July 1982 and the second an interpolated fractal series of 11/26 of 27 months fractal starting in November 1984.
Preceding the Sept-Oct 3 phase daily crash fractal series was a self-ordered 20 May 1987 4-phase 13/32/25/18 day :: x/2.5x/2x/1.5x fractal series ending 21 September 1987. The 4/9/10 day :: x/2-2.5x/2.5x 3-phase crash series occurred from 21 September to 19 October 1987 with a peak to nadir loss of 33%.
The SPX is again in the terminal 2x-2.5x nonlinear devaluation window of two subfractal(1) and subfractal (2)series: a 1982 13/30 year fractal series and a 13 March 2023 52/107 day fractal series. The crash daily decay fractal series appears to be a 27 September to 2 November 2023 5/12/12 day :: x/2-2.5x/2-2.5x series. At a 4-hour unit level the last 12 days appear to be following a 4/10/10 4-hour unit :: x/2.5x/2.5x 3-phase fractal decay series ideally ending around noon on the trading day of 2 November 2023. The greatest decline will likely occur in the last units of the final (10) 4-hour unit sequence.
Below: Added 29 October 832 PM EST
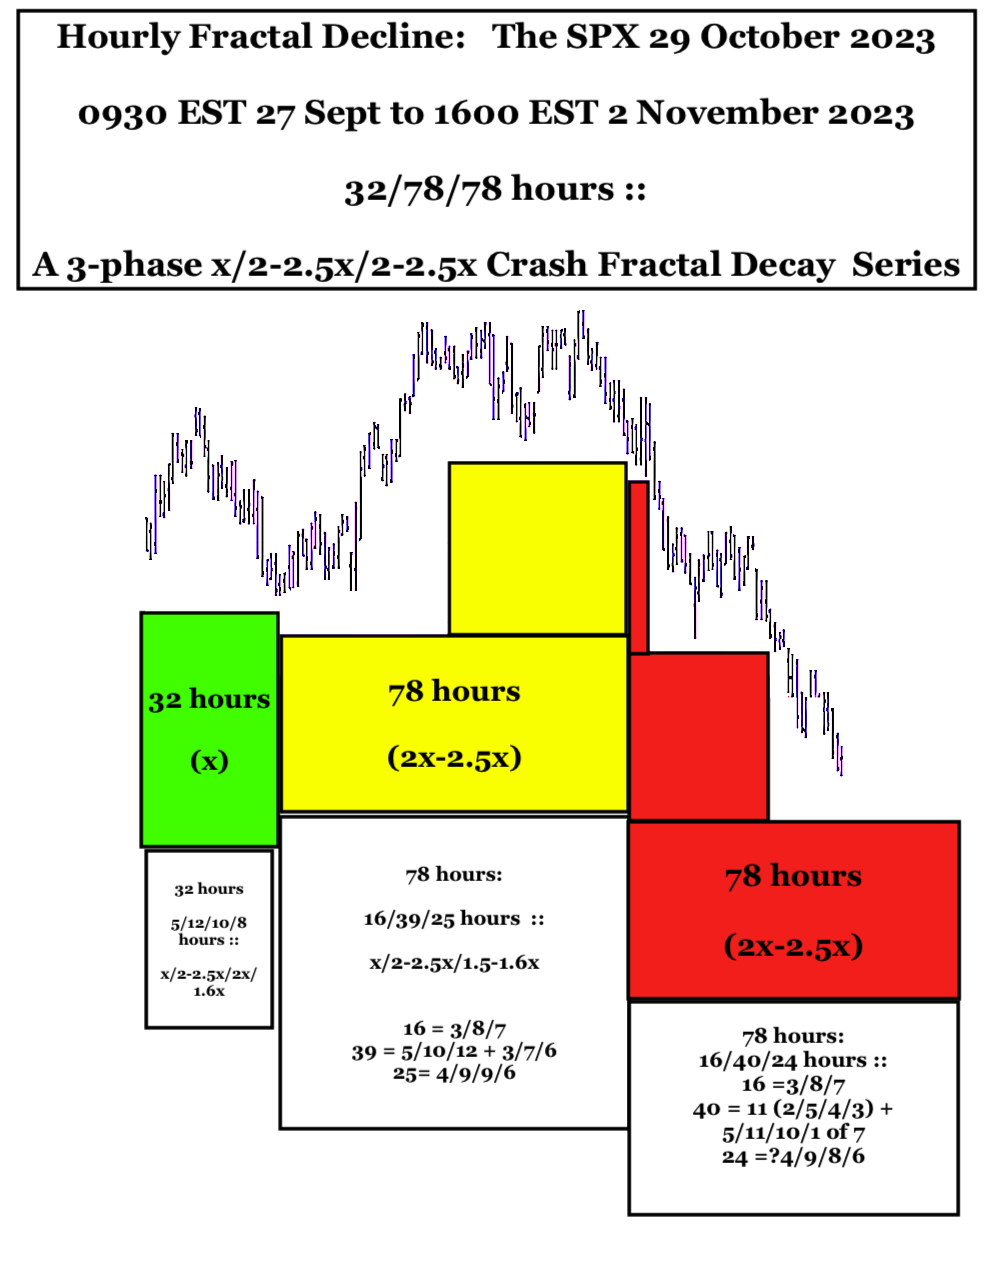
The 27 September 2023 32/78/78 hour :: x/2.5x/2.5x 3-phase fractal decay crash to the end of the trading day 2 November 2023
The final daily fractal decay sequence of a 13 March 2023 52/113 day :: subfractal (1) and subfractal (2) is a 3-phase series of 5+/12/12 days beginning on 27 Sept and ending 2 November 2023 (assuming no trading halts). On a hourly basis a 32.78/78 hour, 3- phase X/2.5x/2.5x decay fractal series is observed starting 0930 EST on 27 September 2023 and ending 400PM EST 2 November 2023.