Existing corporate, private, and governmental debt and ongoing and future social contract debt (i.e, health, retirement, disability and poverty subsistence programs) form a conjoined foundation of all of the world’s 1.4 quadrillion dollar – equivalent ongoing asset (and debt as an asset) valuations.
When the dr/dt/dt of collective new debt creation becomes zero and thereafter negative, non-sovereign debt asset valuations decrease, bad debt supporting those declining asset valuations undergo default or restructuring, and a nonlinear deleveraging of overvalued assets occurs.
It is the hypothesis of this website that this connected process of total debt and total asset valuation growth and decay is a self-assembly mathematical process that is self-ordered and naturally transpires in a time-based fractal manner.
China surpassed the US in manufacturing output in 2010 and today produces 80 percent more manufactured goods than the US. It’s output today represents about 28% of the world manufacturing.
But China has a huge asset-debt problem. Corporate Debt to GDP ratio is over 150 percent. A sizable amount of that debt has been spent in building 3 billion residential units for 1.4 billion people. Compare that to the 5 % oversupply in the 2008 US housing bubble. That enormous China corporate debt and residential oversupply has been propped up over the last few years with central and local government intervention, but it is teetering on a collapse with recent failed corporate payments on loan interest. The dynamic has resulted in 92-99.9 valuation collapses in Evergrande and Country Garden building corporations. Chinese Banks are directly linked to this corporation debt default.
What do the ongoing and self-ordering Chinese real estate and banking equity time based fractal series reveal about the local Chinese asset-debt macroeconomic system.
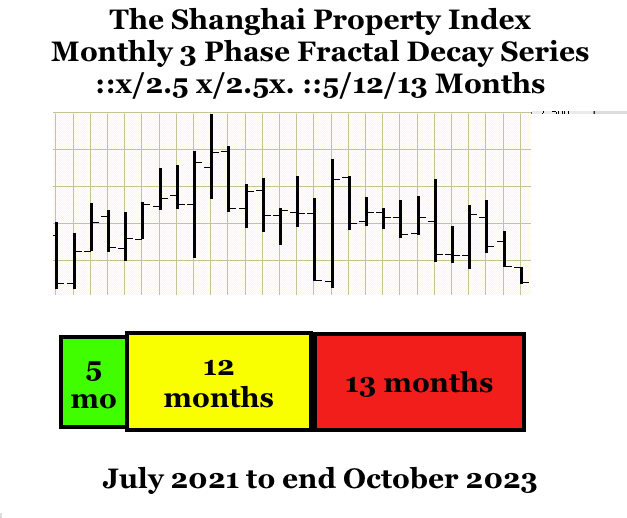
The Shanghai property Index is following a July 2021: 5/12/13 month :: x/2-2.5x/2-2.5x 3-phase fractal decay series completed at the end of October 2023.
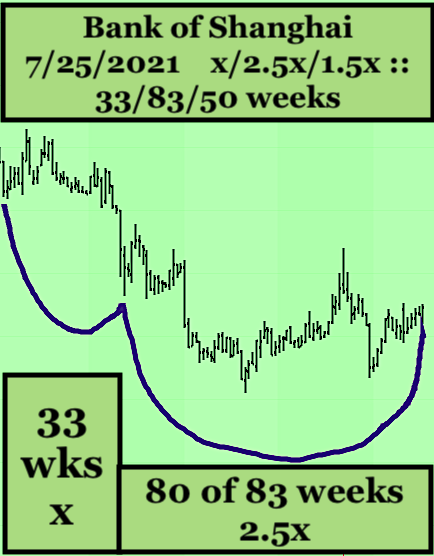
The Bank of Shanghai is undergoing a 33/80 of 83/50 week ::x/2.5x/1.5x 3-phase fractal decay series with an 83 week ‘subfractal 2’ terminus at the end of October 2023 and a final low in September or October 2024.
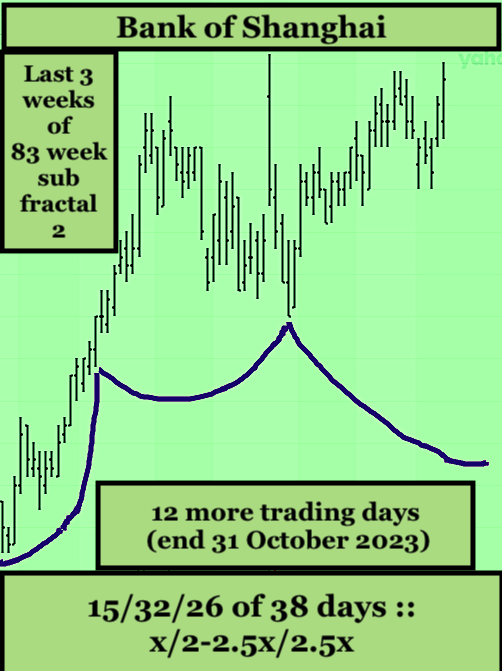
On a daily fractal basis (below) the final 18 weeks of the 83 week ‘subfractal 2’ appears to be a 15/33/26 of 37 to 38 day 3-phases decay series ending 30 to 31 October 2023 which composes the 18 week 3/8/6/4 week 4 phase fractal decay series.
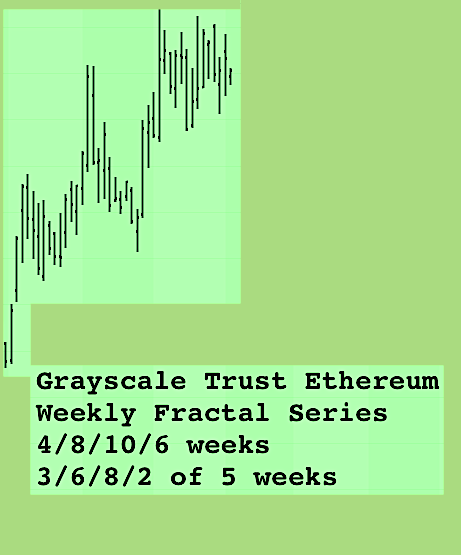
Cryptocurrencies and gold are following similar 15/17/33/12 of 22 month :: x/2-2.5x/2-2.5x/1.5x 4 -phase fractal series which will end in Sept 2024. The weekly fractal series composing the final two sequential series of 12 and 11 months that compose the 22 month ‘subfractal 4’ is shown below with a weekly terminus at the end of September 2024 early October 2024.
In the last paragraph of the main page of this website, nonlinearity for ‘subfractal 2’ (second cycles) is described.
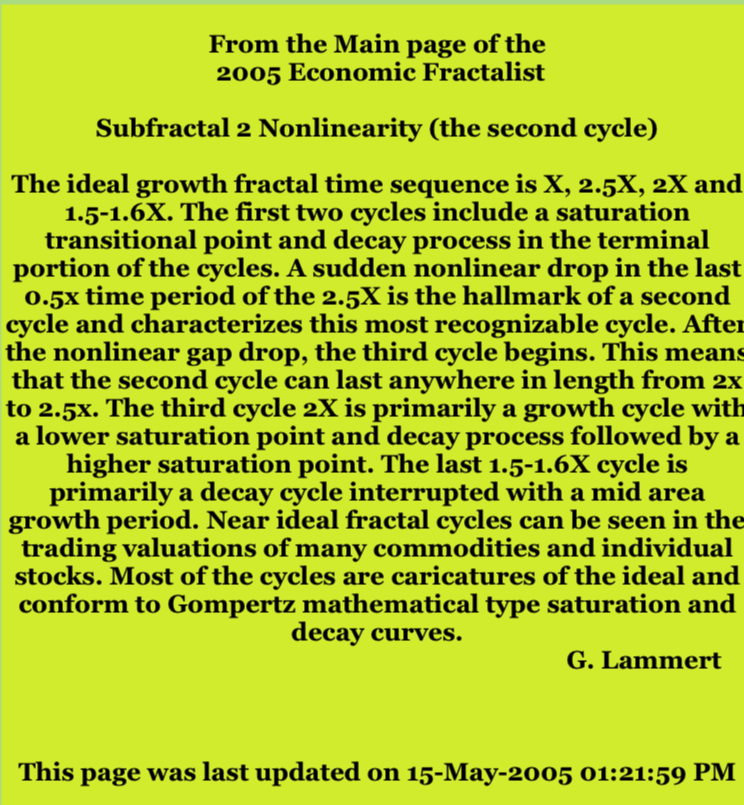
(The determination of the Great US Fractal Cycle has changed since the 2005 main page posting. The second cycle did not begin in 1858 but rather in 1842-43 after the collapse of the Lousiana purchase territory property bubble and the panic of 1837. The great US fractal cycle started in 1807 after an initiating fractal series of 17 years occurring after the primitive stock exchange Buttonwood agreement in 1792. The 1842-43 90 year ‘subfractal 2’ nadired to an 8 July 1932 average low and the 90 year ‘subfractal 3’ peaked to average daily high on 8 November 2021. The US Asset-Debt Macroeconomic hegemonic series is an 1807 36/90/90/54 year 4-phase fractal series.)
Subfractal 2 nonlinearity may be self-assembling on two time scale fractal levels: a 1982 13/31 year :: x/2-2.5x : : subfractal 1/subfractal 2 level …
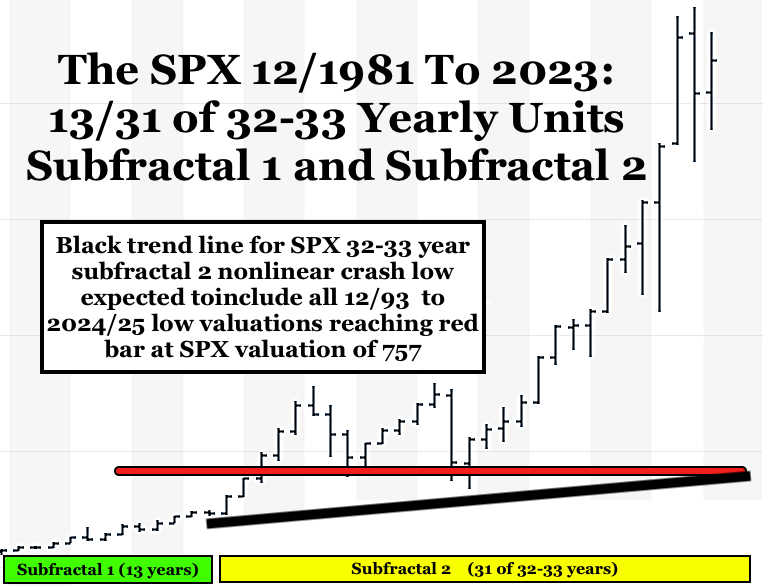
… and a weekly-daily subfractal 1/subfractal 2 level of 11/22-27 weeks x/2-2.5x and (see below). 52/104-130 days, respectively.
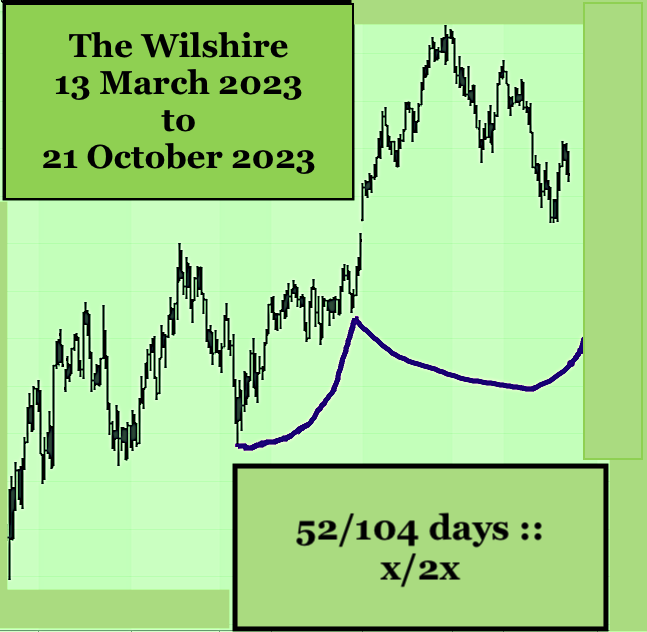
The 104th day of the 52/104 series would occur on 20 October 2023 with the window for ‘subfractal 2’ nonlinearity any time thereafter within the 105 day to 130 day window :: 2x to 2.5x window.
The SPX since the 13 March 2023 to 24 May 2023 52 day ‘subfractal 1’ has followed a sequential grouping pattern of 4 fractal series : (1) 5/11/8 + 3/8 = 31 days; (2) 5/10/10/8 days = 30 days; (3) 6/12/12 days =28 days; (4) 5/9 of 12/10 days = 25 days.
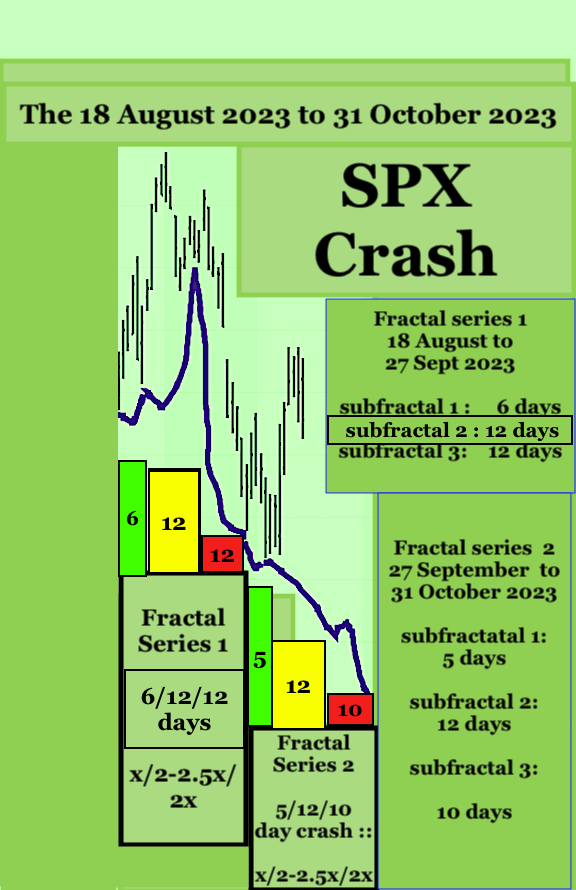
The expected nonlinear low for global equities, commodities, gold, and crypto is 30-31 October 2023 with a final low in October 2024 with a concluding March 2020 monthly 4-phase fractal series of 8/18/20/12-13 months.
Added 1718 EST 18 October 2023: The US Equity SPX’s self-ordering 4-hour time scale fractal progression since 930 EST 18 August 2023.
First 3-phase Fractal Decay series: x/2-2.5x/2x
Start 930 18 August to 0930 Sept 27
subfractal (1) 11 units : 2/5/4/3 units
subfractal (2) 24 units : 5/13/8 units
subfractal (3) 22 units : 2/5/5 units and 3/6/6 units
Second 3-phase Fractal Decay Series x/2-2.5x/2-2.5x (4-hour time scale fractal units)
Start 0930 27 Sept to 1330 31 October 2023
subfractal (1) 10 units : 2/4/4/3 units
subfractal (2) 23 units : 5/12/6 of 8 units
subfractal (3) 20-21 units : 4/9-10/8-10 units or 5/10/7 units
This Friday is day 104 of a 13 March 2023 52/104 day :: x/2x fractal series.
Monday 23 October then places the series in the window of the 104 day subfractal (2) 2x to 2.5x nonlinearity which occurs in the terminal time window of a 1981-2 interpolated fractal series of 13/26-32 year :: x/2x-2.5x nonlinearity.
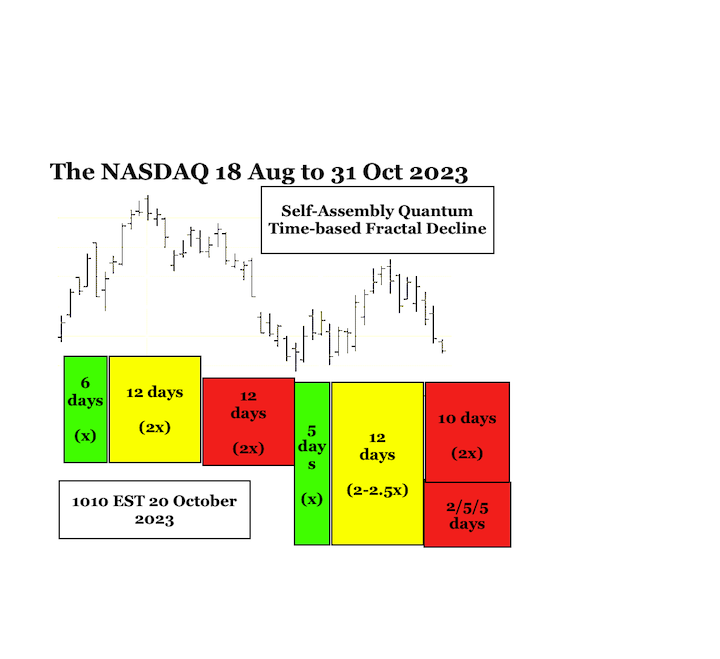
Added 20 October 2023 1112 EST: Nasdaq Daily Quantum Fractal series and Subfractals: 18 August to 31 October 2023. The final 10 day decline subfractal 3 starting 18 October 2023 and ending 31 October 2023: 2/5/5 days :: x/2.5x/2.5x.
Added 4:50 EST end of 20 October 2023 trading day.
Recent 2x-2.5x nonlinearities occurred on 19 October 1987 with a preceding 11/26 month subfractal (1) and subfractal (2) series and on 6 May 2010 with a preceding 19/44 week subfractal (1) and subfractal (2) series beginning from the low in March 2009.Both of the former fractal series occurred in the setting of money and debt expansion. The 13 March 2023 52/104 day fractal series is occurring under conditions of severe debt and money supply contraction.
Expect AI selling analogous to the computerized selling on 19 October 1987 and 6 May 2010.Added 22 October 2023 1040 EST.
The peak fractal growth for US 10 year Notes and 30 year Bonds was previously projected for 6 October 2023 but empirically reached a higher peak on 19 October 2023. With US equities reaching a 13 March 2023 11/22 week and 52/104 day subfractal (1) and subfractal (2) lower high valuation and a March 2020 8/18/20 month lower high valuation before the 5/12/3 of 10 day fractal collapse to 31 October 2023, what is the fractal growth of interest rates of US Notes and Bonds (an exact inversion of previously purchased debt valuation worth) since the Covid low interest rate valuation in March 2020?
Qualitatively after massive Covid money creation and near zero interest rate debt created consumer inflation, central banks have, countervailingly, raised interest rates.
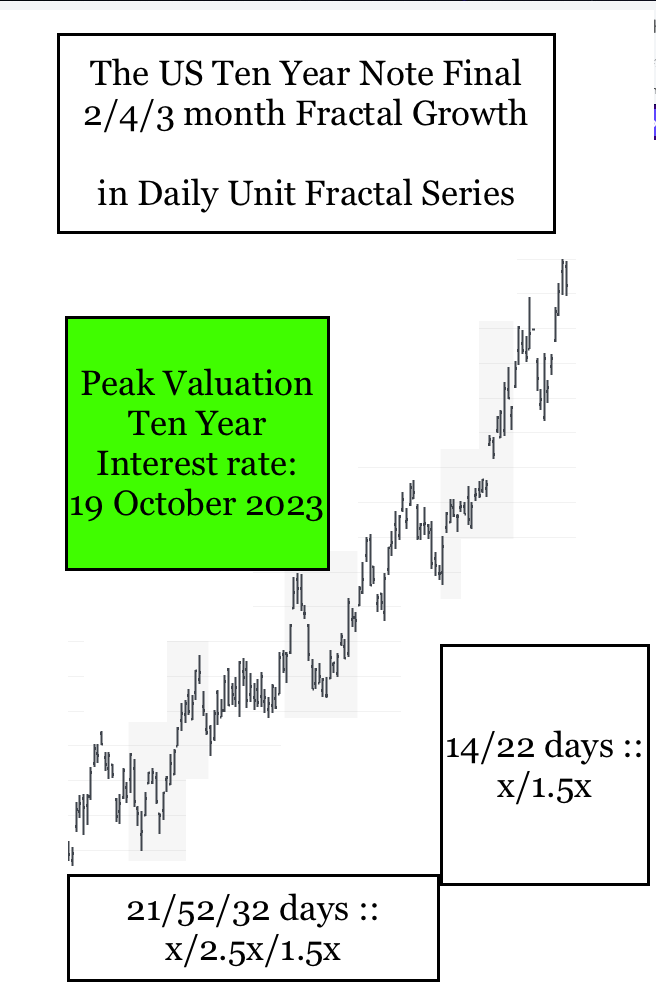
The monthly fractal blow-off growth in long term US sovereign interest rates has occurred in two monthly fractal series as depicted below: 7/16/17 months :: x/2-2.5x/2-2.5x followed by 2/4/3 months :: x/2x/1.5x. A final peak 1.5x growth, ie, 3months can be an interpolated part of a larger 3-phase x/2x/2x-2.5x fractal decay series or part of a 4-phase x/2x/2-2.5/1.6x series.
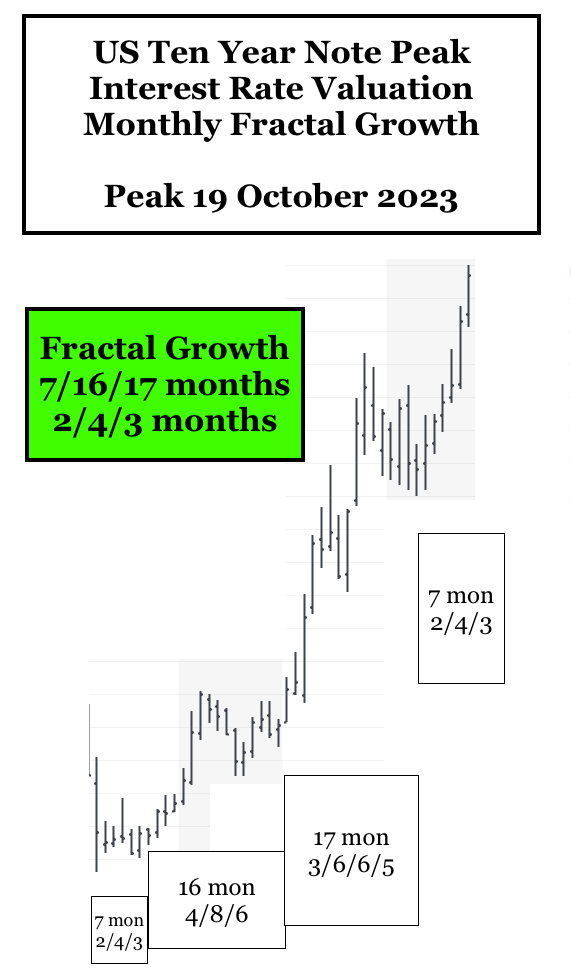
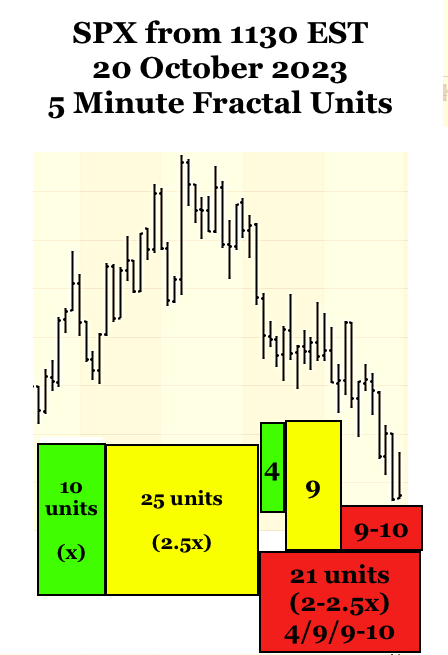
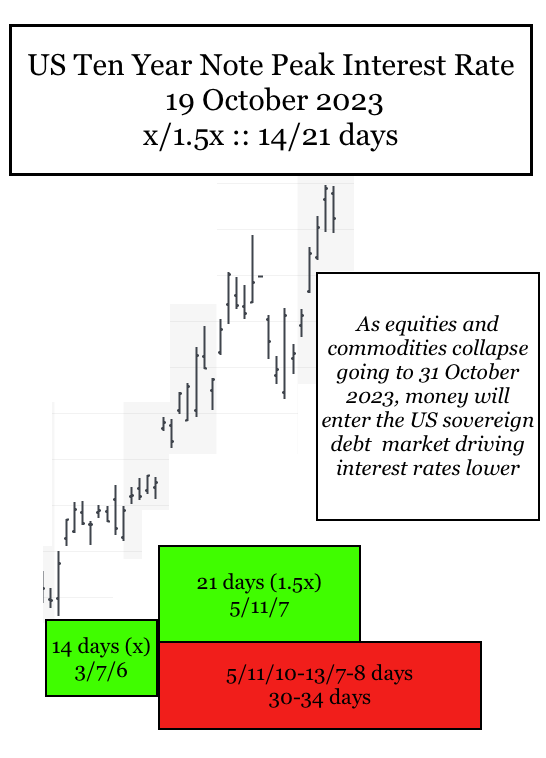
The last 2/4/3 month fractal series in this fractal growth progression can be observed on a daily fractal basis as 21/52/32 days : x/2.5x/1.5x followed by 14/21 days ::x/1.5x with a peak 10 year Note interest rate on 19 October 2023. see below.
The 14/21 day :: x/1.5x peak interest rate valuation then collapses as global money – from the 13 March 2023 22 week and 1994 30+ year subfractal (2)’s 2x-2.5x US windows of nonlinear collapsing valuation- enters the US sovereign debt market and drives interest rates lower. The 14/21 day :: x/1.5x becomes an interpolated part of a 3-phase 14/29-35/28-35 day decay series or part of a 4-phase 14/29-35/28-35/22 day decay series.
Added 23 October 2023 809PM EST:
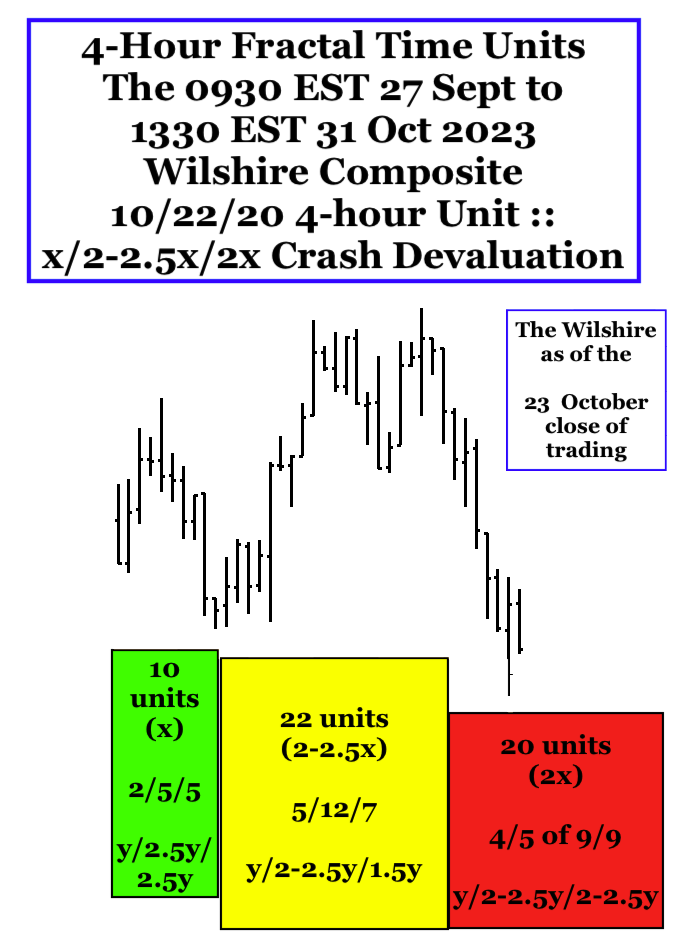
On a four hour unit fractal basis, a 8/18/20 month Wilshire and Global crash low will occur in the afternoon of 31 October 2023 with a lower low in Sept-Oct 2024. (see graph below)
27 September 2023 Wilshire 4-hour unit 3-phase fractal decay series 10/22/20 units
0930 EST 27 September to 1330 EST 3 October 10 units
1330 EST 3 October to 0930 EST 18 October 22 units
0930 EST 18 October to 1330 EST 31 October 20 units
At the close of today the 18-31 October series is 4/5 of 9/9 4-hour units.