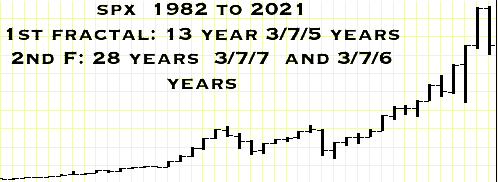
The third 90 year US Great Fractal spanning from 1932 to 2021 was composed of two fractal sub=series: 11/21/21 years ending in 1982 and a 40 year 13/28 year series peaking in November 2021. (See below)The 13 year first sub-fractal was composed of 3/7/5 years and the 28 year second sub-fractal composed of two sub-fractals: 3/7/7 years ending in a 2008 low year and a 3/7/6 years peaking in 2021, the 90th year of the US 36/90/90 year ::x/2.5x/2.5x maximal growth series.

Since October 2008, US equity market valuations have been fueled by trillions of dollars of too big to fail toxic asset bipartisan federal underwriting, QE programs, near zero fed fund rates, negative interest rate European bonds, massive covid paycheck underwriting, low interest rate mortgage backed securities, and lowered corporate tax rates facilitating massive corporate stock buy backs.
Against a late -2008 fueled and fed/politician created super bubble of equity and housing over- valuations is an 11 month accelerated Fed QT and interest rate increase program of 400 percent, from about 0.1 percent to 4%, instituted to combat the 40 year high consumer inflation created by the Fed’s QE program.
Even without the QT program, a nonlinear 13/28 year x/2-2.5x second fractal devaluation was expected. With the Fed’s unprecedented tightening, the nonlinearity will be more profound.
The SPX is following a March 2020 8/16/11 of 11 month decay fractal series which matches the timing of a Wilshire peak November 2021 3/6/6 month decay fractal.
From 24 January 2022 the SPX is following a 31/72/62/43-44 day 4-phase decay series or y/2-2.5y/2x/1.5y (where x = y in time units: x growth; y decay)
(The ideal base of a 72 day second fractal is 29 days; 1.5 times 29 = 43.5 days)
The daily 31/72/62/43-44 day final series exactly matches the description in the 2005 main webpage of a x/2-2.5x/2x/1.5x fractal series. “The ideal growth fractal time sequence is X, 2.5X, 2X and 1.5-1.6X. The first two cycles include a saturation transitional point and decay process in the terminal portion of the cycles. A sudden nonlinear drop in the last 0.5x time period of the 2.5X is the hallmark of a second cycle and characterizes this most recognizable cycle. After the nonlinear gap drop, the third cycle begins. This means that the second cycle can last anywhere in length from 2x to 2.5x. The third cycle 2X is primarily a growth cycle with a lower saturation point and decay process followed by a higher saturation point. The last 1.5-1.6X cycle is primarily a decay cycle interrupted with a mid area growth period. Near ideal fractal cycles can be seen in the trading valuations of many commodities and individual stocks. Most of the cycles are caricatures of the ideal and conform to Gompertz mathematical type saturation and decay curves.
G. Lammert“
The 43-44 day 4th fractal starting on 15 September 2022 is composed of a 7/15/14/10-11 day series ending on Monday 14 November or Tuesday 15 November 2022, assuming no delays because of trading halts. The final 10-11 days starting on 1 November 2022 is composed of a 2/5/5 day or a 2/5/4/3 day decay fractal series.
A historical and great 1982 13/29 year second fractal crash is expected over the next 6-7 trading day equivalents.
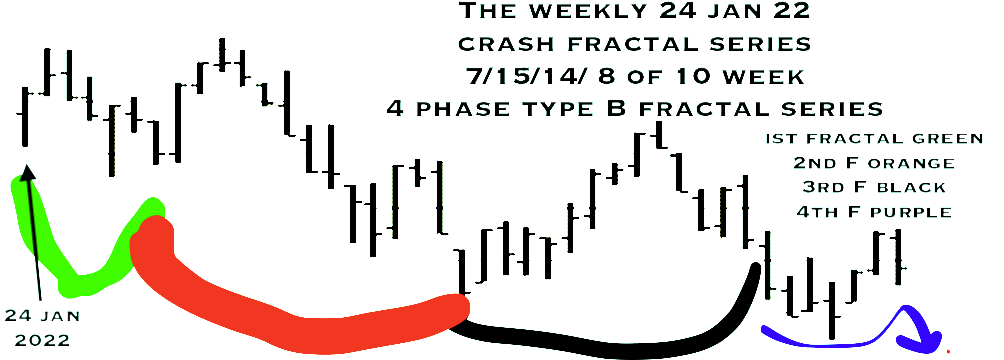
Below is the weekly 24 January 2022 series of 7/15/14/10 weeks showing the nonlinear lower valuation gap between the 14 and 15 week of the 15 week second fractal.

The final 10 weeks is composed of a 2/4/4/3 week fractal series.
9 November 2022 Update:
The final 45 days of the Wilshire’s 24 January 2022 31/71/63/45 day 4 phase crash fractal sequence and starting on 15 September 2022 is composed of a 4-phase fractal series of 7/15/16/10 days with an expected low on Wednesday 16 November 2022, barring trading halts.
For cryptocurrencies trading on a 7-day-a-week daily basis the analogous 4-phase fractal sequence starts on 23 January 2022 and is composed of a 43/104/86/66 days. The final 4th fractal 66 day sequence starts on 11 September 2022 and is composed of a 4-phase sequence: 10/23/21/15 days and ends on Wednesday 16 November 2022.
Both the Wilshire and Bitcoin shared their daily average high valuations on 8 November 2021. For the Wilshire, the daily high occurred in the 90th year of a 1807 36/90/90 year maximal growth fractal series.