Why is the Russel 2000 a useful composite to follow? The Russel is useful because it represent the weakest index composed of heavily indebted companies (debt up to 50 times assets) who must roll over massive existing debt and borrow new debt with a fed fund rate of 3.75- 4 percent, a rate that was less than 0.1% one year ago. Below is a graph of the Russell 2000 in weekly time units dating from 24 January 2022, the beginning of the the third 11 month fractal of the current March 2020 8/17/11 month series. (8/16/11 months for the Wilshire). The terminus of the 11 months will conclude a 31-32/68/68 monthly series starting with ending monthly low in February 2009 or the absolute low in March 2009. (See previous posting.) The terminus also concludes an interpolated 1982 first and second fractal series of 13/29 years. Contained within the 1982 first and second fractal series is the 8 November 2021 Wilshire and Bitcoin in USD peak valuation occurring in 90th year of the third 90 year fractal of a US 1807 36/90/90/54 fractal series.
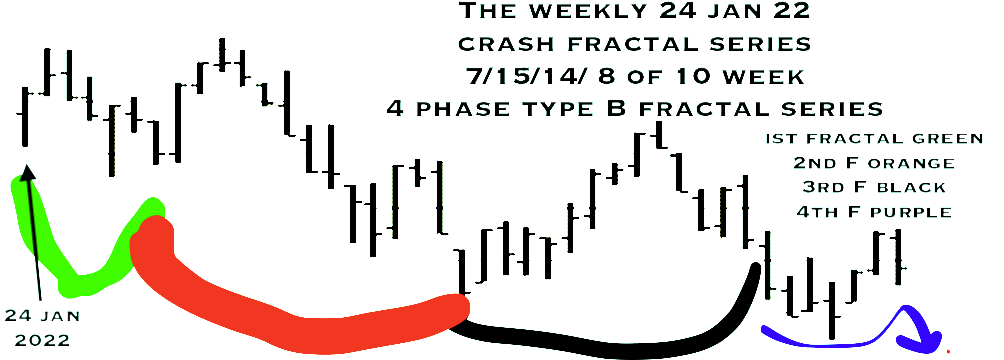
The above graph depict a x/2-2.5xy/2x/1.5y :: 7/15/14/8 of 10 week fractal series. The green 1st fractal is composed of a 2/4/3 week series. The 2nd orange fractal is composed of a 3/8/6 week series. The third black and 4th purple fractal series is composed a 5/10/10 weeks of which the 4th purple fractal is composed of a 2/4/4/expected 3 week series. Notice the nonlinear lower valuation gap between week 14 and 15 of the orange underlined 2nd 15 week fractal. The nonlinear gap between 2x and 2.5x characterizes second fractals as described in the 2005 original website main page. The daily fractal series correlating to the weekly series is 31/71/64/expected 44 days. The 64 days of the third 14 week fractal underlined I black is composed of a 19/46 day with a nonlinear gap observable on the daily charts between day 45 and 46 of the 46 day second fractal. The final expected 44 day fractal starting 16 September 2022 is composed of an interpolated 8(2/4/4 downgoing )/18/20 day fractal series. Interpolated mathematical fractal series like the individual nation-state economies making up the global asset-debt system are elegantly interlocking. A 39 day fractal series starts on 23 October 2022 and is composed of a 6/15/12/9 day fractal series with an expected low on 16 November 2022 barring trading halts.
Review of the Asset-Debt systems two fractal growth and decay mathematical patterns:
An ‘A’ type 4-phase fractal series : xy/2-2.5xy/2-2.5xy/1.5xy (the fourth subfractal unit ranges from 1.4xy to 1.6xy)
First xy subfractal unit: time length defined by nadir to nadir point time trading saturation valuations
Second 2-2.5xy subfractal unit: time length defined by nadir to point time nadir trading saturation valuation with a nonlinear lower low drop occurring between the 2x to 2.5x time frame
Third 2-2.5xy subfractal unit: time length defined by concluding Second subfractal point time nadir valuation to final point time peak valuation trading saturation
Fourth 1.5xy subfractal unit: time length defined by point time third subunit peak valuation to point time nadir trading saturation valuation
and
a ‘B’ type 3-phase fractal series: xy/2-2.5xy/1.5-2.5xy.
The first, second, and third subfractal units of the 3-phase fractal pattern are all defined by the time length defined by nadir to nadir point time trading saturation valuations