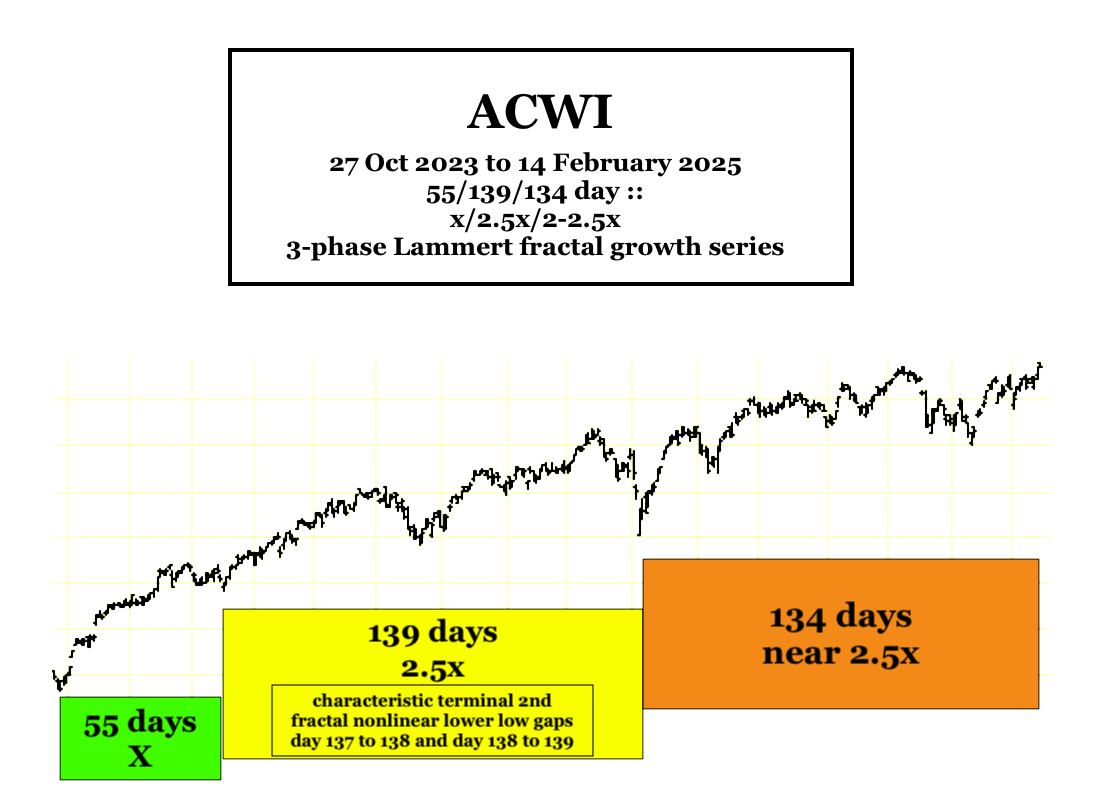
On Friday 21 February 2025, The SPX and ACWI completed a maximum growth x/2.5x/2.5x :: 55/139/138 day 3 of 4 phase fractal series initiated on 27 Oct 2023. The SPX peak valuation occurred on day 136 of the 138 day 3rd Fractal.

Characteristic terminal 2nd Fractal lower low nonlinear gaps occurred between the prior two trading days before the 5 August 2024 139 day 2nd Fractal nadir. (See 2005 opening web page about 2nd Fractals).

Debt and credit in macroeconomic systems expand to acquire and create assets which reach eventually peak valuations or overproduction relative to the accumulated debt burden.
Debt is a countervailing asset in this system. Overreach naturally occurs when assets become over-produced and/or over-valued, and debt supporting that overproduction/over-valuation cannot be repaid. Restructuring of debt or default on debt occurs and asset prices undergo devaluation adjustment in well known cyclical patterns..
Empirical observation strongly suggests the timing of peak asset growth and nadir decline of easily tradable assets (both non-debt and debt assets) occurs and self-organizes in two very regular time-based fractal series patterns:
a four phase phase fractal series pattern of x/2-2.5x/2-2.5x/1.4-1.6x
and a three phase fractal series pattern of
x/2-2.5x/1.5x-2.5x.
The individual elements in the four phase series are arbitrarily and sequentially termed the 1st, 2nd, 3rd, and 4th Fractals andin the three phase seriesthe 1st. 2nd, and 3rd Fractals .
With the exception of the 3rd Fractal in the four phase series, Individual fractals (groupings)are defined by beginning and ending nadir to nadir valuations with all individual valuations within the fractal (grouping) above these nadir valuations. The 3rd fractal in a four phase series, represents a peak valuation.
Since the creation of the 2005 web page, the primary fractal pattern of the current US hegemonic macro economy has been traced further back than the original webpage’s 1858 origin to available trading data dating from about 1790, a couple of years before the 1792 Wallstreet Buttonwood agreement.
An incipient 18 year fractal series occurred from 1790 to 1807 ending in nadir commodity prices in the depression of 1807. This 18 year incipient fractal served as the basis for an 1807 four phase x/2.5x/2.5x/1.5x fractal series of 36/90/90/54 years ending in about 2074. The nadir valuations of commodity and stock progenitors for the 36 year 1st Fractal and the 90 year 2nd Fractal occurred in 1842/43 and 1932 respectively. 8 November 2021 represented the 90 year 3rd Fractal Peak.
The 90 year 3rd Fractal beginning in 1932 and 54 year 4th Fractal starting in 2021 are composed of two interpolated fractal series: a 1932 10/21-22/21-22 year three phase series ending in 1982 and a 4 phase 1982 13/32-33/32-33/20 year series ending in 2074.
Credit is created via private fractional reserve banking and via central bank money creation. The former is collateralized by assets and the latter by securitized assets and by future taxation.
US politicians adopted anti-US industry based-policies and treaties starting in the 1990’s favoring corporation profits via the use the very cheap foreign available labor. Private US credit expansion to corporations allowed investment abroad and foreign countries bought US national debt to fund the US military, transoceanic transportation protection, and deficit spending for US social programs to bolster appearances in a setting of a declining standard of living requiring two breadwinners in aa typical US household.
The predominant interpolated four phase fractal series for US composite equities since 1982 is a 13/32-33/32-33/20 year series completing the 1807 36/90/90/54 year four phase fractal series.
With the leveraged housing bubble bust In 2009 and even more so with the Covid unemployment crash in 2020, the US and world central banks have unprecedentedly placed trillions of credit in circulation. This excessive credit and money expansion have distorted composite asset fractal nadir valuations.
Since March 2009 system self organizing Fractal series for the US SPX composite have been:
5/12/10/7 months :: x/2-2.5x/2x/1.5x
3/7/7 months :: x/2-2.5x/2-2.5x 8/17/17 months :: x/2-2.5x/2-2.5x 10/26/16 months :: x/2.5x/1.6x 8+/24/14 month :: x/2.5x/1.6x and 4-/8/7 months or 55/139/138 days with a peak on day 19 Feb 2025, the 137th day of the 3rd fractal

The March 2020 8+/24/14 month fractal series did not have a 27 October 2023 14 month nadir that contained all valuations from March 2020 to 27 October 2023. This was a blow-off sequence extending to Feb 2025 caused by a distortion of the central bank excessive money creation in 2020 and 2021.
A 32 year 2nd Fractal nonlinear ending for its interpolated 1982 13 year 1st Fractal base is expected with a targeted nadir in Aug-Sept 2025.

Debt and credit is created by private banks through fractional reserve banking and by money printing by