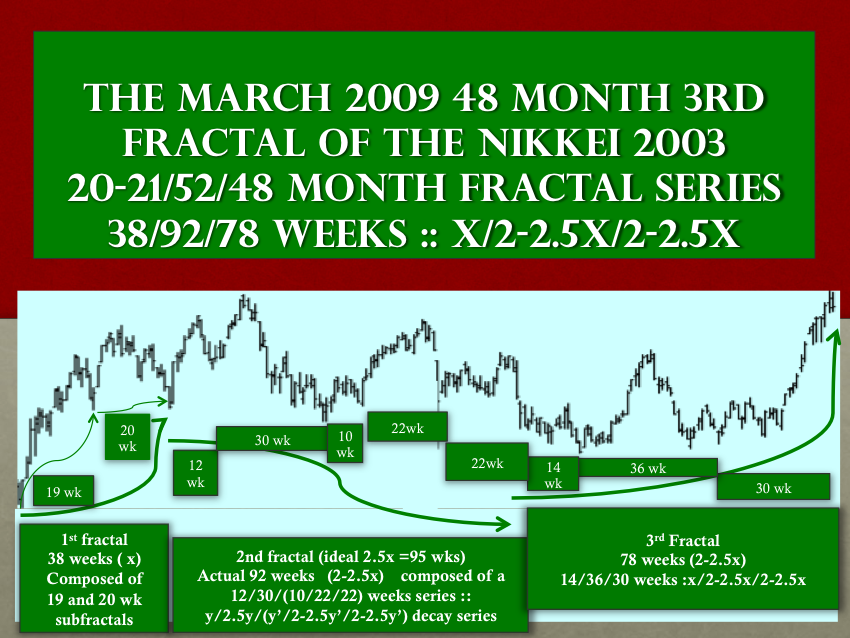
… As The New GM Goes, As KOBE Steel Goes, and As Gold Goes …. So Goes The Saturated Global Asset-Debt Macroeconomic System
The Asset-Debt Macroeconomic System is composed of two major classes of assets: tangible and intangible assets. This is the 2008 breakdown for the US.
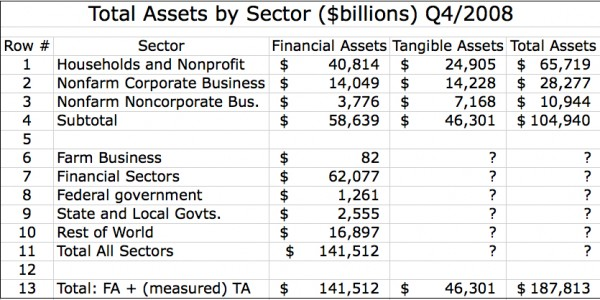
Included in the 2008 US 46 T Asset-Debt System’s tangible hard assets are the M2 money supply, factories, machinery, real estate, automobiles, energy plants, water treatment systems, electrical grid hardware and software, communication systems, military hardware, TV’s, fiber-optic cable system’s, cell phone towers, satellites, cell phones, minerals, precious metals, kitchen sinks, et. al.
Some of the tangible assets: nuclear weapons, satellite systems, delivery systems, and communication systems, which represent a very small amount of total value of the system are worth relatively much much more in terms of the maintenance of the current form of the Asset Debt system.
The Asset Debt systems intangible assets exist in some form of IOU where the intangible can be traded for and redenominated in hard currency or tangible assets.
There are two types of the IOU intangible elements: type 1: “real and existing” and are more easy to redenominate in hard currency and type II: “virtual counterparty agreements” which are much more difficult and more lengthy to settle.
The type I intangible asset has already been ‘earned’. M2 equivalent money has been traded for a derivative of a class asset; equities or commodity futures, or for debt instrument and is undergoing storage.
The storage site owes the “earned and existing intangible Type 1 asset” to its owner and acts as a trader medium to convert the asset into a M2 equivalent hard asset.
Tax laws and system leverage regulations skew M2 equivalent money flow entry into the various Type I intangible elements.
The Type II intangible asset has a virtual quality in that it only conditionally exists if the following counterparty agreement below is successively fulfilled. i
This agreement is the exchange of future earnings/tangible collateral/intangible collateral traded against the current use of existing tangible assets ,i.e., M2 often used to purchase tangible assets.
Use of ‘existing and earned’ tangible money becomes caricatured via the private banking system. The private central bank system and fractional bank lending allows adequate leverage in the system to expand a 10.5 trillion dollar base to 55 trillion of total US debt.
In a manner even the type 1 ‘earned and existing’ intangible assets have type 2 characteristics which are dependent of the viability of the trader medium and the timed based intangible asset class valuation saturation curves.
After consumer saturation with debt and overvalued assets in the 15.5 trillion base GDP and after peak equity population involvement, owners of stock market intangibles can expect nonlinear collapse in M-2 equivalent returns.
Review the estimated 2008 188 trillion US Tangible/Intangible Asset grid again.

And more recent data on Intangible asset growth by 2010

In December 2012 the Federal Reserve announced a 1.7 T dollar increase over 3 months in household and nonprofit total worth to 64.8 T still about a trillion dollars less than 4th quarter 2008. (see above tables.)
For 2013 a rough estimate of the breakdown of the US 200 trillion worth within the one quadrillion World Asset debt Macroeconomy is:
Tangible assets including the M-2 10.5 trillion money supply: 45 trillion or less (with the collapse of 2008 real estate prices)
Intangible Asset items : 1. total a) US Local ,State, Federal, b) private citizen, C)corporate, and d) financial industry debt 55T, 2. total US equity valuation 16T, 3. foreign equities 2T, commodities .5T 5. total holding of foreign state and corporate bonds 2T = 75trillion.
It doesn’t seem that the total intangible asset valuations that the official US tables delineate add to the probable 170 T (150T in 2010).
Where are the additional 95 trillion of the US financial intangible assets listed in the 2010 table and in what form are they?
And the 55 trillion in debt is leveraged and derived from a 10.5 trillion 2013 M2 base and 15.5 T a year US economy which has been supported by 600 billion year ex nihlio money creation from the US private central bank for the last four years ….
Something is clearly amiss.
This US asset debt system is excessively leveraged with 150 trillion worth of combined debt and financial intangible assets dependent on a 15.5 trillion annual GDP , a 10.5T dollar money base, and a debt saturated, overvalued-asset over-consumed consumer citizen population within that 15.5 T operating GDP economy.
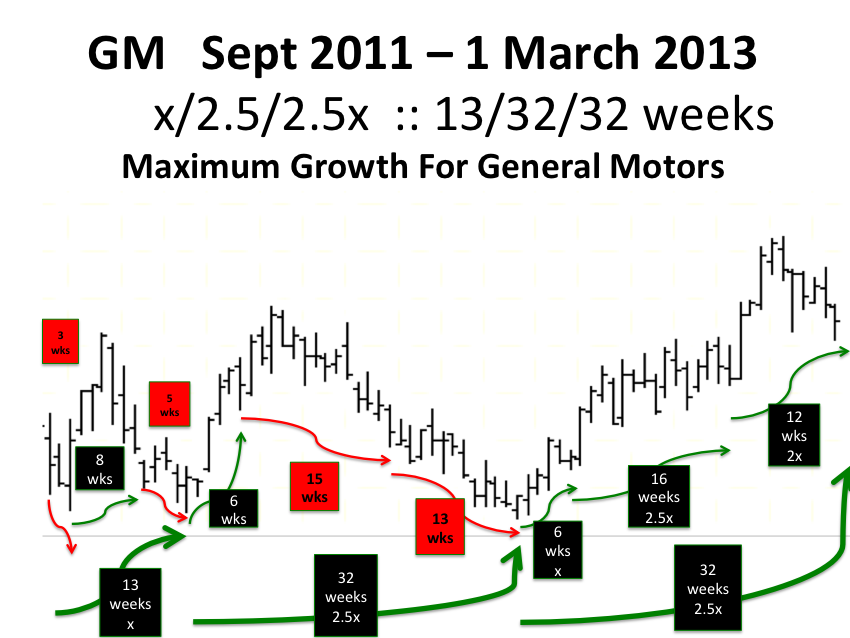
As GM Goes: So goes deflationary collapse…. Maximum growth: 13/32/32 weeks as of the week ending 1 March 2013
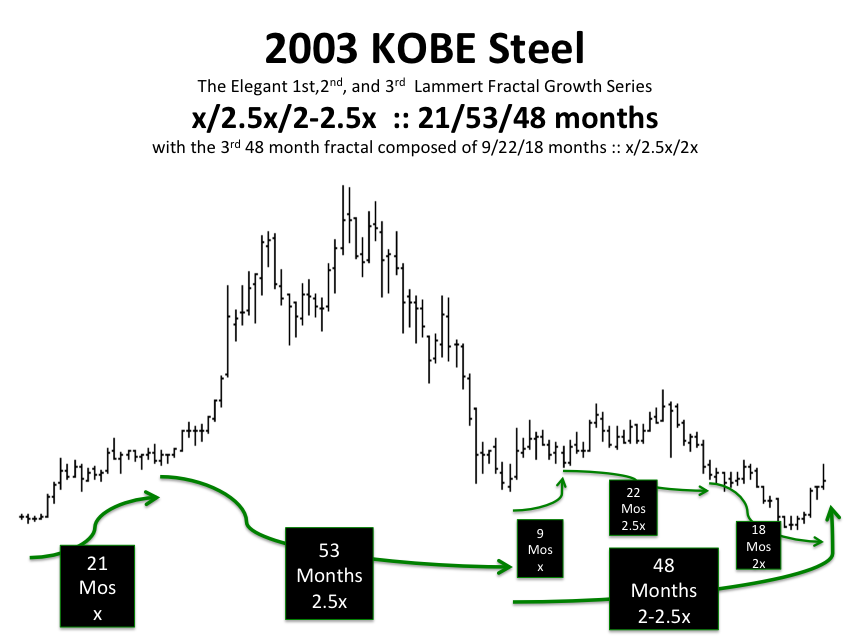
As KOBE Steel Goes… so goes the real hard asset steel girder use and macrobuilding growth in the global economy ….

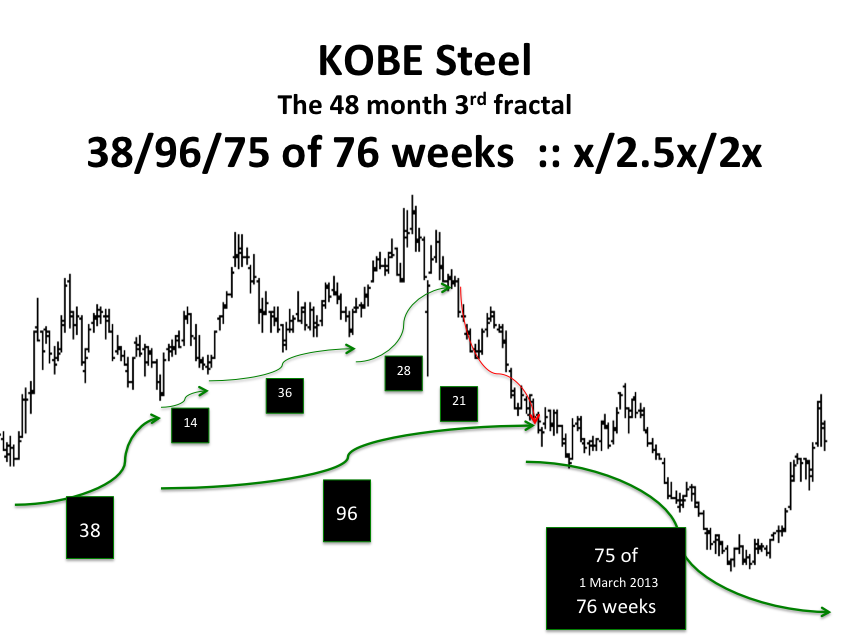

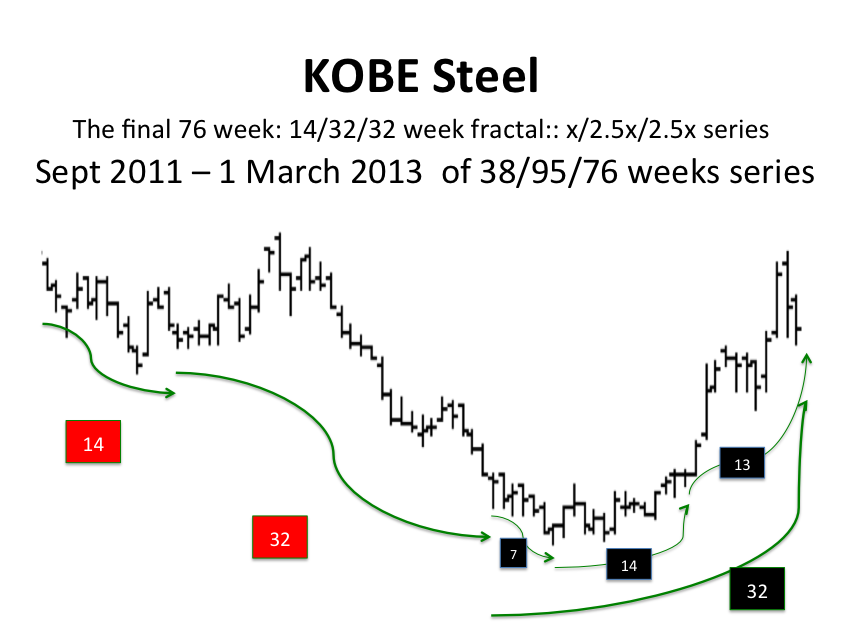


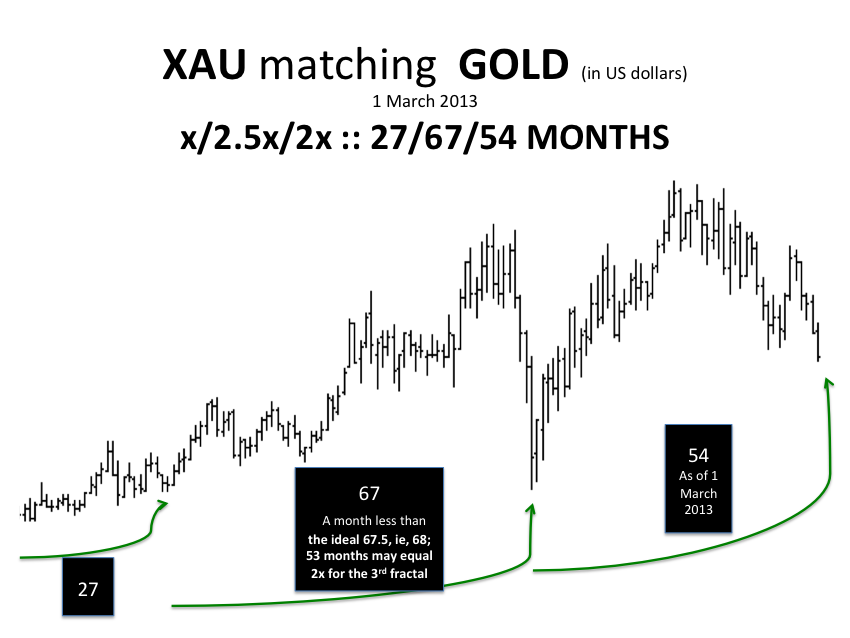
As Gold Goes …. Asset-Debt Macroeconomic System deterministic self assembly deflation and collapse goes… … And the Hegemonic US dollar and Hegemonic US bond futures go oppositely in valuation ascent. But gold is but one of many asset carts and the Asset Debt macroeconomic system is the horse.
