The Quantitative History of American Macroeconomics: The Greatest Ever Asset-Debt Macroeconomic Quantitative Collapse :: The Terminal 51/113/103 Day :: x/2-2.5x/2x Growth Fractal
Nonlinear Asset Valuation Collapse…
Starting near the time of the endorsement of the US constitution, it is the current and contemporary time frame of January 2020, that is the historical time frame of the quantitative asset peak valuation and the terminal portion of the 90 year Third Great Fractal cycle of the Great US Hegemonic Fractal Growth Cycle – ending in a classic maximally extended x/2.5x/2.5x of x/2.5x/2.5x/1.5x :: 36/90/90/54 year pattern.
Since its inception, US (and prior hegemonic and global) periodic job growth is synergistically associated with large expansions of credit and debt-based growth on that job expansion which causes further job expansion causing further credit expansion until a saturation area of asset production and relative overvaluation is reached.
It is the observational theory of this web site that this known qualitative cyclical process is a time dependent (dt) and easily recognizable quantitative process.
The system’s assets’s valuations turn negative when the acceleration dt/dt of debt expansion of the base population slows to zero. The system then undergoes nonlinear asset valuation collapse and devaluation as bad debt undergoes default and debt based assets are ‘revalued’ and repossessed at a lower valuation and placed on an oversupplied market relative to reduced jobs and nonlinearly contracted available credit.
Starting about 1790 and ending in 1807-08 , an 18 year ‘initiating US fractal’ for a hegemonic three phase fractal cycle of debt dependent asset growth and terminal collapse was completed.
This 18 year (1/2x) initiating fractal cycle generated a x/2.5x/2.5x cycle of 36/90 and currently 89 years with respective cycle ends in 1842-43, 1932 and a projected end in 2020-2021 for a 36/90/89-90 year three phase fractal cycle.
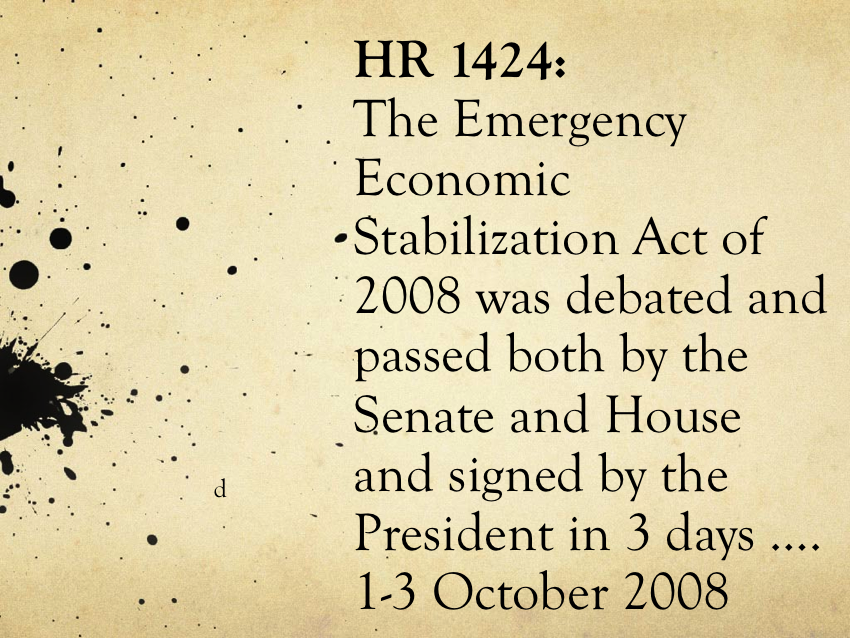
The final cycle after 2020-21 is expected to be about 54 years. This will be a revealing and educational cycle globally as it will become evident that current debt and future social debt obligations cannot be mathematically paid for by future inflationary economic expansion by its base population as it has been in the past 235 years of growth cycles. The only forced option is sovereign money printing to pay for the accumulated debt and past social contract promises. This option has as its 2008 precedent in HR 1424.
Since the 1932 global Great 2nd fractal low, there have been two easily recognizable three phase fractal series:
- a 50 year three phase cycle of 10+/21/21 years :: x/2x/2x ending in 1982 and
- and 39 year three phase cycle of 9/20/11 of 11-12 years expected to nadir in 2020 to 2021.
The 89-90 year Great US Third Fractal’s short 2009 terminal third fractal series of 11-12 years matches the ending of 12 year third fractal from 1921 to 1932 which ended the 1842-43 to 1932 90 year Great Second US Fractal.
The 2009 three phase fractal series is a 31/53/currently 48 month cycle
The third final 48 month fractal current is a 11/26/currently 14 month sequence.
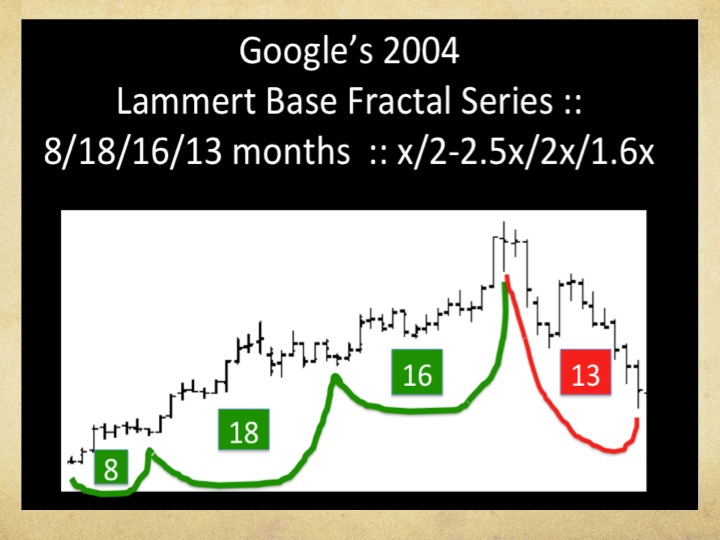
The 14 month sequence is composed of 51/113/currently 103 days or x/2-2.5x/2x growth sequence. Collapse is imminent.
Expect a well defined self organized decay fractal over the 14 trading days of historical devaluation possibly a 4/8/6 day devolution.
The fractal pattern of summation commodity valuations, i.e., CRB is well aligned with that the US equities. Just as the CRB index collapsed in parallel with global equity valuations in 2008-2009, expect a similar sharp decay pattern but over the next 14 trading days.