November 30, 2022. 4 trading days to the 6 December 2022 nadir.
What happens when 20-30 billion dollars of valuation disappear from an asset valuation such as FTX over a few days or 2.2 trillion dollars disappear over a year from the total crypto valuation? All individual asset entities’ (including debt) valuations are supported by the composite sum of the macroeconomic system’s total valuation. When the system experiences a lengthy time period of excessive leverage – promoted by low or negative sovereign interest rates, outright digital and/or paper money creation, or facilitated lending programs – the composite supporting debt and money in circulation grows larger and larger, supporting higher and higher individual asset valuations. If credit tightening then occurs, asset valuations will decrease. Because there is debt, especially margin debt, during the deleveraging process which cannot be repaid, the system is not a zero sum proposition. Nonlinear devaluations can be expected. The QE/debt expansion over the last 12 of13 years for the US has been extraordinary with a US 5 trillion burst in the pandemic covid years; the last 11 month of accelerated QT has been unprecedented. The probability for rapidly cascading nonlinear corporate and private debt default in China and Europe – after 30 years of sovereign central bank nearly-unlimited underwriting of debt creation and asset over-valuation, especially property over-valuation – is 100 percent.
The 1807 36/90/90/54 year 4-phase Great US Fractal cycle.
The 90 year 1932 to 2021 US Third Fractal peak valuation occurred on 8 November 2021.
Equities and Cryptocurrencies: 4 more trading days to the 6 December 2022 Nadir crash devaluation.
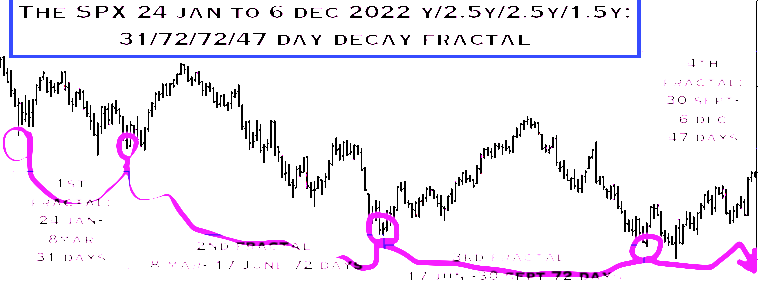
The current monthly western and Japan equity fractal grouping from March 2020 is 8/16/11 of 12 months: y/2y/1.5y. The US 1932 to 2021 90 year Third Fractal peak valuation occurred in the 16 month second fractal of this 8/16/12 month series. The 12 month third fractal of the 8/16/12 month series starts on 24 January 2022 and ends on 6 December 2022 and is composed of a (use the Wilshire) 31/72/73/47 day :: y/2-2.5y/2-2.5y/1.5y 4-phase fractal decay series. The 47 day final decay series is composed of a 30 September 2022 8/18/14/6 of 10 day :: xy/2-2.5xy/2xy/1.5xy decay fractal ending 6 December 2022 (with 14 days the 2xy third fractal growth for an ideal 7 day base with an 18 day second fractal). 7day a week trading cryptocurrencies are following a 1 October 2022 12/28/28 day :: y/2-2.5y/2-2.5y decay fractal pattern ending 6 December 2022.
The CRB: 4 more trading days to the 6 December 2022 Nadir crash devaluation.
The CRB is following an April 2020 27/58/51 of 54 week growth and decay pattern. (With the incipient Covid pandemic, oil valuation became temporarily negative causing the CRB nadir valuation to occur in April 2020 vice March 2020). The 54 week third fractal of the 27/58/54 week fractal series is composed of two subfractal series 4/8/8 weeks and 7/18/11 of 14 weeks for a total of 54 weeks. The final 14 weeks starting 8 September 2022 is composed of a 12/26/24 of 28 day ::y/2-2.5y/2-2.5y decay fractal ending 6 December 2022.
US Debt Inverse growth of the US Ten Year Note
Peak interest rates for US Notes and Bonds likely occurred in mid October 2022 following a March 2020 7/16/11 month :: interest rate fractal growth series of x/2-2.5x/1.5x. The 11 month third growth fractal of the 7/16/11 month series started on 17 December 2021 and is composed of a 11/22/13-15 weeks to peak growth series. The 13-15 week third fractal is past peak interest rate growth and at week 19. The 19 week third fractal of the current 11/22/19 week series is composed of a 1 August 2022 14/33/26/14 of 20 day :: x/2-2.5x/2x/1.5x 4-phase fractal series with an expected low interest rate valuation on 8 December 2022.
Over the next 4-6 trading days money will flow from the selling of equity and commodity will nonlinear lower valuations into the US debt market, driving interest rates on US debt instruments lower.
The asset debt system is a self-assembly, self ordering process the greatest mathematical efficiency and following the macroeconomic system’s simple growth and decay 4-phase and 3-phase laws: xy/2-2.5xy/2-2.5xy/1.5xy and xy/2-2.5xy/1.5-2.5xy, respectively. These self ordering patterns represent the science of the asset debt macroeconomic system.