Both Bitcoin in US Dollars and the Composite Wilshire had averaged daily peak valuations on 8 November 2021 in the 90th year of a 1932 to 2021 90 year US Great Third Fractal, part of an 1807 36/90/90/54 year :: x/2.5x/2.5x/1.5x 4 phase fractal series. As of 14 November 2022 the non-interest bearing Bitcoin has lost 67% of its value and the best dividend paying US Equities’ composite represented by the DJIA have lost 9 percent.
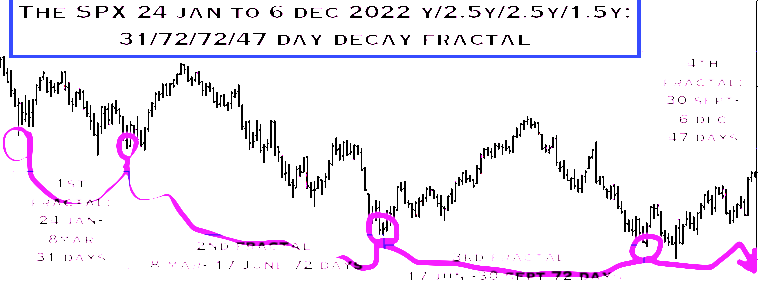
The 24 January 2022 to 6 Dec y/2.5y/2.5y/1.5y SPX Decay Fractal Series
First Fractal: 24 Jan – 8 March 31 days (y)
Second Fractal: l 8 March – 17 Jun. 72 days. (2y-2.5y)
Third Fractal: 17 June – 30 Sept. 73 days (2y-2.5y)
Fourth Fractal: 30 June – 6 Dec 47 days (1.5y)
The 6 December 2022 expected US Equity composite nadir valuations matches an expected 6 December nadir valuation for gold in USD; cryptocurrencies in USD; the CRB inde; European, Japanese, and Chinese composite equities; and the Chinese property indices and Chinese banking equities.
It is hypothesis of this web-site that the asset-debt macroeconomic system is a highly self-ordering self assembly quantitative system whose asset valuations grow and decay in precise fractal time lengths with changes in growth and decay based on selling and buying saturation under controlling interest rates and lending conditions.
The Efficient Market Saturation Time-based Trading to Peak and Nadir Valuation Theory of Quantitative Fractal Valuation progression:
The central banks expand and contract available system debt and money and lending parameters to sustain the asset-debt macroeconomic system with the bank’s defined boundary conditions of 1. unacceptable unemployment vice 2. unacceptable consumer inflation (and likely unacceptable consumer asset devaluation). The asset-debt macroeconomic system then integrates the central bank’s manipulation of credit/money expansion/contraction via interest rates and broader measures of QE/QT and self-orders and self-assembles asset valuations into the most efficient time-based mathematical trading saturation growth-to-peak valuation fractals, and trading saturation decay-to-nadir valuation fractals. Within major valuation growth trends there is periodic countertrend decay and vice-versa. These time-based saturation trading valuation fractals are seen on minutely, hourly, daily, weekly, monthly, and yearly unit scales.
2. Two simple self-ordering asset valuation time-based fractal patterns represent the most efficient pathways to trading saturation peak valuations and nadir valuations. These recurrent fractals pathways confer upon the complex macroeconomic asset-debt system the characteristics of a patterned science. The two time-based fractal patterns are:
An ‘A’ type 4-phase fractal series : xy/2-2.5xy/2-2.5xy/1.5xy (the fourth subfractal unit ranges from 1.4xy to 1.6xy) (The term xy is used to indicate both possible valuation growth or decay)
First xy subfractal unit: the time length is defined by nadir to nadir point time trading saturation valuations
Second 2-2.5xy subfractal unit: time length defined by nadir to nadir trading saturation valuations with a nonlinear lower low valuation drop occurring between the 2xy to 2.5xy time frame to a second fractal nadir valuation
Third 2-2.5xy subfractal unit: time length defined by the above concluding Second subfractal point time nadir valuation to a final lower high peak valuation trading saturation. (In the current 24 Jan 2022 predominant 4 phase decay series, the lower high valuation may be followed by a final third fractal low valuation.
Fourth 1.5xy subfractal unit: time length defined by point time third subunit lower high peak valuation (or in a predominant decay series the third fractal nadir point to the point time nadir trading saturation valuation of the forth subfractal
and
a ‘B’ type 3-phase fractal series: xy/2-2.5xy/1.5-2.5xy.
The first, second, and third subfractal units of the 3-phase fractal pattern are all defined by the time length defined by nadir to nadir point time trading saturation valuations
Observational Empirical examples of ‘A’, the 4-phase series
Yearly Fractal units: Both the Wilshire and Bitcoin in USD reached a daily average high valuation on 8 November 2021. These high valuations occurred in the 90th year of a US 1807 36/90/90/54 year fractal series with valuations lows in 1842-43, 1932, and an expected low in 2074.