16 August 2012:
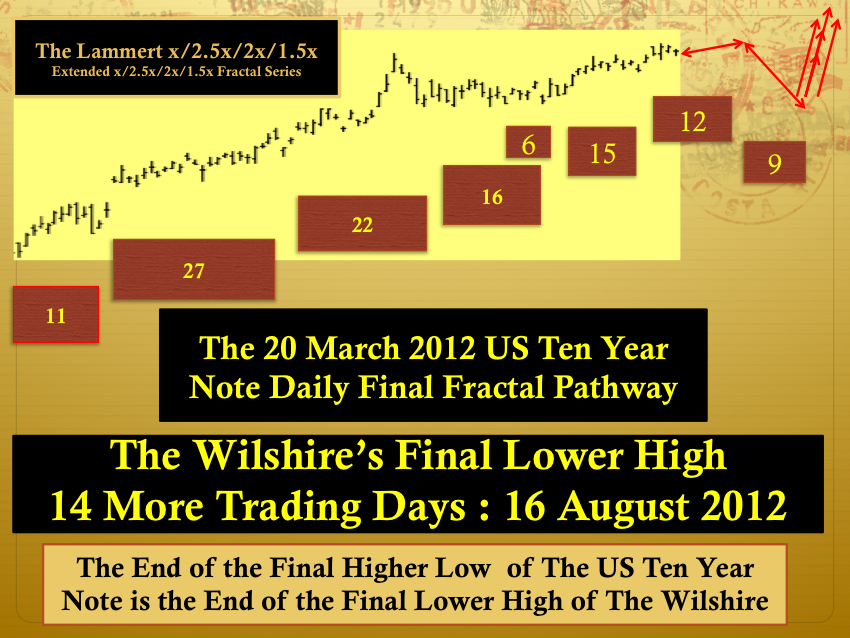
The Terminal Wilshire Lower High based on US Ten Year Note Lammert Deterministic Growth And Decay Fractal Progression.
Monthly Archives: July 2012
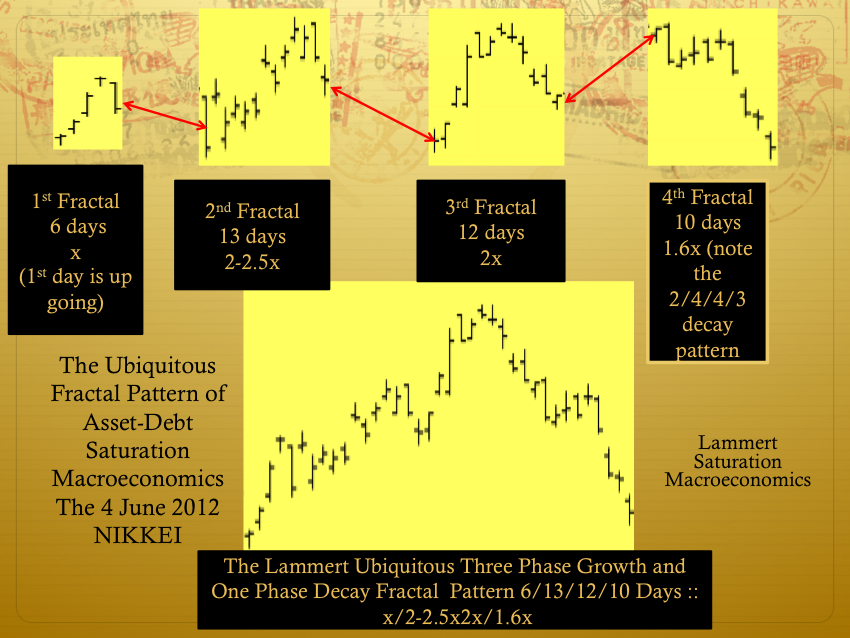
This IS the Macroeconomic System’s Ubiquitous Self Assembly Growth and Decay Fractal Pattern: The 4 June – 25 July 2012 Nikkei
As predicted for the Nikkei in the previous post
….. and earlier in 2005 in the Main Page of The Economic Fractalist:
“The ideal growth fractal time sequence is X, 2.5X, 2X and 1.5-1.6X. The first two cycles include a saturation transitional point and decay process in the terminal portion of the cycles. A sudden nonlinear drop in the last 0.5x time period of the 2.5X is the hallmark of a second cycle and characterizes this most recognizable cycle. After the nonlinear gap drop, the third cycle begins. This means that the second cycle can last anywhere in length from 2x to 2.5x. The third cycle 2X is primarily a growth cycle with a lower saturation point and decay process followed by a higher saturation point. The last 1.5-1.6X cycle is primarily a decay cycle interrupted with a mid area growth period. Near ideal fractal cycles can be seen in the trading valuations of many commodities and individual stocks. Most of the cycles are caricatures of the ideal and conform to Gompertz mathematical type saturation and decay curves. ‘
The US 30 year Bond: The Hegemonic Countervailing Asset of the Debt-Asset Self Organizing Macroeconomic System
A US 30 Year Bond 3 June 2012 11/27 of 27-28/1 of 17-27 day x/2.5/1.6-2.5x deteriorating inverse growth fractal.
Note the Nikkei completed a potential 6/13/12/10 day :: x/2-2.5x/2x/1.6x Lammert four phase growth and decay fractal series on 25 July 2012 . This is the first of a two subfractal series composing the third fractal series of a three phase fractal growth sequence starting on 25 November 2011. Observe the weakness of Nikkei’s valuation representative of an extremely debt burden sovereign system equity composite.


