The Self-Assembly US 1807 36/90/90/54 Year Fractal Cycle: The Great November 2022 Nonlinear Global Equity and Commodity Crash. (6 November 2022 Update)

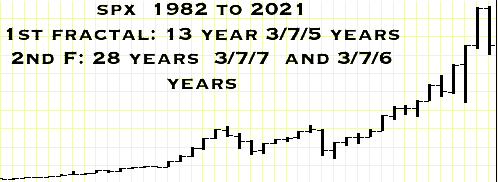
The third 90 year US Great Fractal spanning from 1932 to 2021 was composed of two fractal sub=series: 11/21/21 years ending in 1982 and a 40 year 13/28 year series peaking in November 2021. (See below)The 13 year first sub-fractal was composed of 3/7/5 years and the 28 year second sub-fractal composed of two sub-fractals: 3/7/7 years ending in a 2008 low year and a 3/7/6 years peaking in 2021, the 90th year of the US 36/90/90 year ::x/2.5x/2.5x maximal growth series.

Since October 2008, US equity market valuations have been fueled by trillions of dollars of too big to fail toxic asset bipartisan federal underwriting, QE programs, near zero fed fund rates, negative interest rate European bonds, massive covid paycheck underwriting, low interest rate mortgage backed securities, and lowered corporate tax rates facilitating massive corporate stock buy backs.

Against a late -2008 fueled and fed/politician created super bubble of equity and housing over- valuations is an 11 month accelerated Fed QT and interest rate increase program of 400 percent, from about 0.1 percent to 4%, instituted to combat the 40 year high consumer inflation created by the Fed’s QE program.

Even without the QT program, a nonlinear 13/28 year x/2-2.5x second fractal devaluation was expected. With the Fed’s unprecedented tightening, the nonlinearity will be more profound.

The SPX is following a March 2020 8/16/11 of 11 month decay fractal series which matches the timing of a Wilshire peak November 2021 3/6/6 month decay fractal.

From 24 January 2022 the SPX is following a 31/72/62/43-44 day 4-phase decay series or y/2-2.5y/2x/1.5y (where x = y in time units: x growth; y decay)

(The ideal base of a 72 day second fractal is 29 days; 1.5 times 29 = 43.5 days)

The daily 31/72/62/43-44 day final series exactly matches the description in the 2005 main webpage of a x/2-2.5x/2x/1.5x fractal series. “The ideal growth fractal time sequence is X, 2.5X, 2X and 1.5-1.6X. The first two cycles include a saturation transitional point and decay process in the terminal portion of the cycles. A sudden nonlinear drop in the last 0.5x time period of the 2.5X is the hallmark of a second cycle and characterizes this most recognizable cycle. After the nonlinear gap drop, the third cycle begins. This means that the second cycle can last anywhere in length from 2x to 2.5x. The third cycle 2X is primarily a growth cycle with a lower saturation point and decay process followed by a higher saturation point. The last 1.5-1.6X cycle is primarily a decay cycle interrupted with a mid area growth period. Near ideal fractal cycles can be seen in the trading valuations of many commodities and individual stocks. Most of the cycles are caricatures of the ideal and conform to Gompertz mathematical type saturation and decay curves.  

 G. Lammert

The 43-44 day 4th fractal starting on 15 September 2022 is composed of a 7/15/14/10-11 day series ending on Monday 14 November or Tuesday 15 November 2022, assuming no delays because of trading halts. The final 10-11 days starting on 1 November 2022 is composed of a 2/5/5 day or a 2/5/4/3 day decay fractal series.

A historical and great 1982 13/29 year second fractal crash is expected over the next 6-7 trading day equivalents.

Below is the weekly 24 January 2022 series of 7/15/14/10 weeks showing the nonlinear lower valuation gap between the 14 and 15 week of the 15 week second fractal.

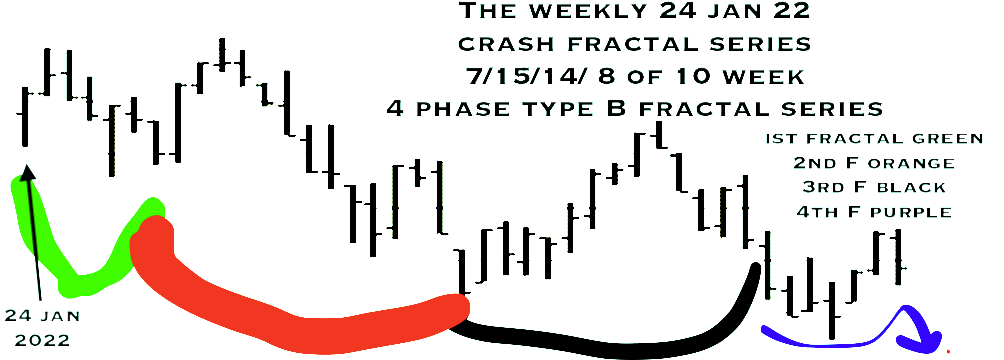
The final 10 weeks is composed of a 2/4/4/3 week fractal series.

The Self-Ordering Asset-Debt Macroeconomic System: The Great November 2022 Crash Devaluation: The Russell 2000’s Oct 23, 2022 6/15/12/9 day :: x/2.5x/2x/1.5y Finale Crash Fractal Series

Why is the Russel 2000 a useful composite to follow? The Russel is useful because it represent the weakest index composed of heavily indebted companies (debt up to 50 times assets) who must roll over massive existing debt and borrow new debt with a fed fund rate of 3.75- 4 percent, a rate that was less than 0.1% one year ago. Below is a graph of the Russell 2000 in weekly time units dating from 24 January 2022, the beginning of the the third 11 month fractal of the current March 2020 8/17/11 month series. (8/16/11 months for the Wilshire). The terminus of the 11 months will conclude a 31-32/68/68 monthly series starting with ending monthly low in February 2009 or the absolute low in March 2009. (See previous posting.) The terminus also concludes an interpolated 1982 first and second fractal series of 13/29 years. Contained within the 1982 first and second fractal series is the 8 November 2021 Wilshire and Bitcoin in USD peak valuation occurring in 90th year of the third 90 year fractal of a US 1807 36/90/90/54 fractal series.

The above graph depict a x/2-2.5xy/2x/1.5y :: 7/15/14/8 of 10 week fractal series. The green 1st fractal is composed of a 2/4/3 week series. The 2nd orange fractal is composed of a 3/8/6 week series. The third black and 4th purple fractal series is composed a 5/10/10 weeks of which the 4th purple fractal is composed of a 2/4/4/expected 3 week series. Notice the nonlinear lower valuation gap between week 14 and 15 of the orange underlined 2nd 15 week fractal. The nonlinear gap between 2x and 2.5x characterizes second fractals as described in the 2005 original website main page. The daily fractal series correlating to the weekly series is 31/71/64/expected 44 days. The 64 days of the third 14 week fractal underlined I black is composed of a 19/46 day with a nonlinear gap observable on the daily charts between day 45 and 46 of the 46 day second fractal. The final expected 44 day fractal starting 16 September 2022 is composed of an interpolated 8(2/4/4 downgoing )/18/20 day fractal series. Interpolated mathematical fractal series like the individual nation-state economies making up the global asset-debt system are elegantly interlocking. A 39 day fractal series starts on 23 October 2022 and is composed of a 6/15/12/9 day fractal series with an expected low on 16 November 2022 barring trading halts.

Review of the Asset-Debt systems two fractal growth and decay mathematical patterns:

 An ‘A’ type 4-phase fractal series : xy/2-2.5xy/2-2.5xy/1.5xy (the fourth subfractal unit ranges from 1.4xy to 1.6xy)

First xy subfractal unit: time length defined by nadir to nadir  point time  trading saturation valuations

Second 2-2.5xy subfractal unit: time length defined  by nadir to point time nadir trading saturation valuation with a nonlinear lower low drop occurring between the 2x to 2.5x time frame

Third 2-2.5xy subfractal unit: time length  defined by concluding Second subfractal point time nadir valuation to final point time peak valuation trading saturation

Fourth 1.5xy subfractal unittime length defined by point time  third subunit peak valuation  to point time nadir trading saturation valuation

and 

‘B’ type 3-phase fractal series: xy/2-2.5xy/1.5-2.5xy.  

The first, second, and third subfractal units of the 3-phase fractal pattern are all defined by the time length defined by nadir to nadir  point time  trading saturation valuations

This Time It’s Different: The Great November 2022 Global Crash Devaluation

Why the Great Nonlinear 2022 Crash? 

While not 1929 and not 2008, this crash does represent great nonlinearity within the US 1807: 36/90/90/54 year asset-debt macroeconomic cycle. This  historical super bubble asset valuation was inflated since 2020 via unprecedented world central bank covid related money printing, low to negative interest rates, and facilitated money lending programs.  With resulting consumer inflation at 40 year highs, the bubble is being given the largest of needle pricks   via an 220 year unprecedented acceleration of central bank money tightening and sharply rising interest rates. This time it is really different. A historical nonlinear devaluation of global assets is expected to be representative of that difference. 

From the 90 year 1932-2021 Third Fractal  November 2021 Wilshire/Bitcoin high: 
the simplest mathematical y/2y/2y monthly decay fractal series is this:  3/6/6 months (with lower or higher low valuation at 3/6/6/4 months – likely higher with an earlier central bank QT to QE pivot than anticipated).

Composite Equity Valuations 2009 To Present:

1st fractal: From the ending Feb 2009 monthly low: 6/14/14 months:  32 months

2nd fractal 15/35(8/17/12)/20(6/15) months = 68 months
Terminal Valuation distortions caused by Brexit world banks’ large QE/lowered interest rates …

3rd fractal using a 15 (3/7/7) month upgoing base of the (6/15) month terminal 2nd fractal : (15)//36 (7/15/16)//33 (7/17/11)  = 68 months (with lower or higher low at month 71 (15)/36/36 months.

The final 11 months of the 7/17/11 month fractal are composed of:

7/15/13/10 weeks or
31/71/60/43-44 days (with an ideal base for a 71 day second fractal of 28+ days)

The final 43-44 day decay fractal is composed of two sub fractal decay series: 2/4/4/3 days and 5/12/13/7-8 days ending Wednesday or Thursday 9/10 November 2022 with a potential longer daily time frame because of  trading halts. A potential low of 14470 to 15370 is possible for the Wilshire.

Final 7-8 day 4th fractal decay series:
From the 1 November 2022 3rd fractal 13 day (key reversal day)  (5/12/13 day) high : 2/4/3 to 4 days for a 5/1213/7-8 day series.

The daily timing of the crash of the composite US (and European, and Japanese) equity crash and cryptocurrency crash coincides with the Chinese property, banking, and composite equity crash.