The Nikkei, Gold, and US Hegemonic Ten Year Futures
Towards a Naturally Progressing Deterministic Quantitively Understandable Global Asset-Debt Macroeconomic System
In the last posting, a qualitative explanation was provided to understand the current time window of the self assembly global macroeconomic system. The disparity between the rate of US debt creation and the rate of GDP increase to service the debt was reviewed. From 1980 to 2012 US GDP increased from 2.4 to 15.5 trillion dollars about 650%, while total debt increased from 4.8 to 55 trillion or 1200%.
About 1/4 of the US total 200T asset worth is debt: 55T. Debt as an asset provides the countervailing counterbalancing linkage to the entire system. Too much debt via leverage or low interest can be produced. Asset can be overproduced and overvalued based o debt leverage and interest rates. If the system does not produce jobs and earnings at its base debt will undergo default, the collateral asset will be assumed by the owner of the debt, placed on the market and, in saturated asset overproduced environment, a resulting lower valuation. If there is no real collateral, college loans and asset derivatives, the owner the debt may receive nothing from the counterparty.
In this counterbalancing manner,the Asset-Debt Macroeconomic System proceeds in a highly organized mathematical self-correcting progression.
With the US dollar as the world’s reserve currency, 55 trillion of debt against a 15.5 T dollar GDP economy, a smaller work force, and less demand, the system’s will create lower interest rates, which will further deplete the able debtor citizen population.
Even in the 1930’s depression US interest rates have never been this low. This level of low interest rates are an anomaly in terms of the 225 year of the US economic activity but are an expected nonlinear part of the patterned Science of Asset-Debt Saturation Macroeconomics.
And the Asset-Debt System ‘requires’ that US interest rates go lower -much lower. This is the time area of a US 1858 Second Fractal Asset-Debt Macroeconomic System Collapse.
The Nikkei, Gold, and US Ten Year Note Fractals:
Remembering that this is a global one quadrillion total wealth asset-debt Macroeconomic system, the combined worth of the three assets element below represent less than 2.5 percent of the global total asset-debt wealth.
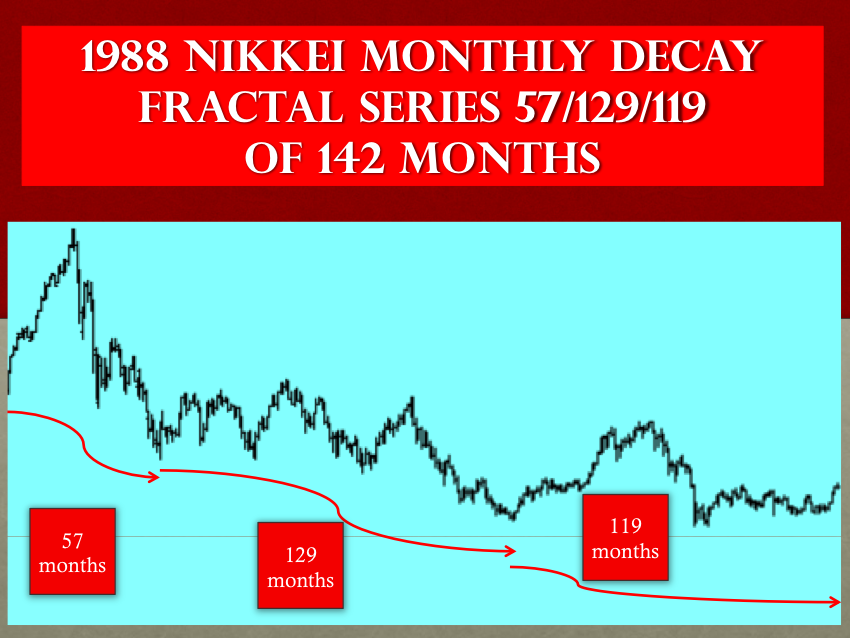
The NIKKEI: The Nikkei peaked on 29 December 1989 at 38957. On 6 February 2013 it reach a 4 year new peak valuation of 11498, about 27 percent of 23 year earlier peak. Euphoria abounds.
The 1988 Nikkei y/2-2.5y/2-2.5y :: 57/129/119 of 143 Monthly Decay Pattern
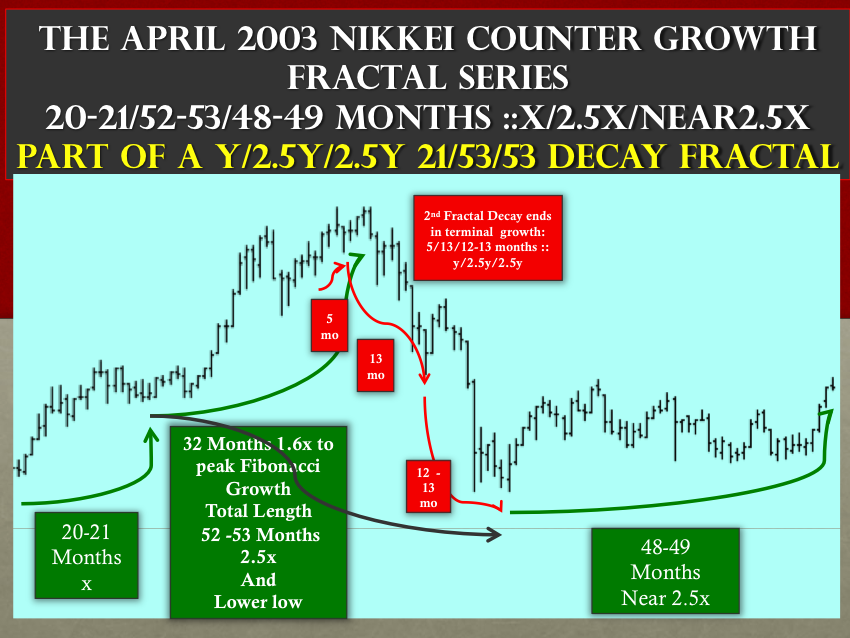
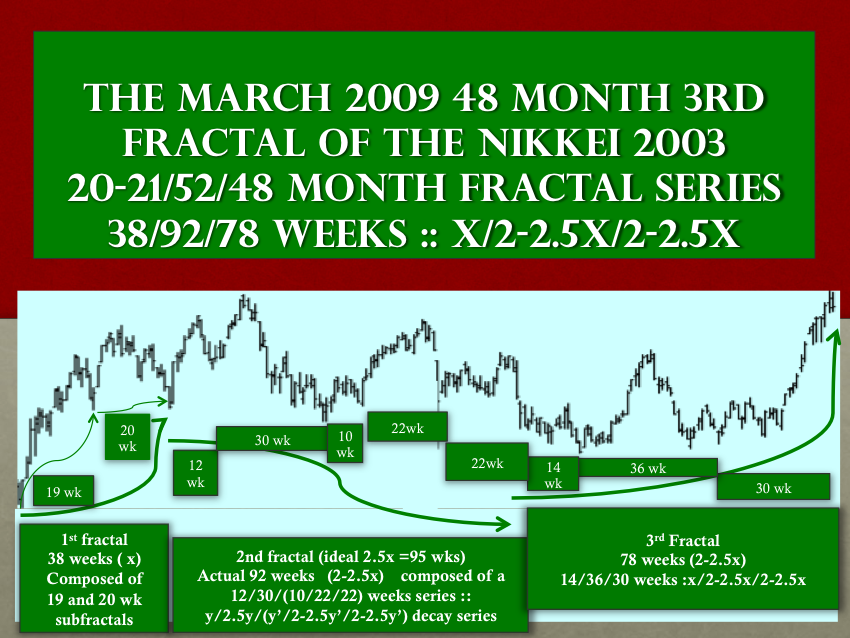
The 2003 Nikkei: x/2.5x/2-2.5x :: 21/52/48 months or 119 months within the 1988 3rd fractal 2-2.5y 114-143 month Decay Pattern.
GOLD: The internet bubble’s mid and late 90’s perturbation on the 1932 to 2013 Gold Valued in US dollar’s Quantum Saturation Curve Pattern
1993 to Feb 2013 Gold: 45/103/93 month : curvilinear blow-off fractal. The competing internet bubble sucked speculative dollars from the gold market; the internet malinvestment bubbles’ collapse sucked further speculative dollars with a basing in 2000
Early 1993 first base fractal 7/17/14/10 months or 45 months End of 1996 second fractal 15/38/30/23 months or 103 months curvilinear Mid 2005 third fractal 42/53 months or 94 months
From 1932 Gold’s valuation indollars followed the CRB’s 8/20/10 year pattern. 1960 to 1970 formed Gold’s 10 year base fractal with a 1970 to 1993 (7+/18 year) or 24 year second fractal. The third is composed of the 1993 curvilinear 45/102/94 month or 4/10/8 year or 20 year fractal. The US 1960 to 2013 Gold fractal in US dollars is 10/24/20 years :: x/2.5x/2x.
Even with low interest rates, defaulting debt and collapsing asset prices will cause a drop in gold valued in US dollars to 300-400 dollars.
Against the valuation of gold dominated in dollars, the US dollar has began the steep part of its valuation growth curve against other currencies with its first 42 month base fractal from 2008 to 2011 and the 3/8/6/5 month Lammert: x/2.5x/2x/1.6x 19 month first subfractal of the second fractal growth series completed on 1 February 2013.
An interpolated Gold fractal began at the low in US dollars in 2001 follows a 27/67/53 month Lammert growth pattern :: x/2.5x/2x and representing maximal growth.
US TEN YEAR NOTE FUTURES
During Asset-Debt system global collapse, Ten Year US Notes along with the US dollar will gain in value against other defaulting debt and declining in value lower quality currencies. US interest rates will reach 150 year historical lows.
The US Ten Year Futures have been a conundrum in terms of the last 25 months of a 13/33/25 of 26-33 blow-off. This conundrum has recently been solved showing that the 25 months have occurred in two subfractals with the oppositional and tax advantaged US equities having a favored speculative population with exhaustion of that population at the extreme of the 26 month (2x) US Ten Year Future’s Note Blow-off Third Fractal.


