19- 80 85 90 95 20- 00 05 08 10 12 Total
%5yr delta(D)
debt growth 80 60 40 50 50 25 03
US GDP by 5 year increments in same year dollars(2008 bubble peak included) 1977 to 1985 to 1997 represented doubling of US GDP in same year dollars
Otherwise considered, 1% of the interest on the 50T represents 500 billion. This is about the same amount that the Central Bank’s QE program’s have been lending per year to Congress to continue to fund a non-sequestered, central bank-maintained, asymptotically-saturated asset-debt macroeconomy.
The citizens benefit by continued employment and obviously the elite creditors and owner’s of the 50T of debt benefit by continued payment. Concern for the US Bond rating is identical to the concern of honoring the Elite’s 50T of debt assets.
And otherwise considered, all of the net US tiny 3 percent debt growth from 2008 to 2013 could be attributed to congressional incurred debt and the Central Bank’s exhilo creation on their books of 2.5 trillion dollars and likely other zero sum currency/bond exchanges with other central banks.
Sequestration will not happen because the asset debt system mathematically will not allow the US politicians allow it to happen.
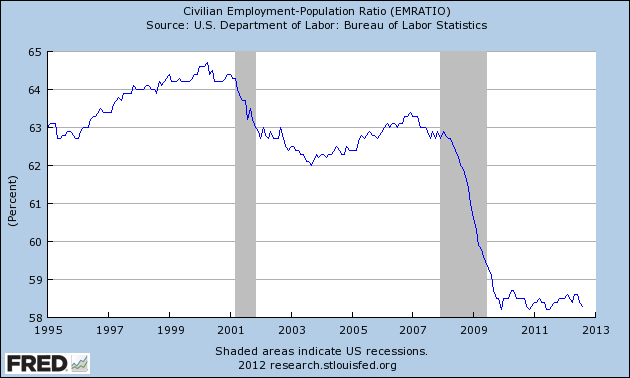
Can the citizen consumer based forward consumption economy grow itself out of this 50 T dollar of system debt – all of which is based ultimately a real citizen consumer economy.
Look at the 1980 numbers the 2008 peak numbers and Q3 2012 numbers of US relative group debt.
1980 2008 Q3 2012
Congressional S/F 1.1 9.3 (9x) 14.3
Citizen
Corporate 1.5 11.5 (8x) 12.1
Financial Industry 0.6 17.1 30x) 13.8
Foreign 0.2 1.7 (9x) 2.3
Who are the counterparties to this debt? Who owns the 55 trillion dollars of obligation? Those who would like continued interest payments on the principal.
Is the math possible for the real citizen based US GDP 15-16T economy to grow itself out of the shadow of the growth of US’s 1980 4.8T total debt, and, in particular, the Financial Industry’s bubble contribution, to the 1150 increase in US total debt to the 2012 55T, while the US economy’s GDP in same year dollars has increased from 4.8T in 1980 by only 600% now at 15.5T in 2012.
And here is the answer, the rub, the paradox, the saturation asymptote of the citizen-based forward consumption Asset-Debt Macroeconomic System ….
… in a forward based citizen consumer economy the only way to grow the economy is to increase the citizen debt load (or congressional debt load) by further borrowing against future earnings.
That consumer borrowing population is simply depleted…
Even with Central Bank QE assistance, the necessary solution to this asset-debt system conundrum is partial debt default and asset devaluation.
Part of the default at some point in the future, will be the erasure, the debt jubilee on the Central Bank’s black box holdings. For those who think the Federal Reserve’s 500 billion per annum QE action will result in inflation, think of the 55 T total debt sink sucking 500 billion, 1 trillion, 1.5T, 2T dollars out of the system each year at 1,2,3 and 4 per cent interest rates.
In the next weeks and months as the asset-debt system mathematically implodes , the above qualitative information may frame a basis for a better understanding about what is happening.
The Pattern Science of The Asset Debt Macroeconomic System
It is, however, in the asset-debt system’s exquisitely precise time based quantum valuation saturation curves of the US composite equity, east and west major nation composite equity, and commodity asset classes and, oppositionally, the countervailing US hegemonic debt futures and yes the rising US dollar where the footprints of Asset-Debt Saturation Macroeconomics can easily be observed demonstrating a highly organized quantum pattern of the system’s weaker assets’ devaluations – as bad debt which can not be mathematically repaid in a consumer job-earnings collateral forward based and asset saturated economy – undergoes necessary and inevitable default.
