There are only two elegantly simple laws of time-based fractal asset-debt macroeconomics:
While money and credit growth (and contraction)by central banks and government spending is periodically irregular, equity and commodity composite valuations grow and decay by only two distinct time-based fractal patterns(mathematical laws): a three phase pattern: composed of three subfractals:1/2/ and 3 :: x/2-2.5x/1.5-2.5x – where x is the base first fractal time length in days, weeks, months, and years.
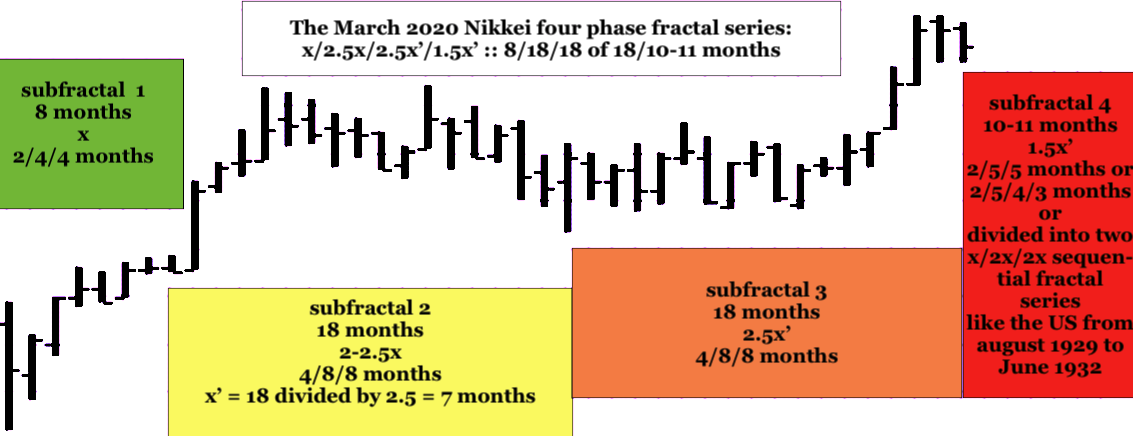
and a four phase pattern: composed of 4 subfractals: 1/2/3/ and 4 :: x/2-2.5x/2-2.5x/1.5-1.6x, where x is the base first fractal time length in days, weeks, months, and years.
The time length of subfractal 2 (2-2.5x) of the 3 and 4 phase fractal series often determines the ideal time length of subfractal 1 : (x’) upon which the lengths of sub-fractals 3 and 4 are based: e.g., the 4 phase fractal pattern’s time lengths become x/(2-2.5x divided by 2.5 = x’)/2-2.5x’/1.5-1.6x’.
China’s fastest growing economy has been based on the world’s largest % GDP corporate debt and money expansion. The Chinese population has placed its saving in domestic real estate whose valuation had steadily and reliably grown for twenty years but crested about 2-3 years ago and is now diminishing in valuation. Building corporations such as Country Garden and Evergrande have lost 90-99 % of their valuations over the last two and a half years. Chinese wages are now decidedly less competitive than other capable emerging countries with shorter and politically less complex supply chain issues. Wages in the Chinese financial sector have been cut by 25-33% resulting in real estate mortgage defaults.
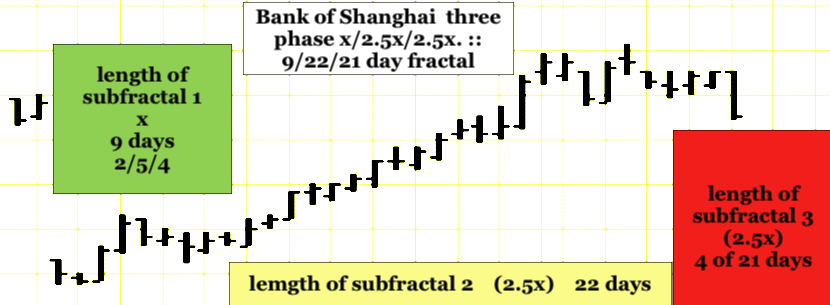
The Bank of Shanghai is the canary in the Chinese asset debt macroeconomic coal mine and is following a 12/2017 three phase 9/20/18 – 23 month x/2-2.5x/2-2.5x fractal series and a sequential three phase fractal series : (5)/13/11 of12 months :: x/2.5x/2.5x and (2)/5/4-5/(3) months with an anticipated nadir low in 10 to 11 months
A daily three phase fractal pattern for the Bank of Shanghai started on 6/27/2023 and follows a 9/22/4 of 21-22 day pattern :: x/2.5x/2.5x ending with an expected nonlinear low in 17-18 trading days.
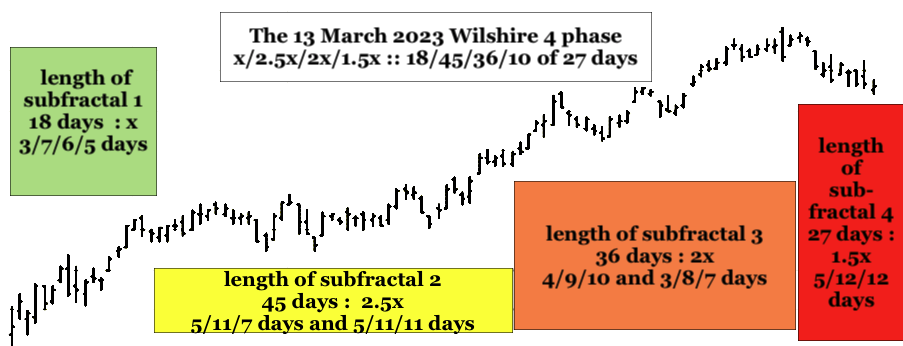
Starting 13 March 2023 the US Wilshire had a 4 phase blow-off fractal series of 18/45/36/10 of 27 days with a peak valuation on 31 July the 36 day 2x of subfractal 3. A nonlinear low is expected in 17 trading days. The decay fractal series starts on 7/ 27/2023 following a 3 phase 5/8 0f 13/13 day :: x/2.5x/2.5x fractal pattern or from the 31 July 2023 peak valuation: 5/6 of 12/12 days :: x/2.5x/2.5x.
US equity valuation decay from its peak in September 1929 to its nadir in June 1932 occurred over 32 months and started in August 1929. Two sequential three phase x/2x/2x fractal decay series of 15/33/30 weeks followed by 16/34/32 weeks are observable and completed the mathematical decay in June 1932 as debt was liquidated and restructured and assets sold at lower and lower prices.
By the law of a four phase fractal, Japan’s March 2020 Nikkei is expected to reach a low in 10 -11 months.