Total global gold market valuation peaked on 29 Jan 2026 at 37.5-38 trillion and is currently valued at 32 trillion. The total global crypto market at peak valuation in Sept/Oct 2025 was 4.36 trillion and is currently valued at 2.7 trillion. With Israel’s initiation of the war on 28 Feb 2026, the global oil and gas market has bucked the declining price trends in gold and crypto markets. The oil and gas market was valued at 6.3 trillion in 2025 and now 8.75 trillion in May 2026 after the Israeli war.
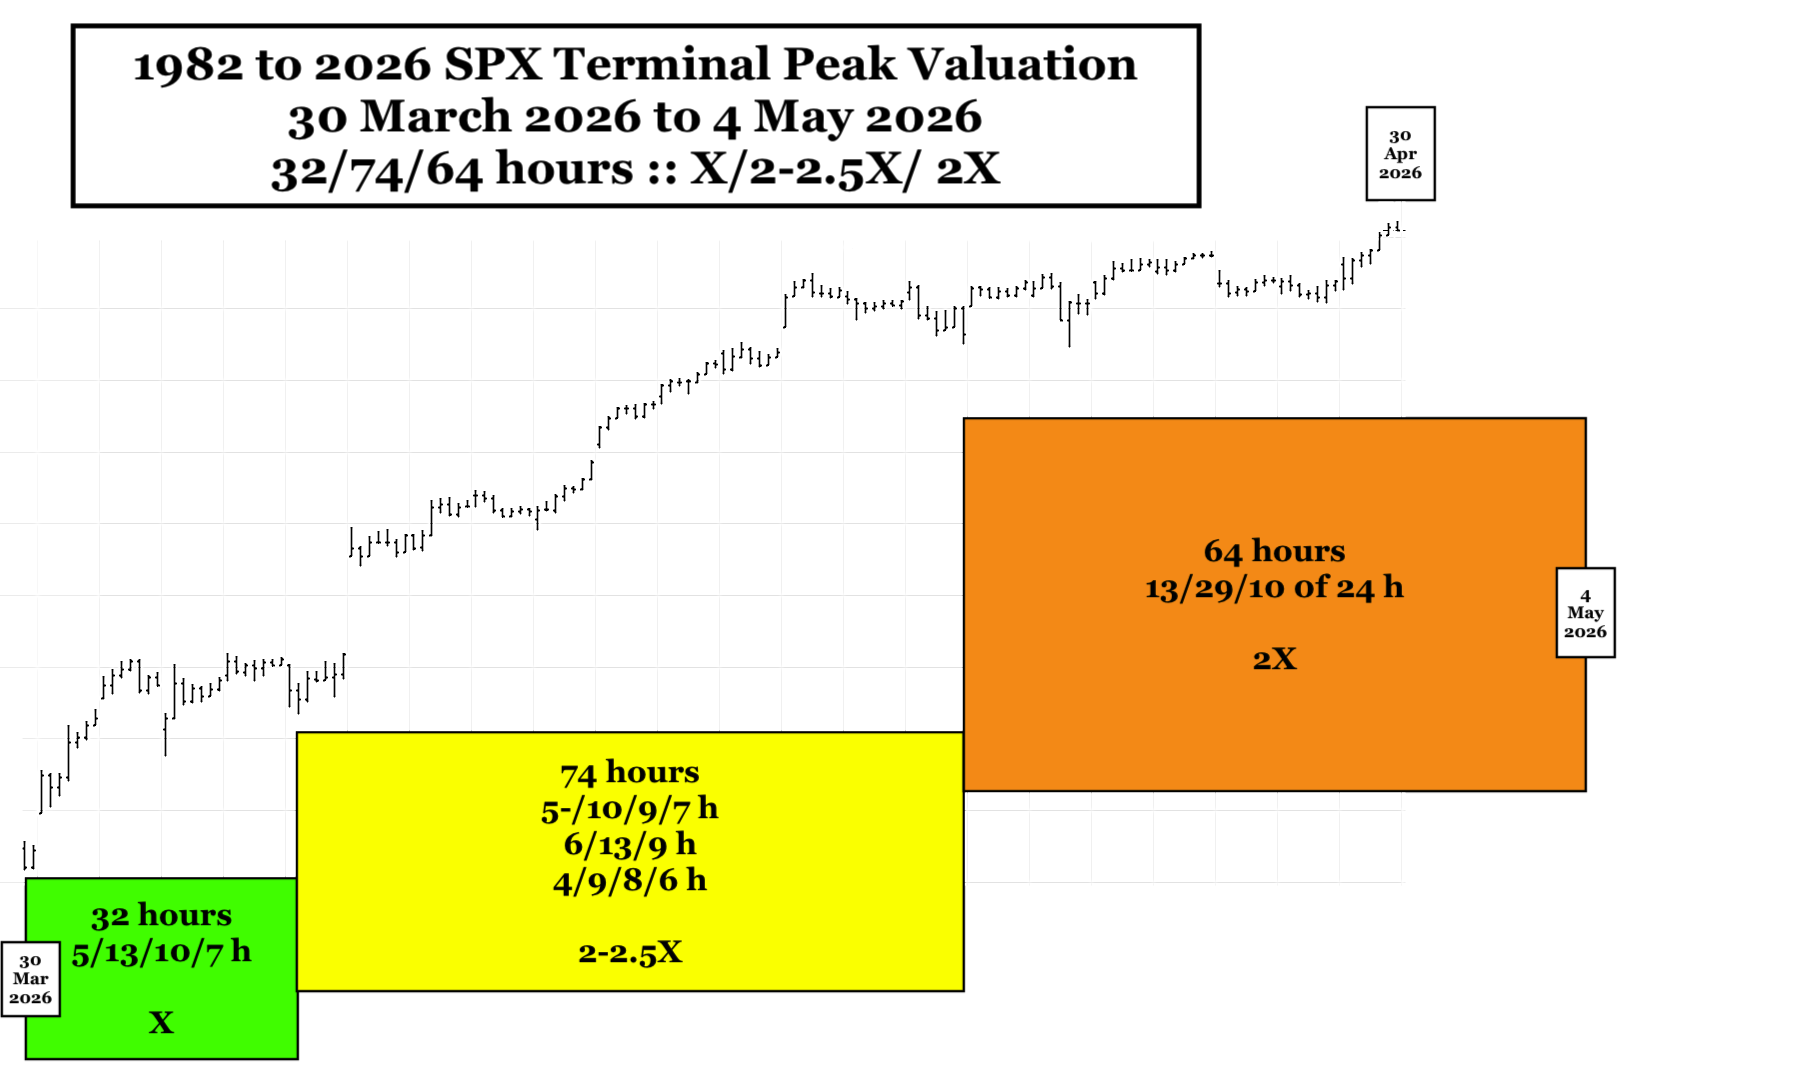
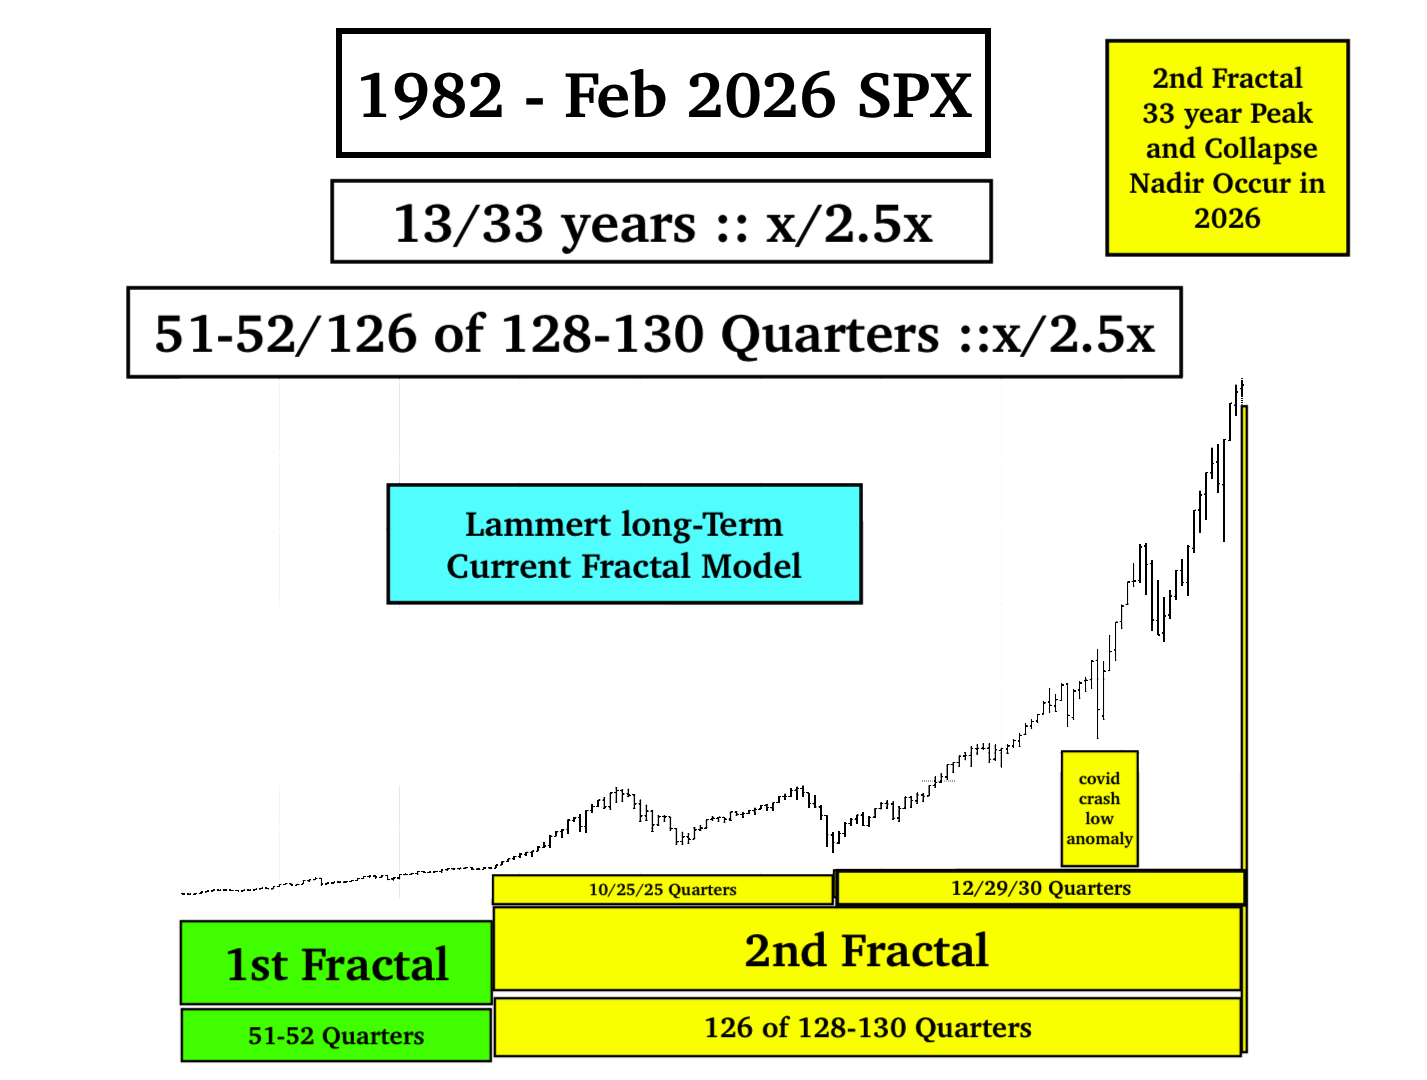
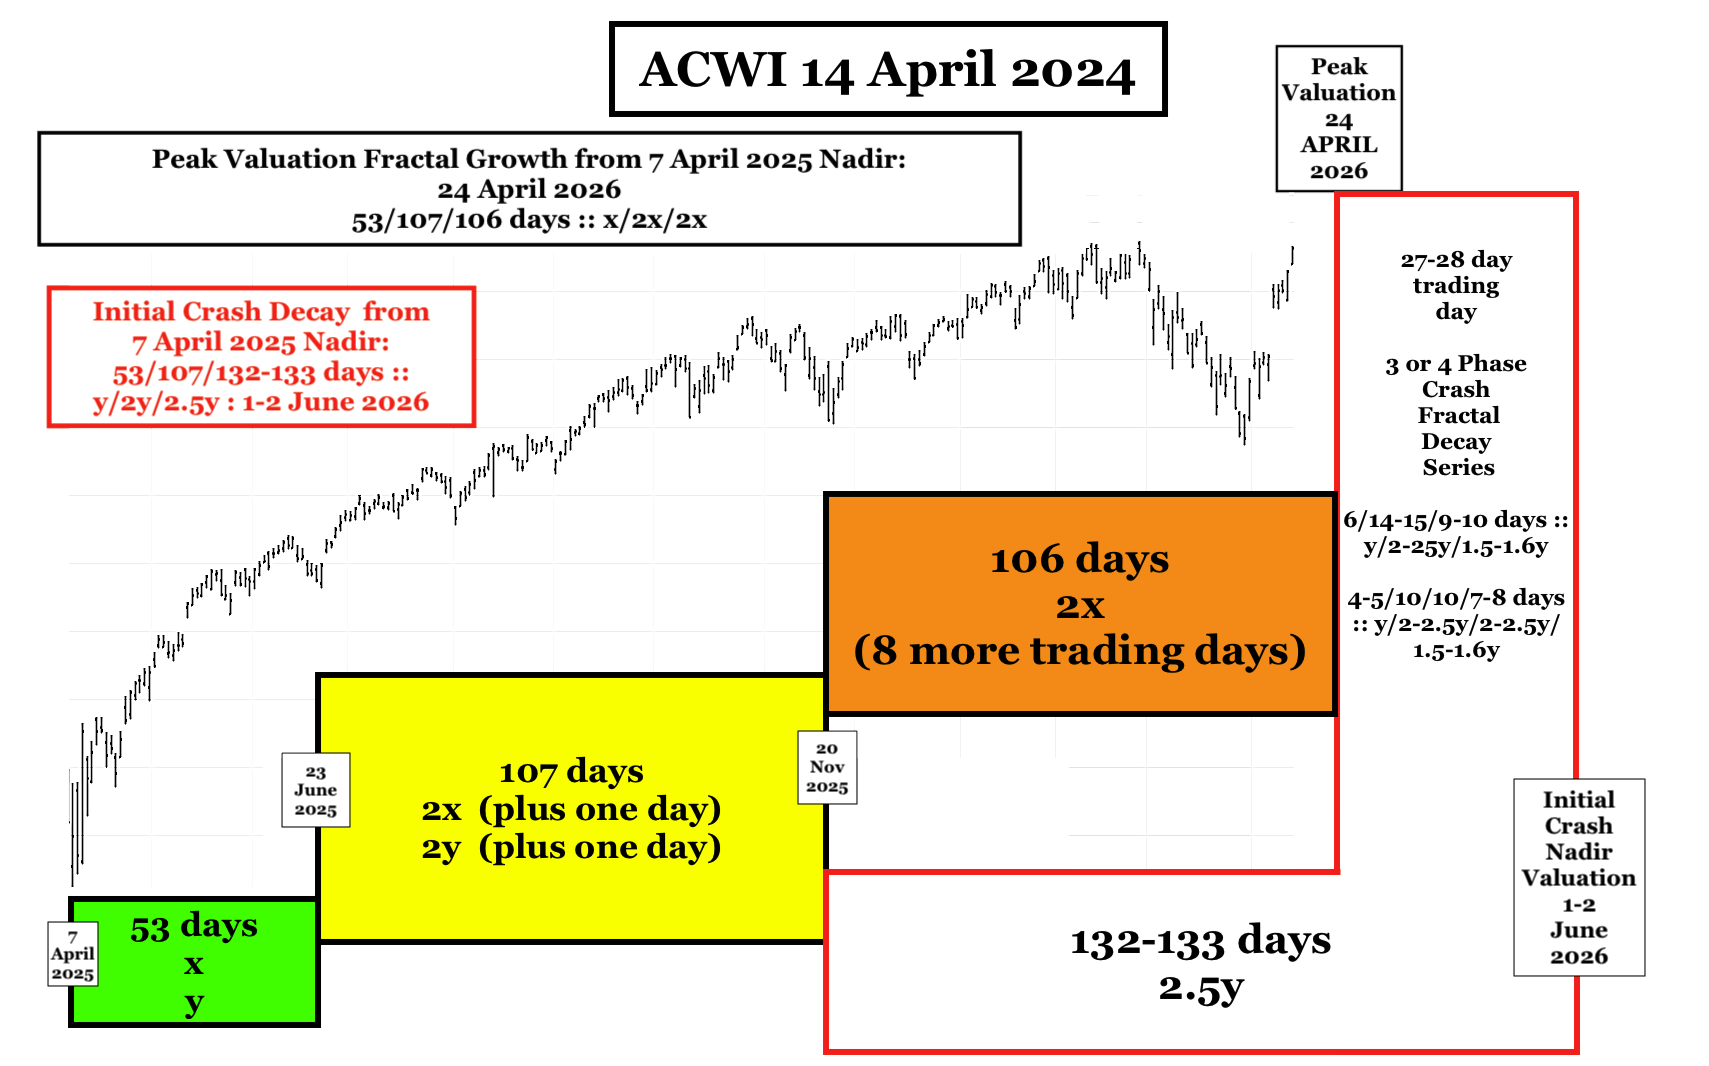
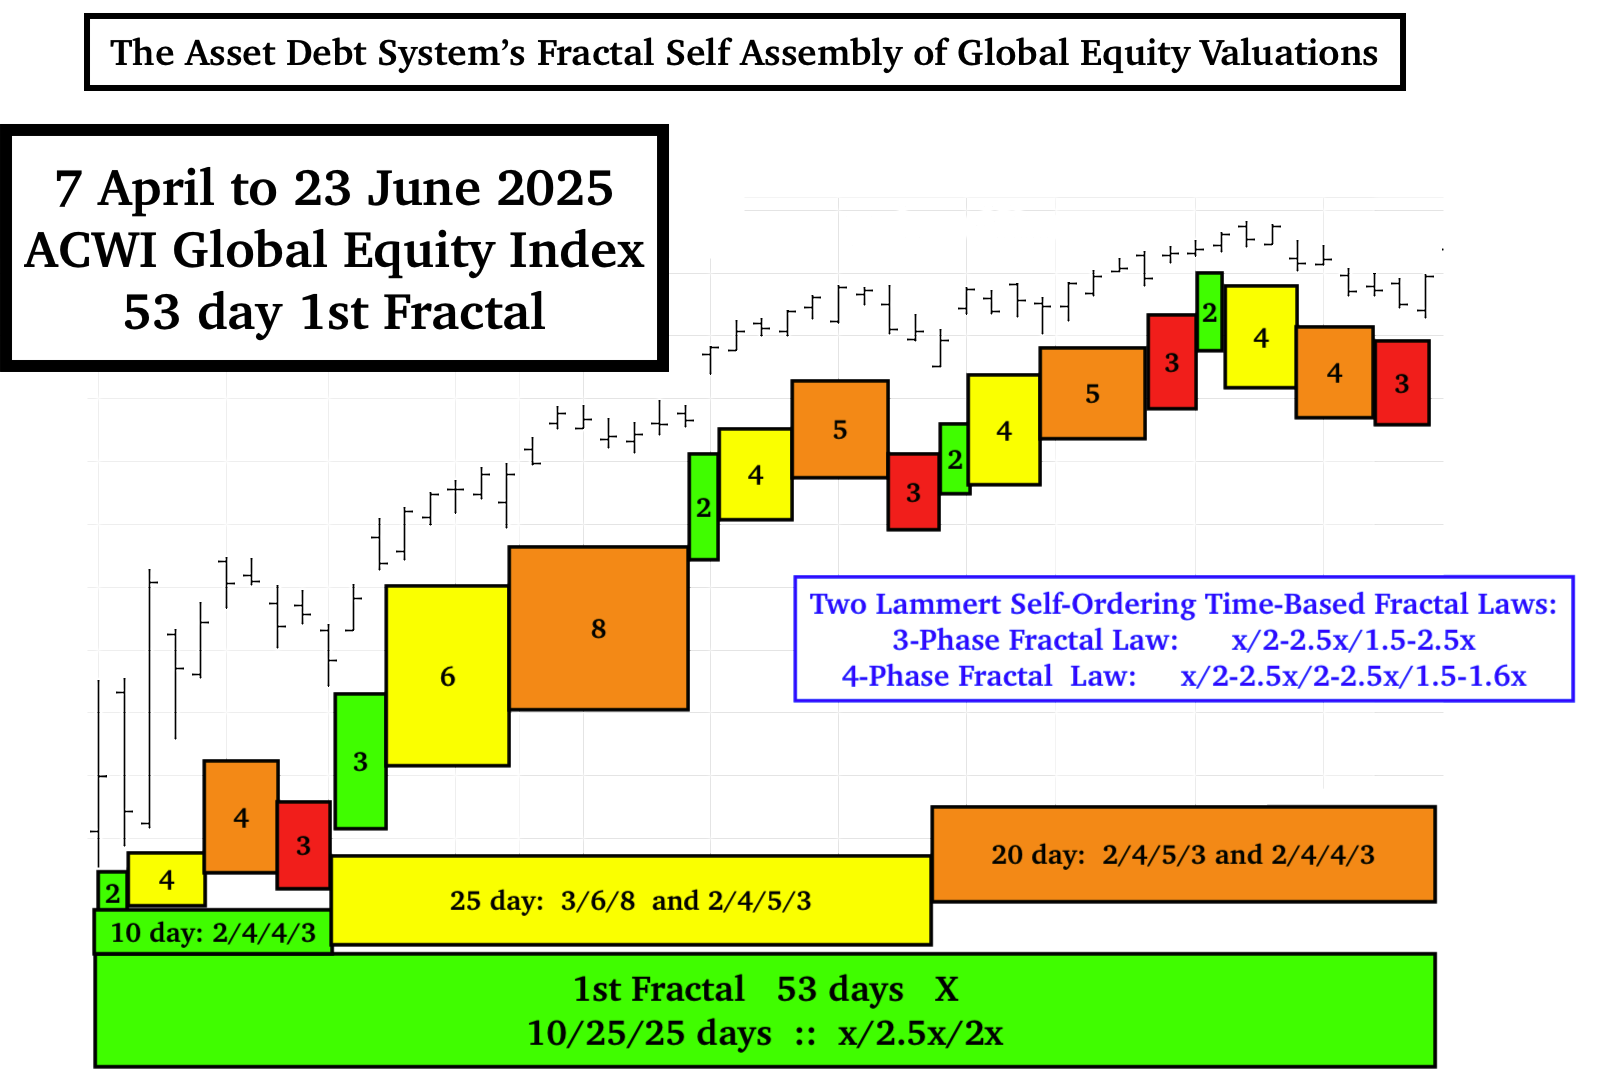
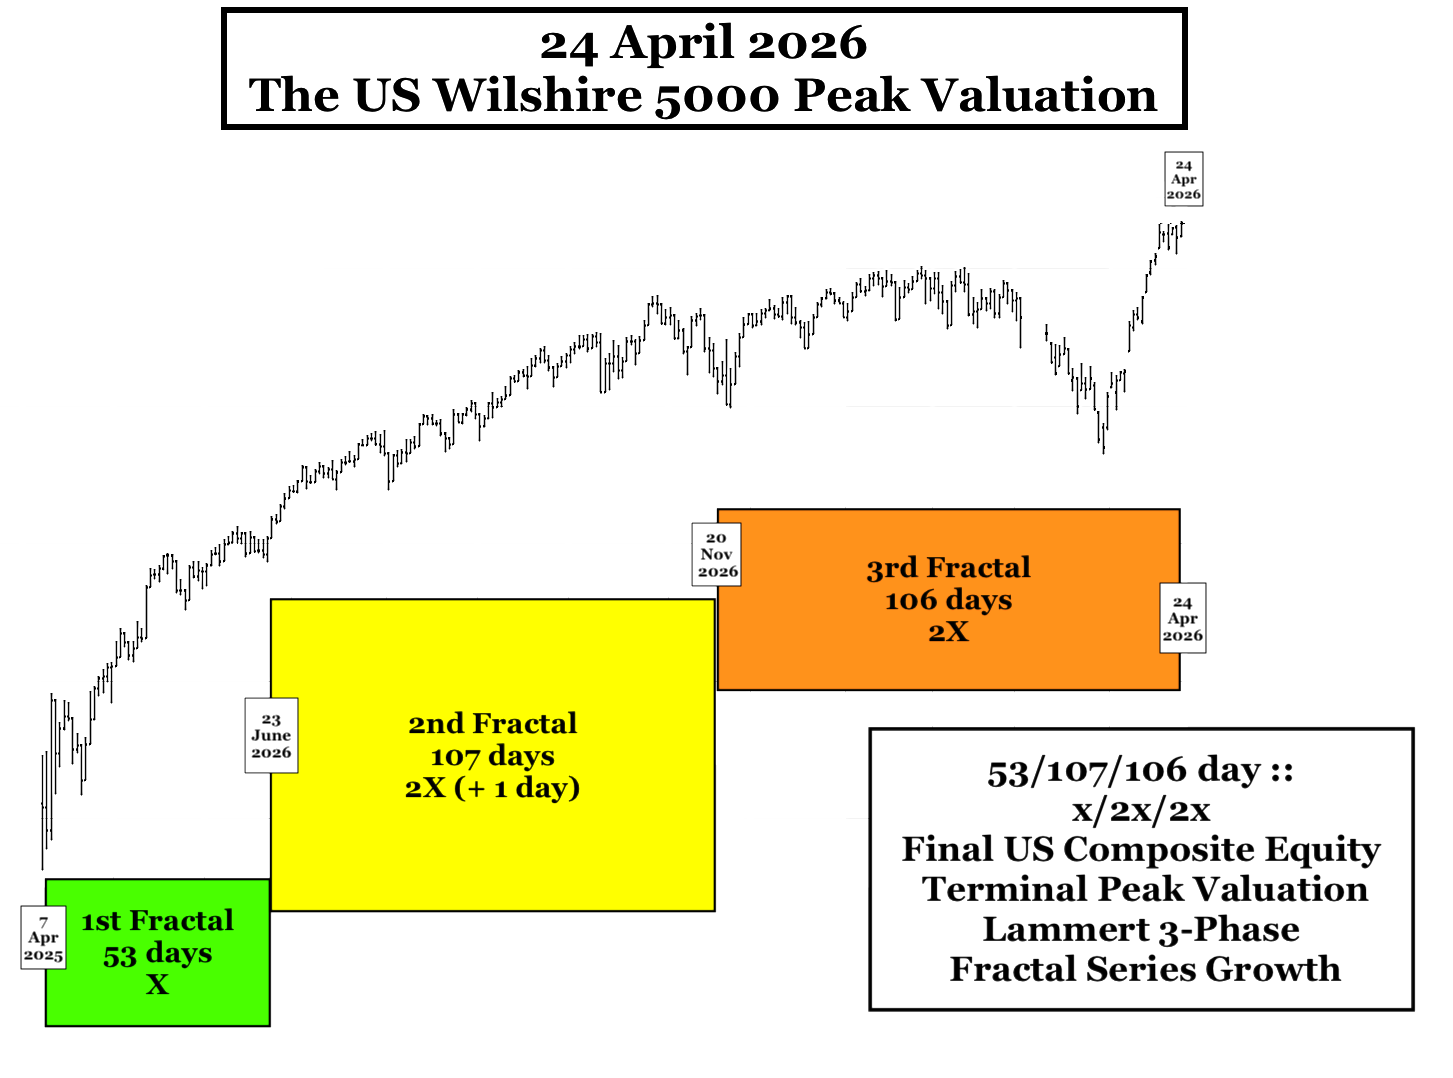
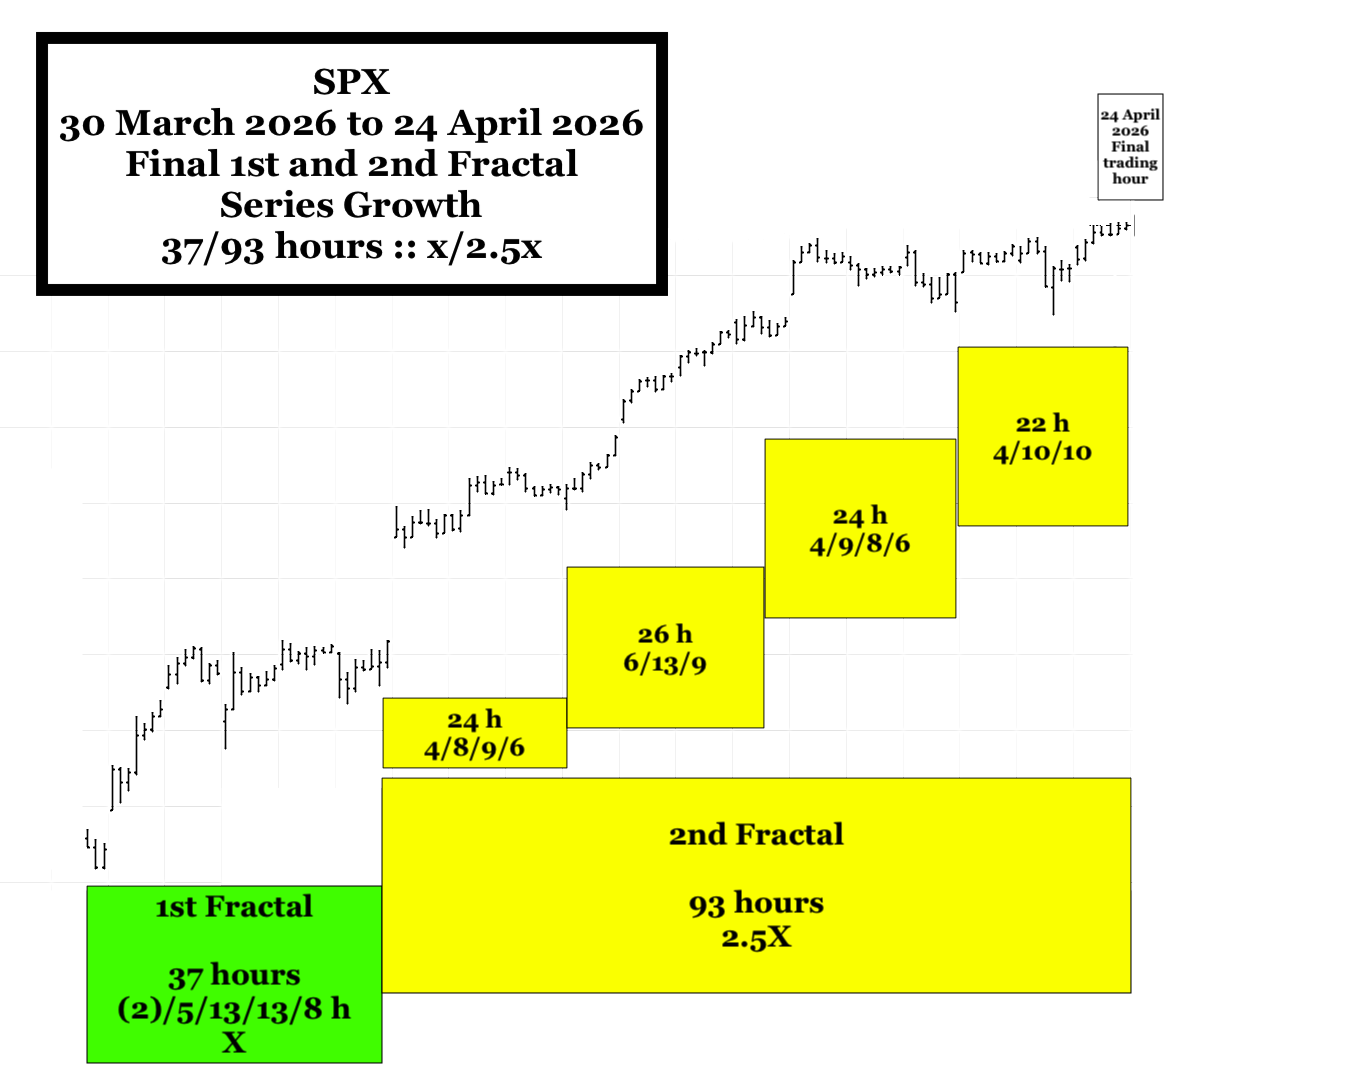
By comparison, the total global equity worth is currently about 154.5 trillion, a new record peak valuation. The 1982 to 2026 13/33 year 2026 1st and 2nd fractal series peak composite equity valuation will occur on 4 May 2026 completing a 7 April 2025 53/107/112 day :: x/2-2.5x/2-2.5x 3-phase Lammert terminal fractal growth series.
2% US GDP growth and US Equity valuation growth in the 1st quarter and the 1st month of the 2nd quarter has been propelled by continued private credit investment into AI and associated Tech, while the US consumer dromedary economy is faltering as represented by historically low consumer sentiment and the added gas and diesel price increase straws that are breaking the camel’s back.
GOLD
Gold prices appear to be following a 1929 DJIA 3 phase 11/26-28/26-28 day: xy/2.5xy/2.5xy 3-phase crash fractal decay series. The 11 day 1st fractal started on 23 March 2026.
CRYPTO is following a 12 Dec 2022 26/66/56-57/31 of 38-39 week :: x/2.5x/2-2.5x/1.5x 4-phase growth and decay fractal series.
OIL
With the war, oil is bucking the trend having completed a 16 Dec 2025 15/35/36 day 1st fractal growth series on 17 April 2026. On 4 May 2026 the 2nd fractal appears to be on day 12 of a 12 day 1st fractal sub-series. On 4 May 2026 the 2nd fractal appears to be on day 12 of a 12 day 2/5/5/3 day 1st fractal sub-series.
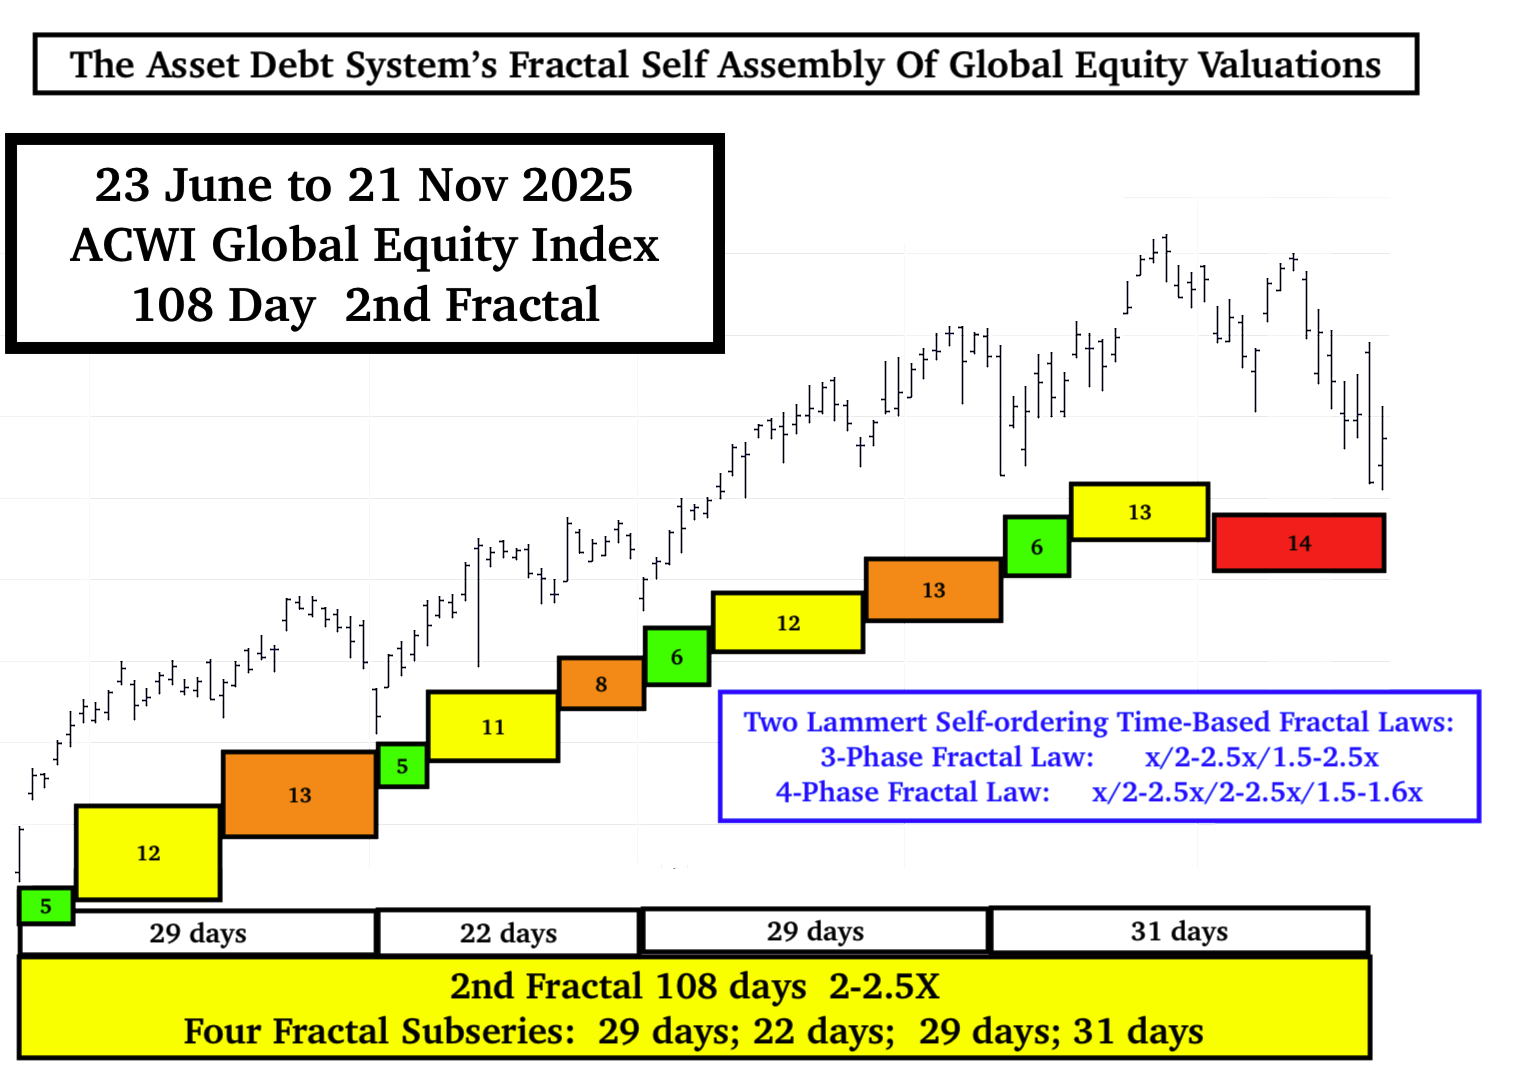
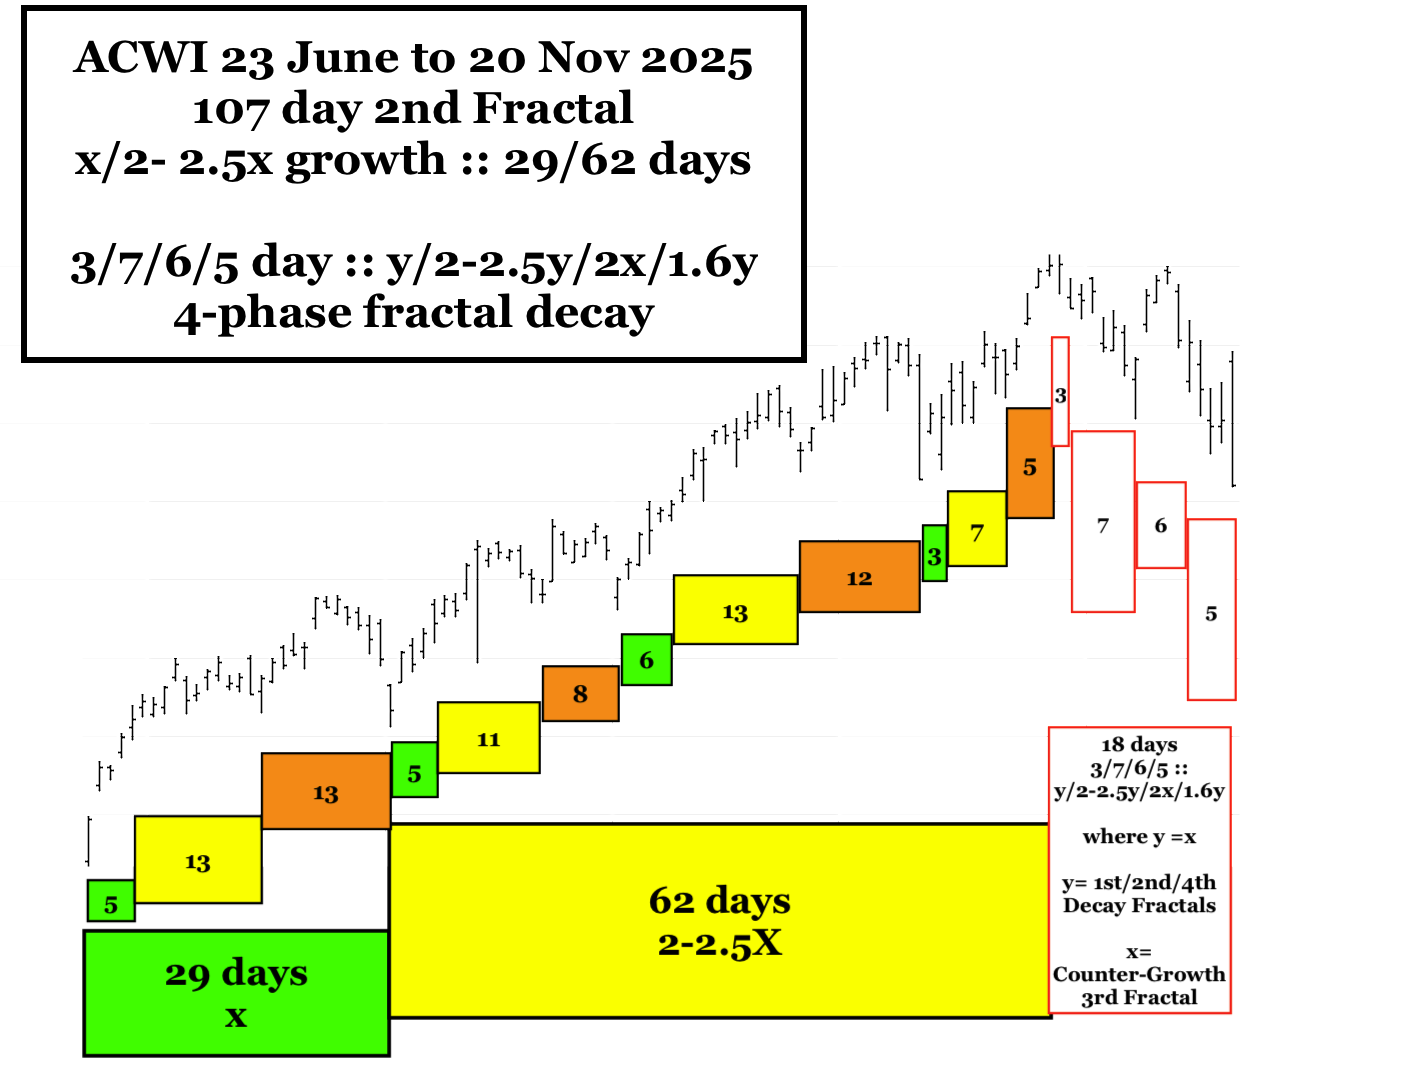
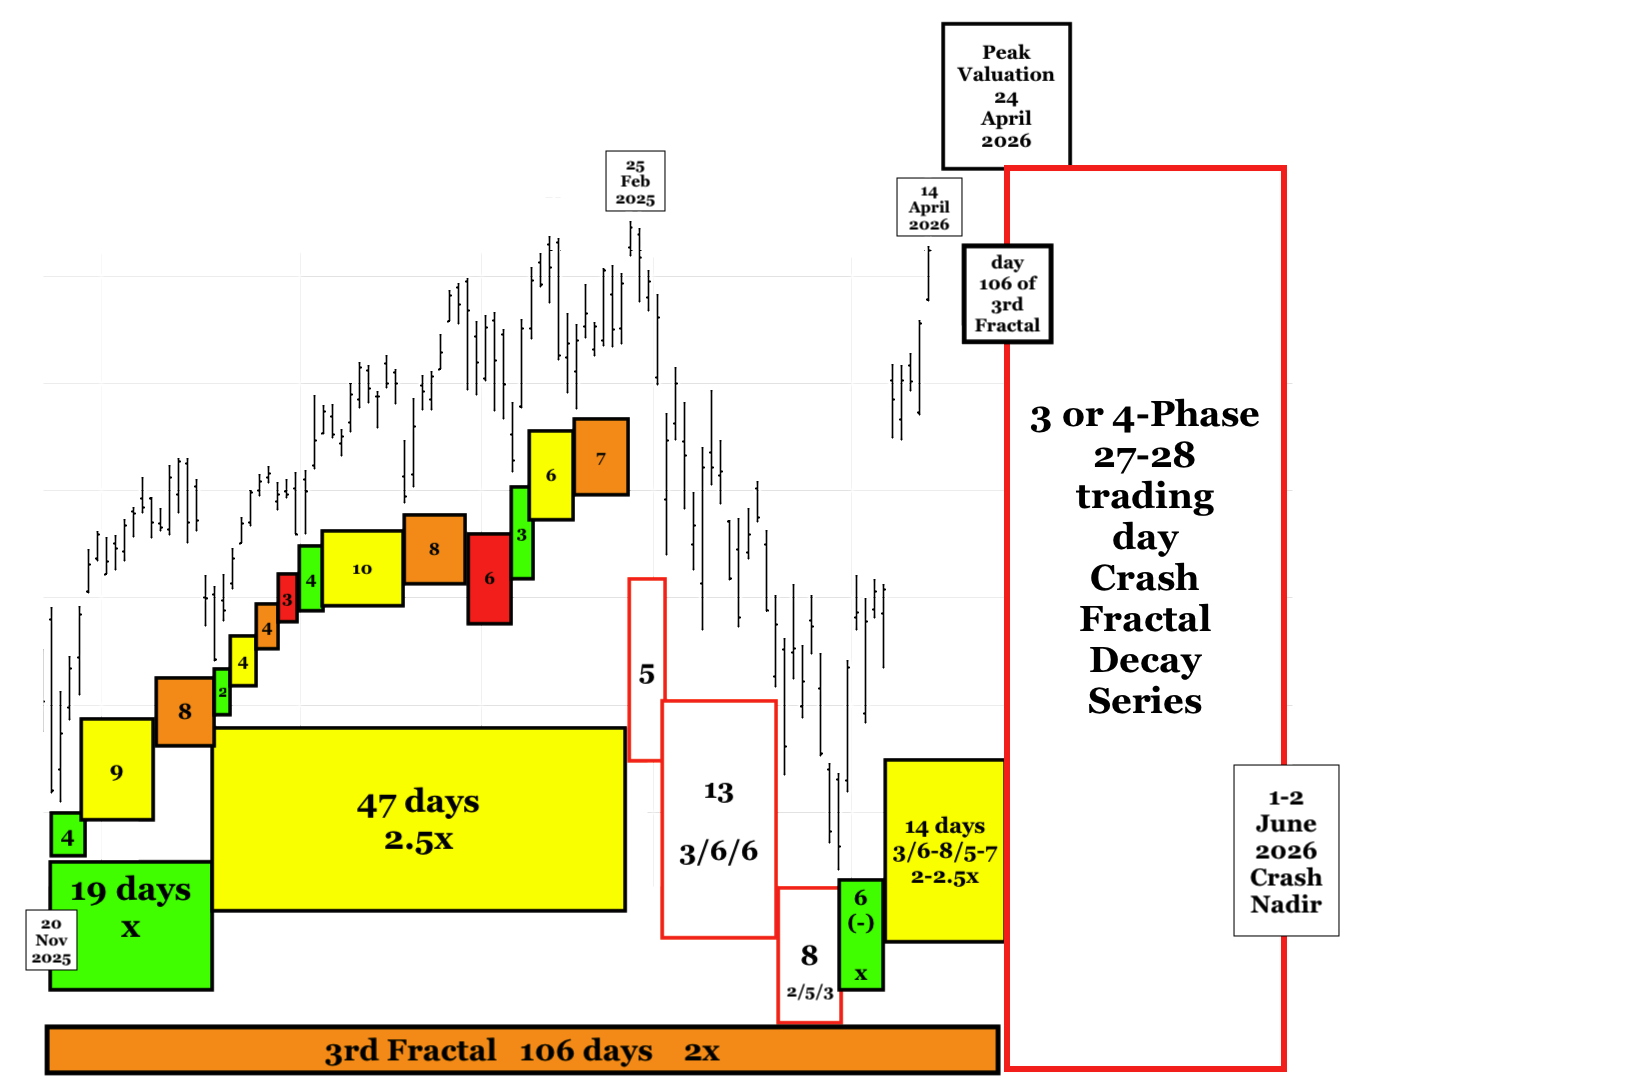
COMPOSITE EQUITIES (ACWI) reached a new high on 1 May 2026 on its way to completing a 30 March 2026 to 4 May 2026 6-/11-12/ 10 day :: x/2x/2x’ or a 36/76/61-64 hour :: x/2-2.5x/2-2.5x’ 3-phase growth series.
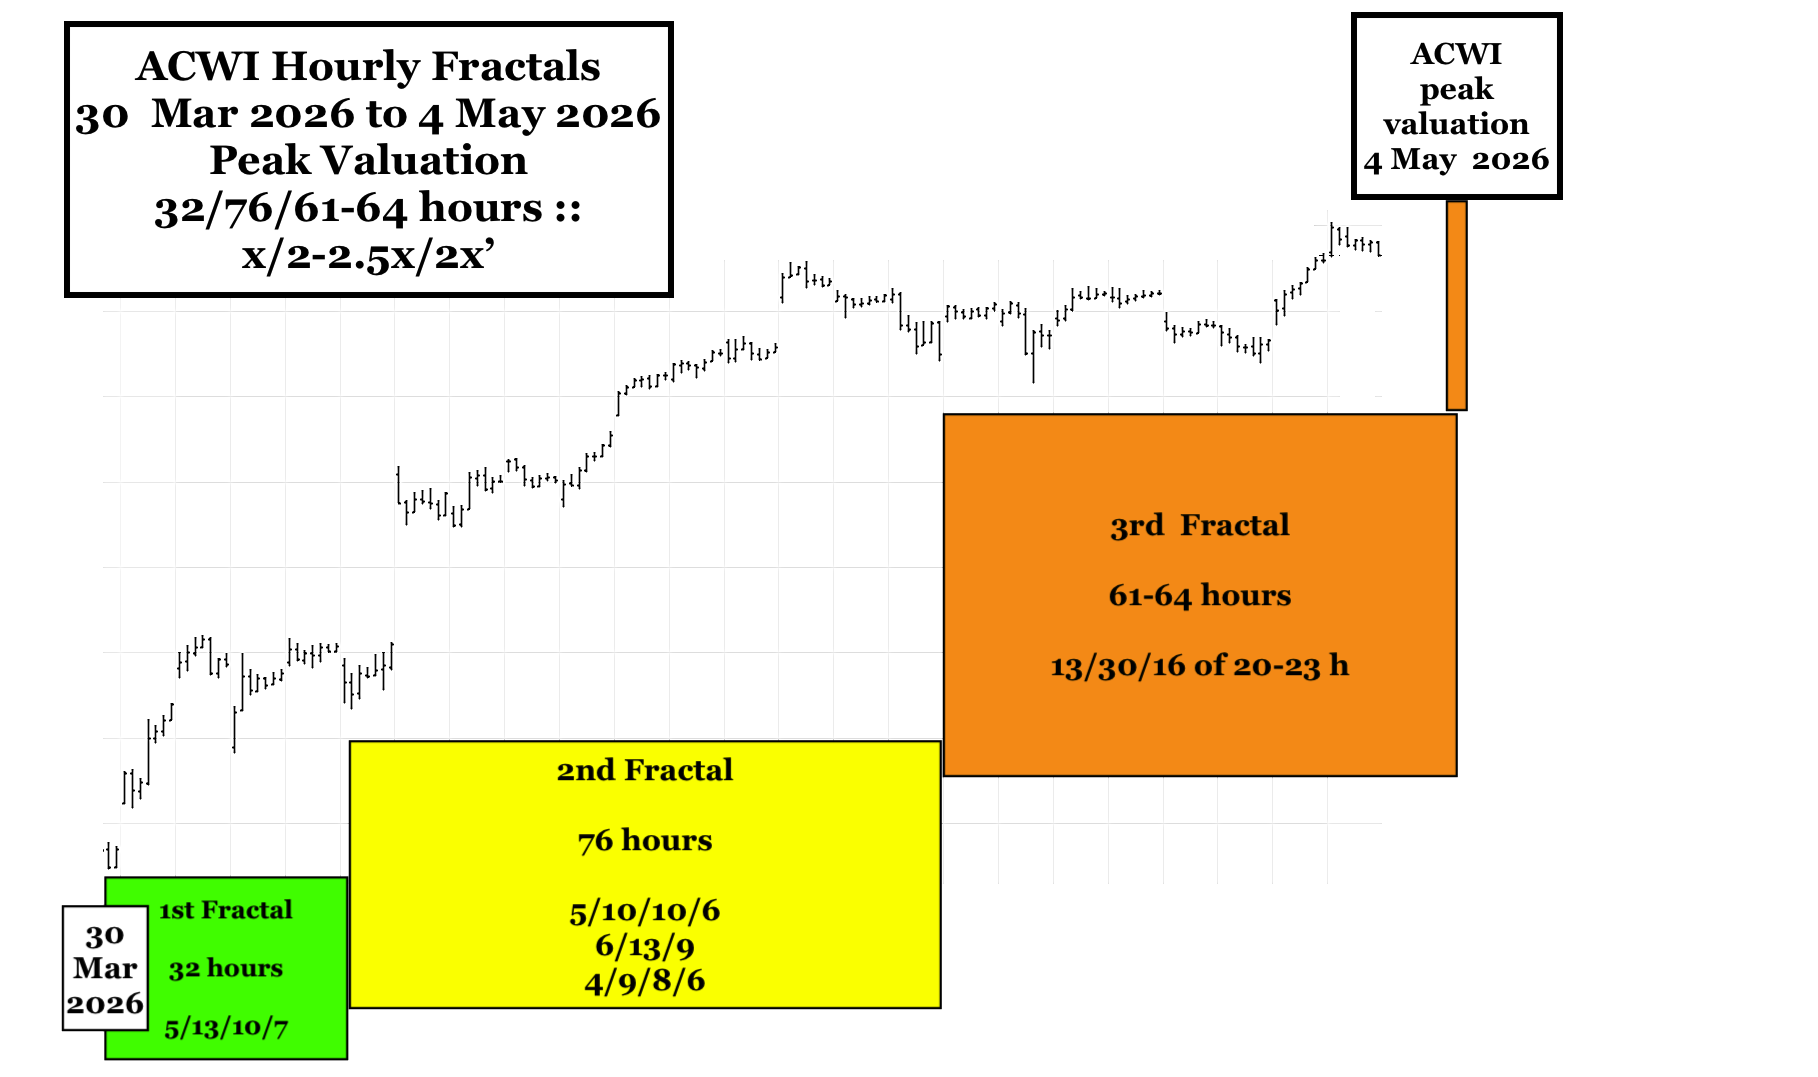
The current ACWI crash decay fractal series model is a 3-phase 7-8/18/11 days :: y/2-2.5y/1.5-1.6y fractal series.