The SPX 1929 initial peak to nadir valuation crash was 54 days in length according to AI and 50 days by a direct count. By AI the 1987 peak to nadir valuation crash was about 42 trading days. The 14 May 2026 Peak to Nadir valuation crash will occur over 9 trading days.
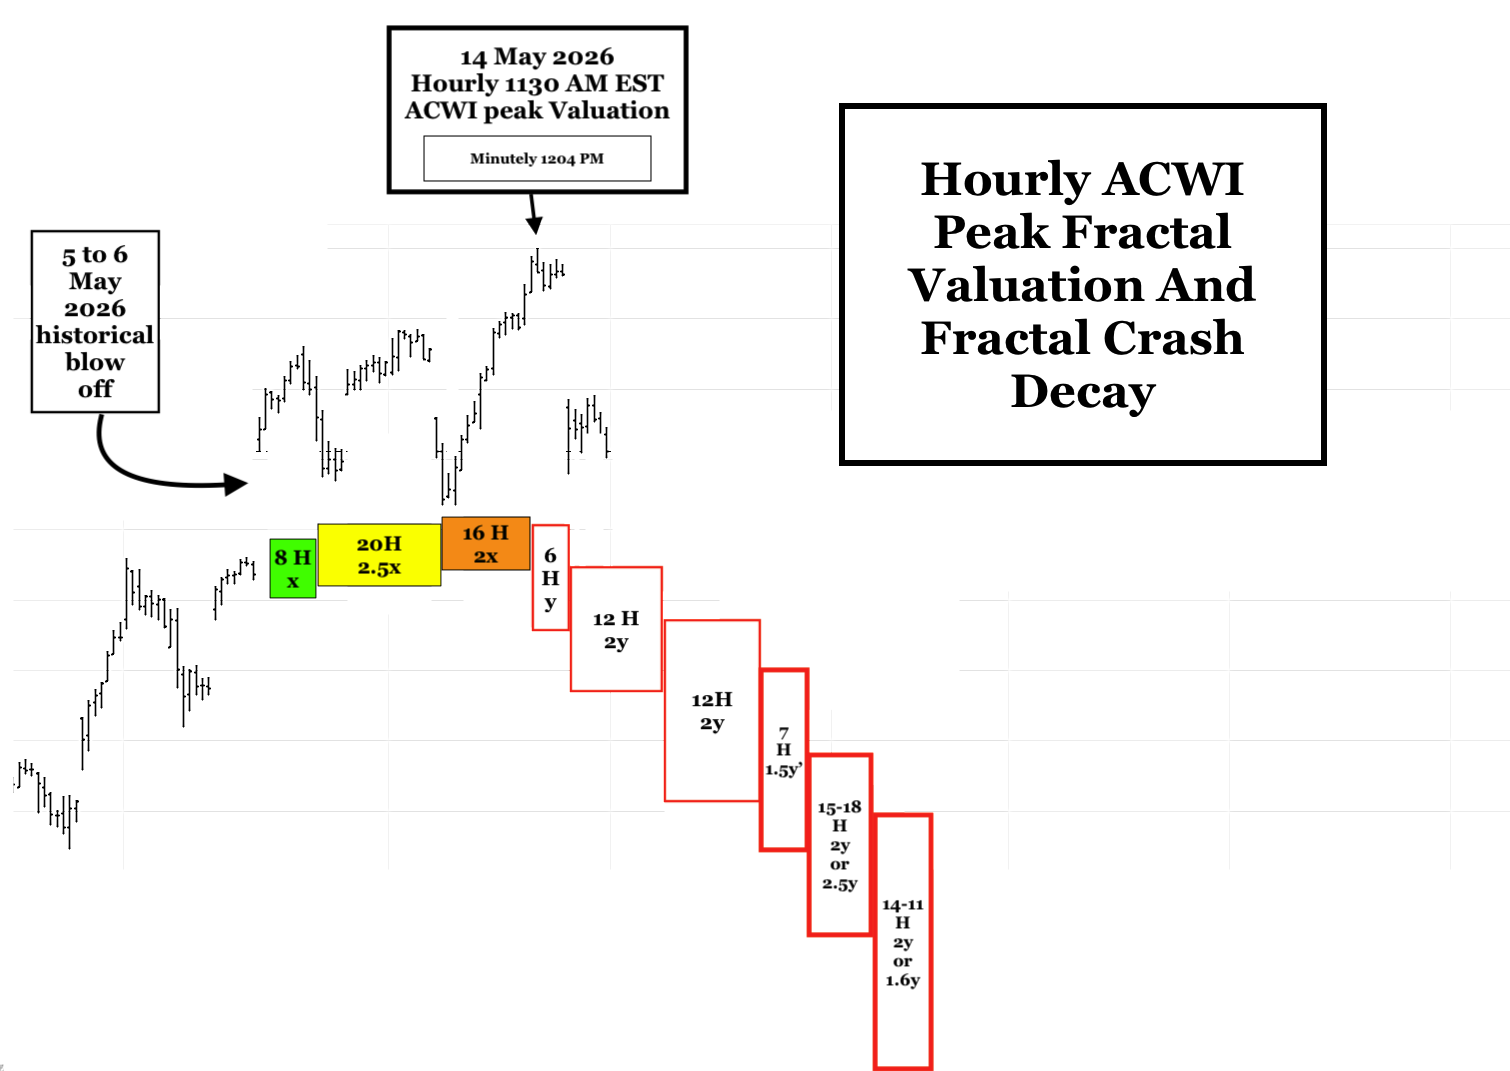
The ACWI/SPX 1130 EST 14 May 2026 to 330PM EST to 27 May 2026 Great Initial Crash is composed of two sequential hourly fractal decay series starting 1130 EST 14 May 2026:
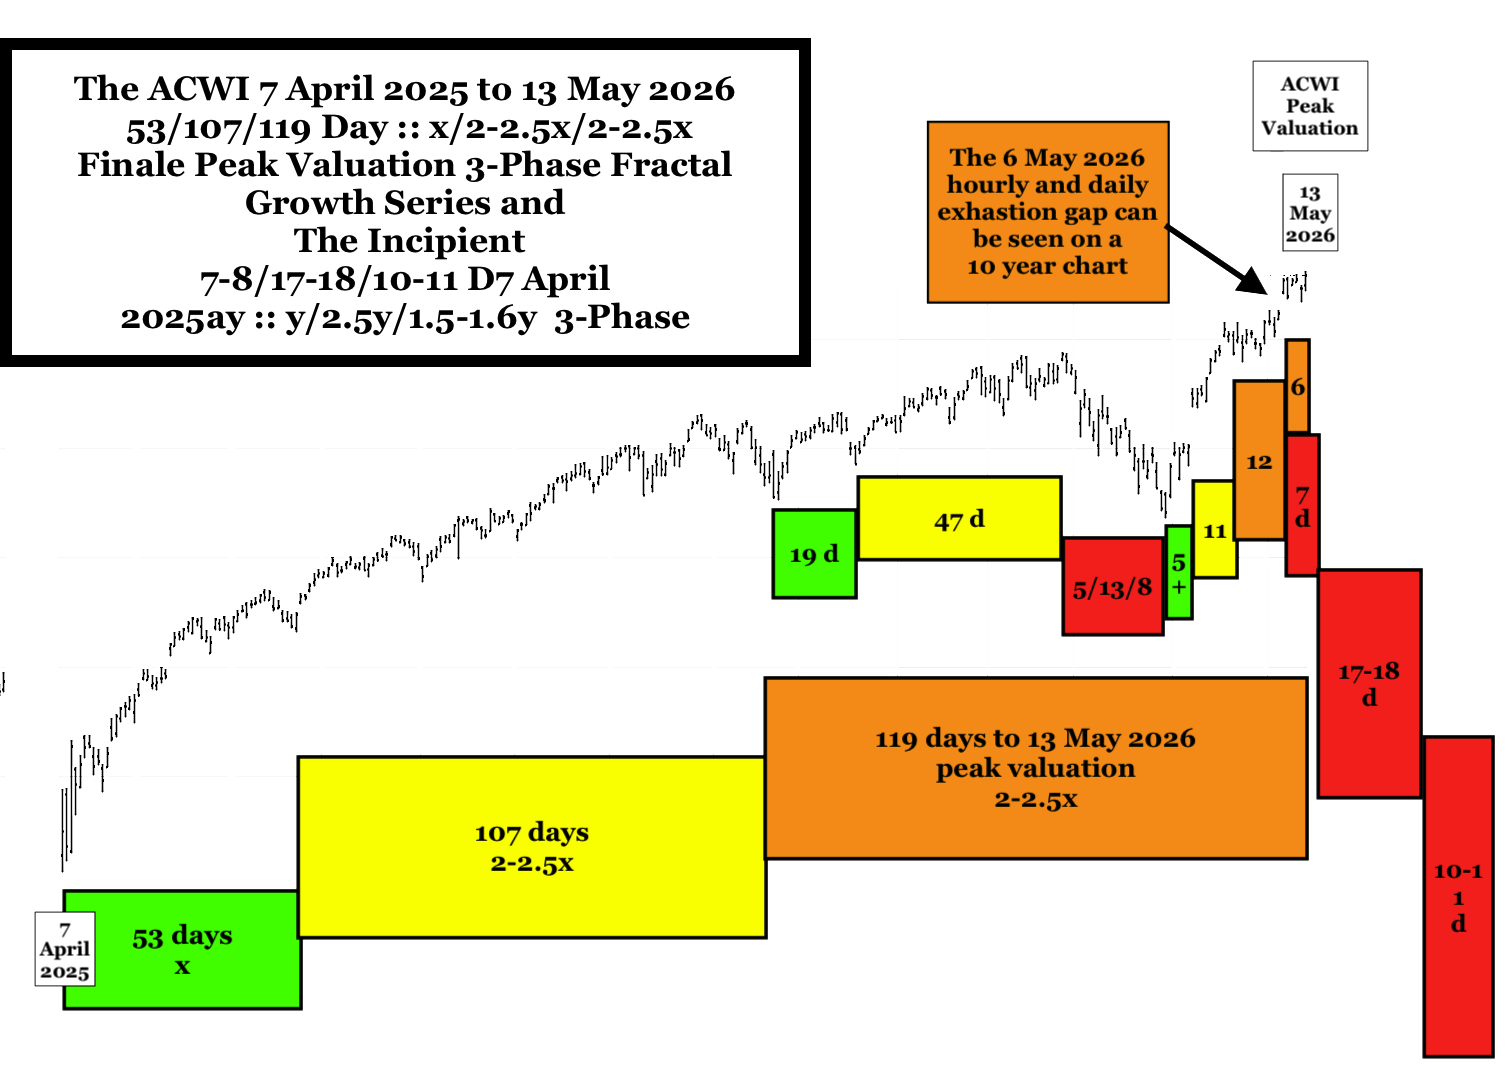
First fractal decay series:: a 4-Phase Series: 6/12/12/7 hours :: y/2y/2y/1.5y’ {you can observe the 6 hour 1st fractal and 7 hours of the 12 hour 2nd fractal(3/4 of 6/5) on hourly SPX and ACWI charts}
Second fractal decay series: The 7 hour 1.5y’ 4th fractal becomes the base for a final 3-phase decay series; either a 7/15/14 hour :: y/2.5y/2y series or a 7/18/11 hour :: y/2.5y/1.6y decay series both ending on a 3:30 PM 27 May 2026 crash nadir.
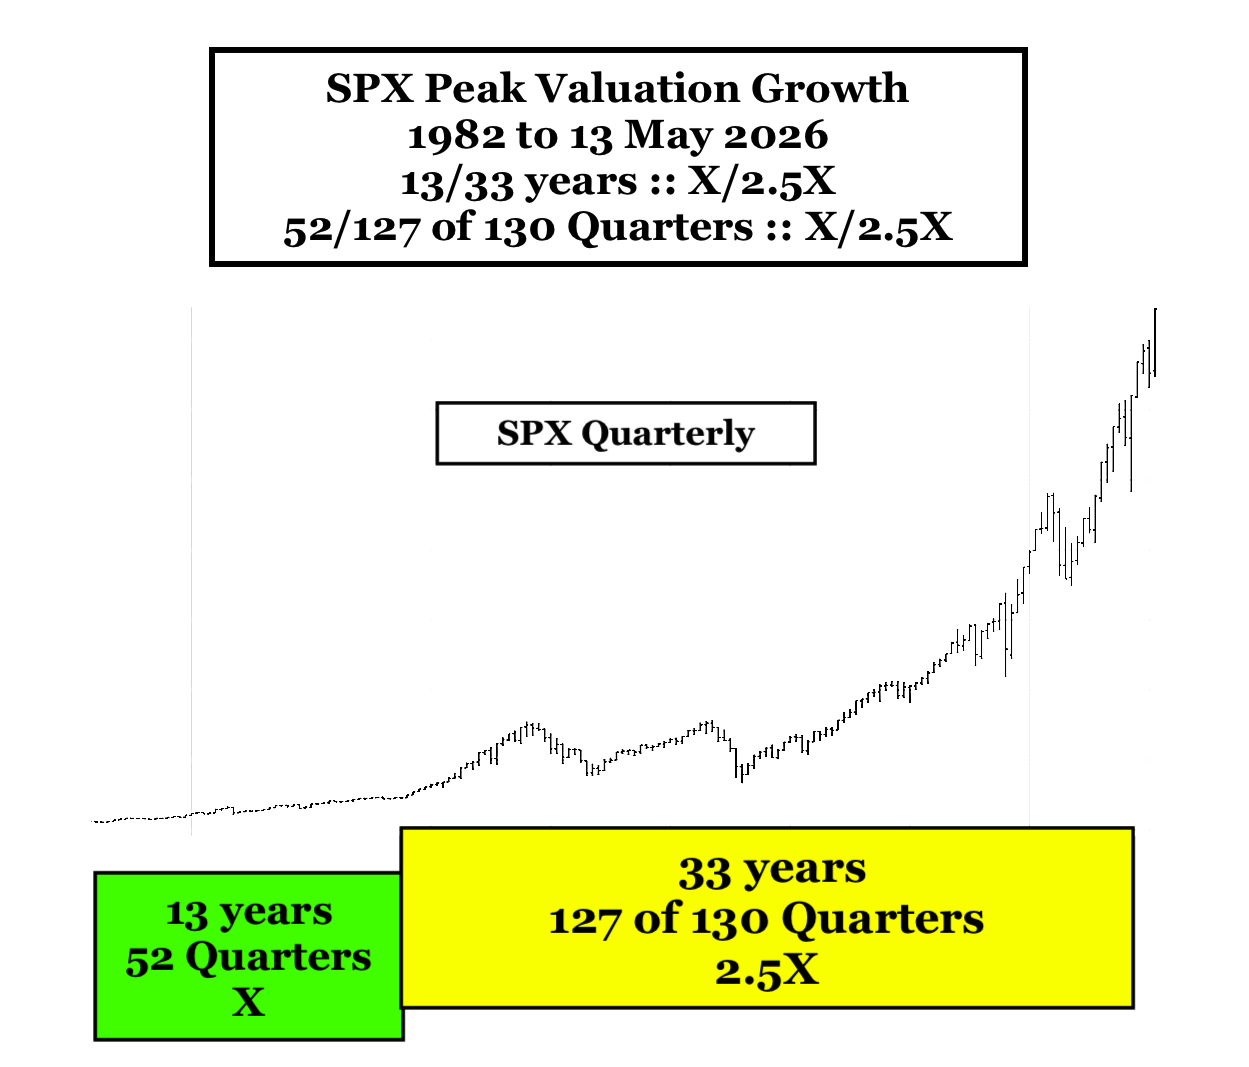
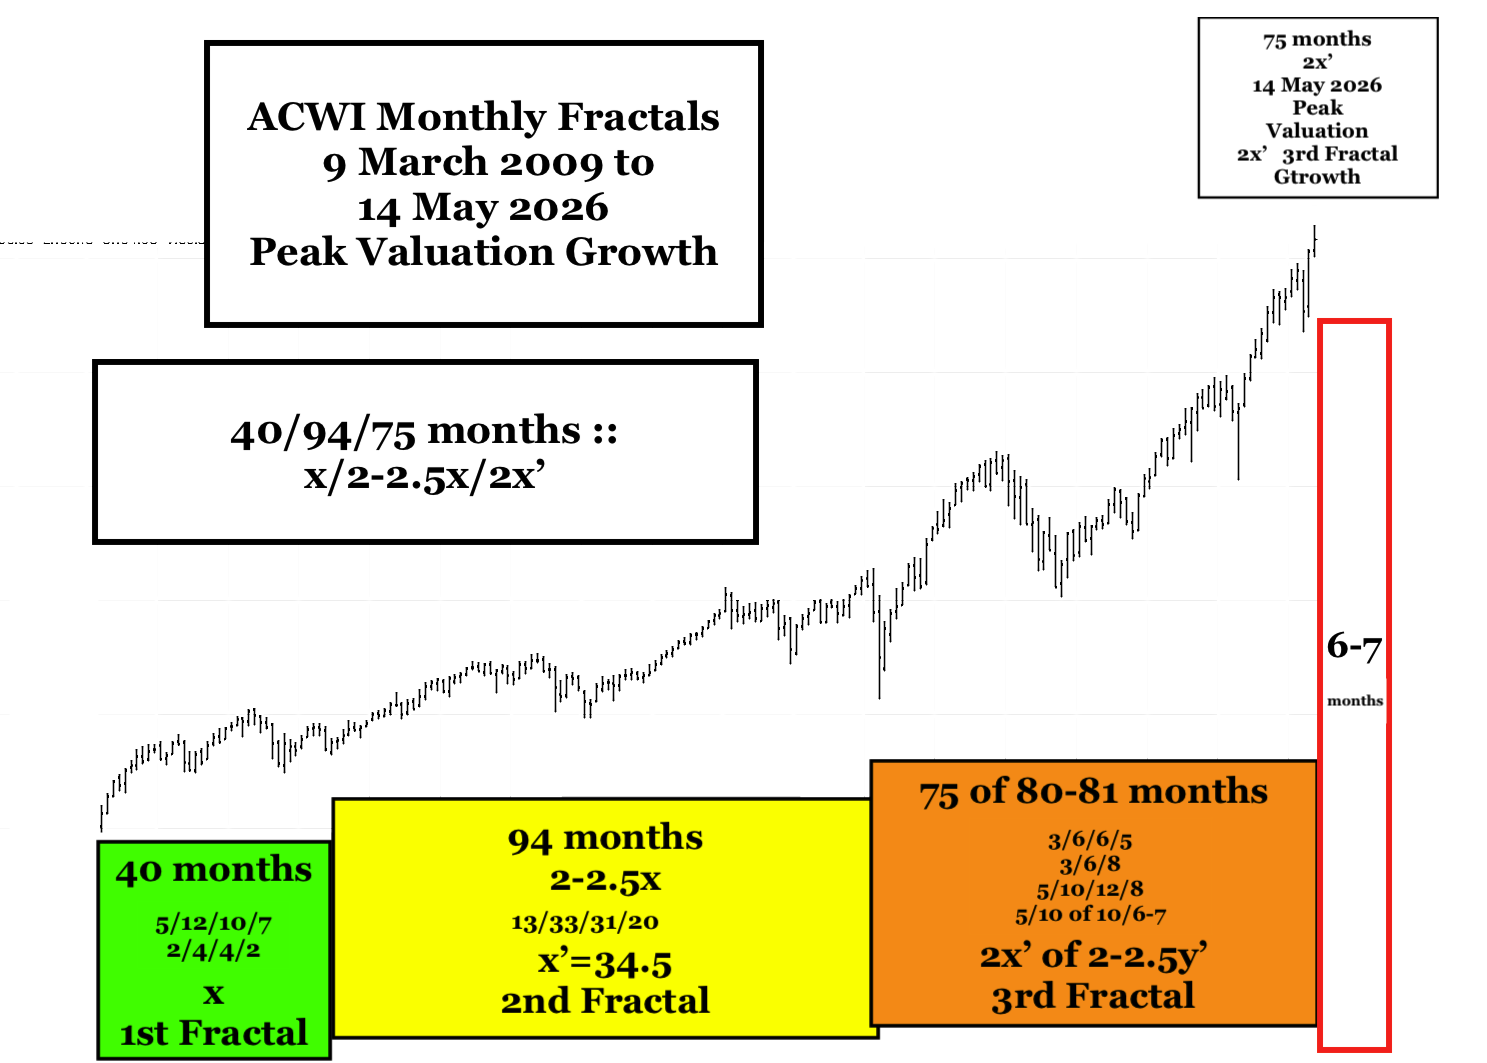
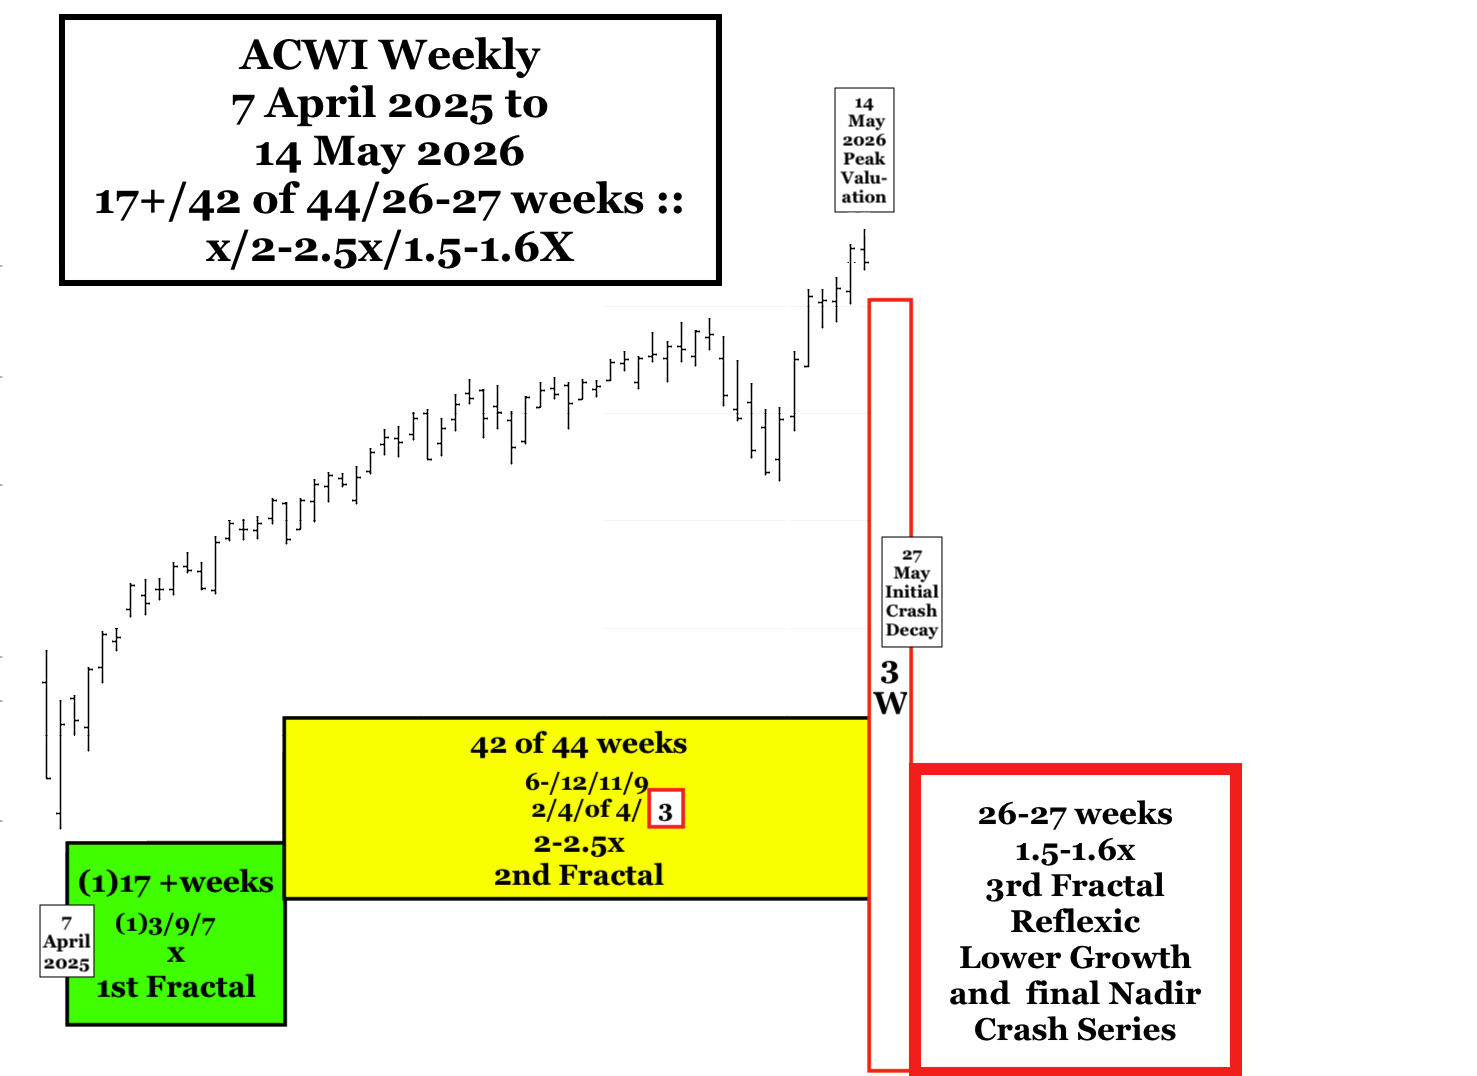
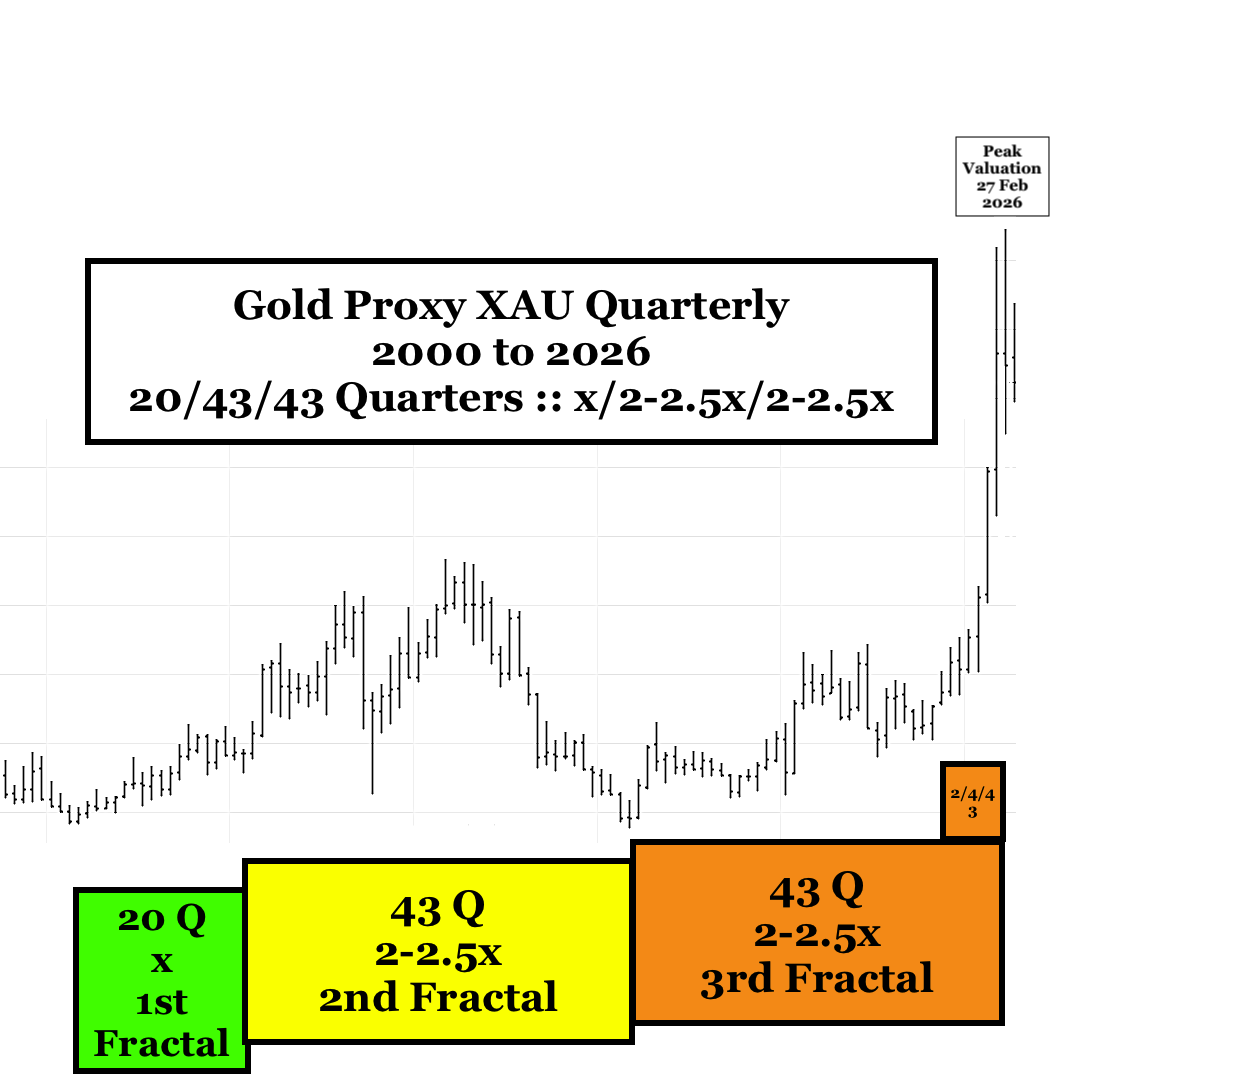
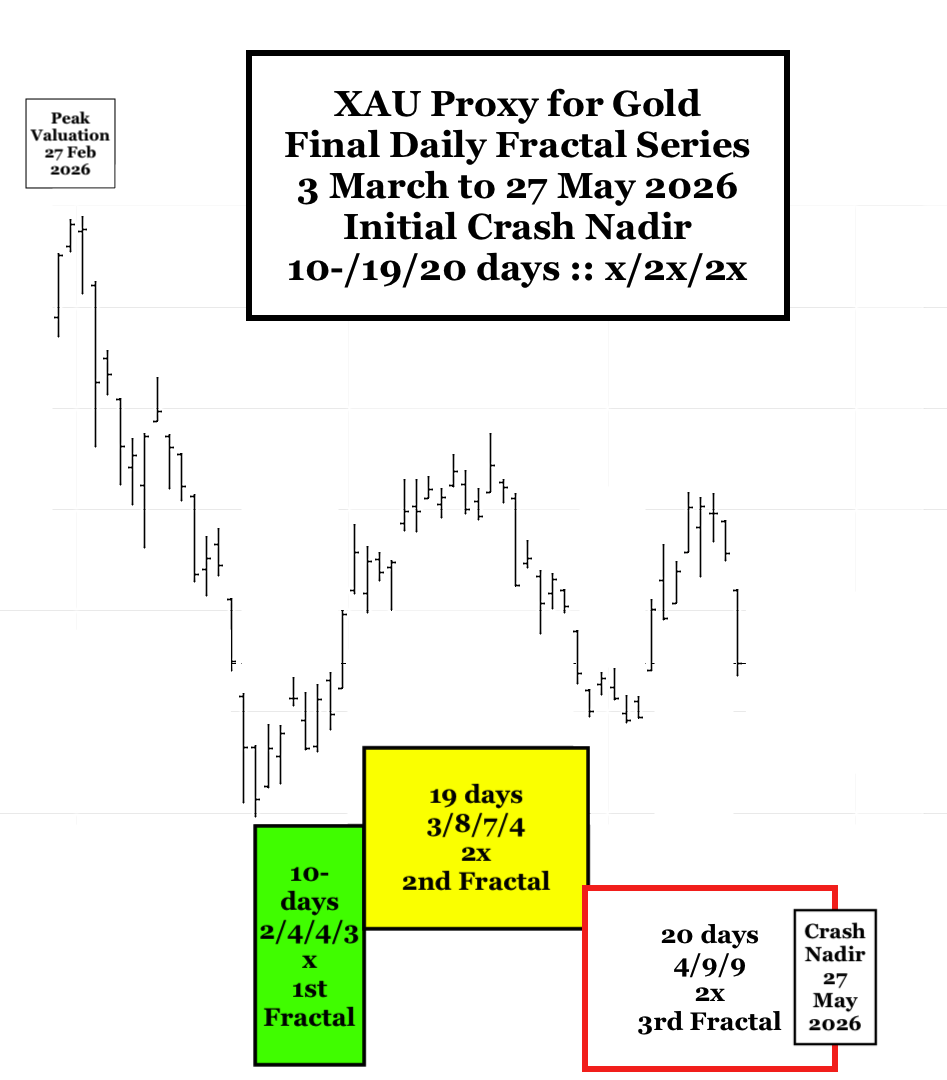
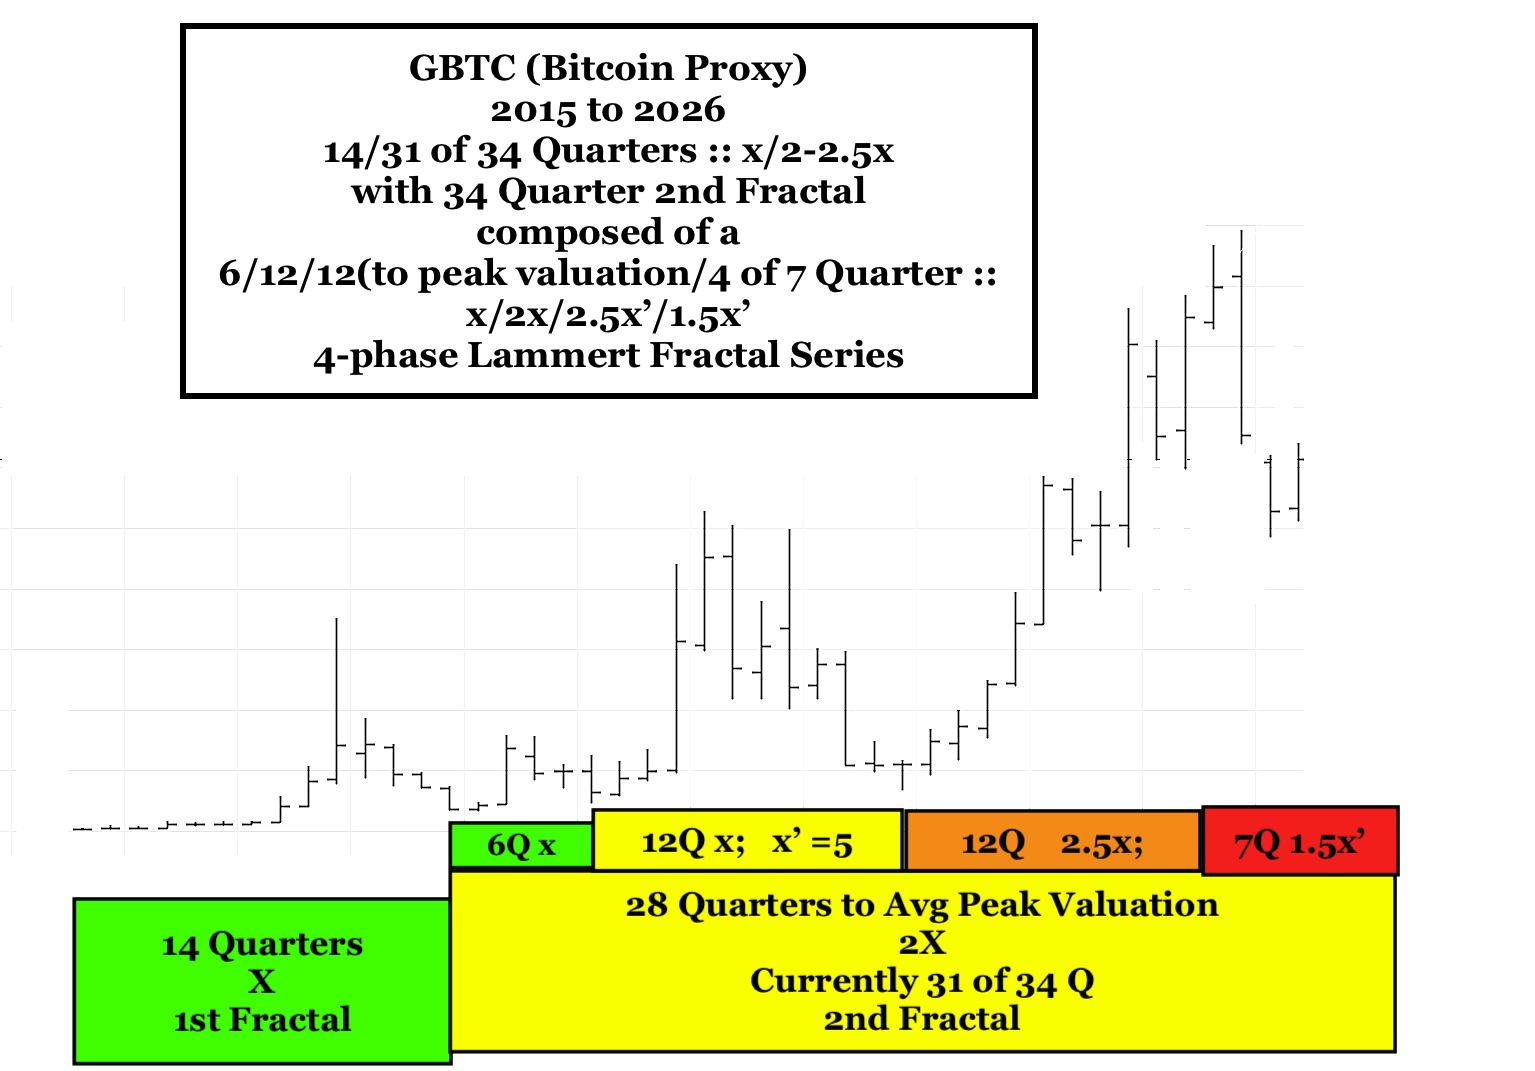
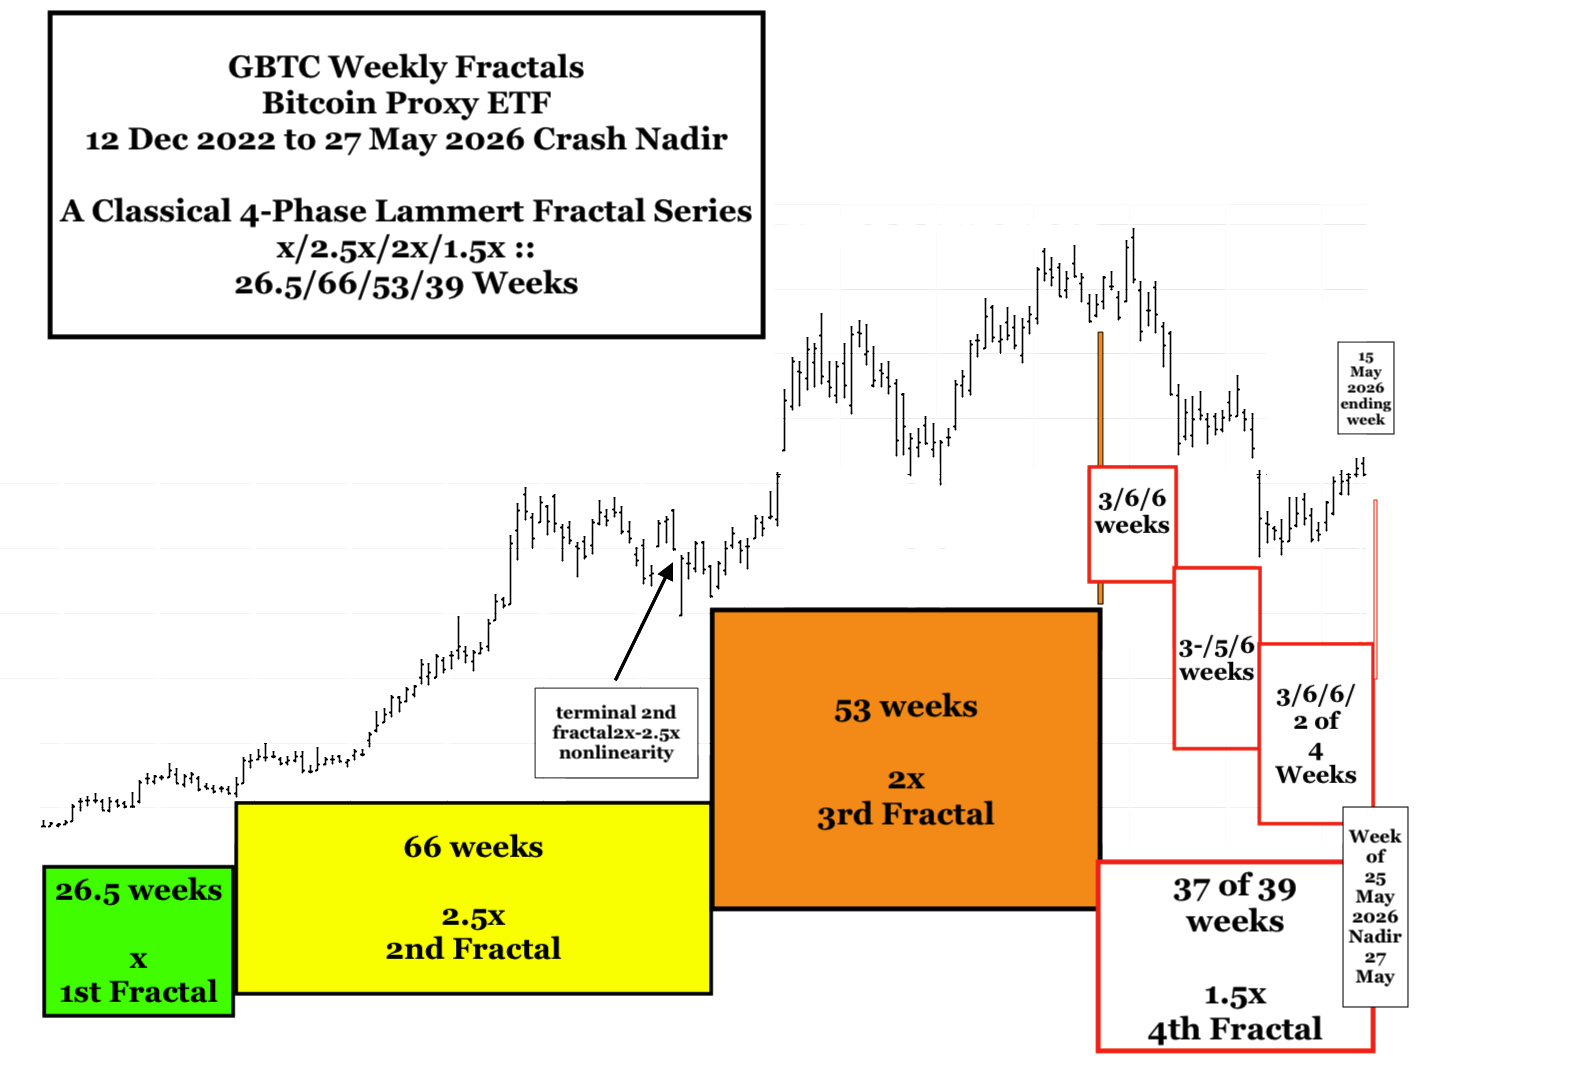
Added 17 May 2026: SPX, ACWI, Gold Proxy, and Crypto Proxy Quarterly, Monthly, Weekly Daily … Lammert Fractal Charts:
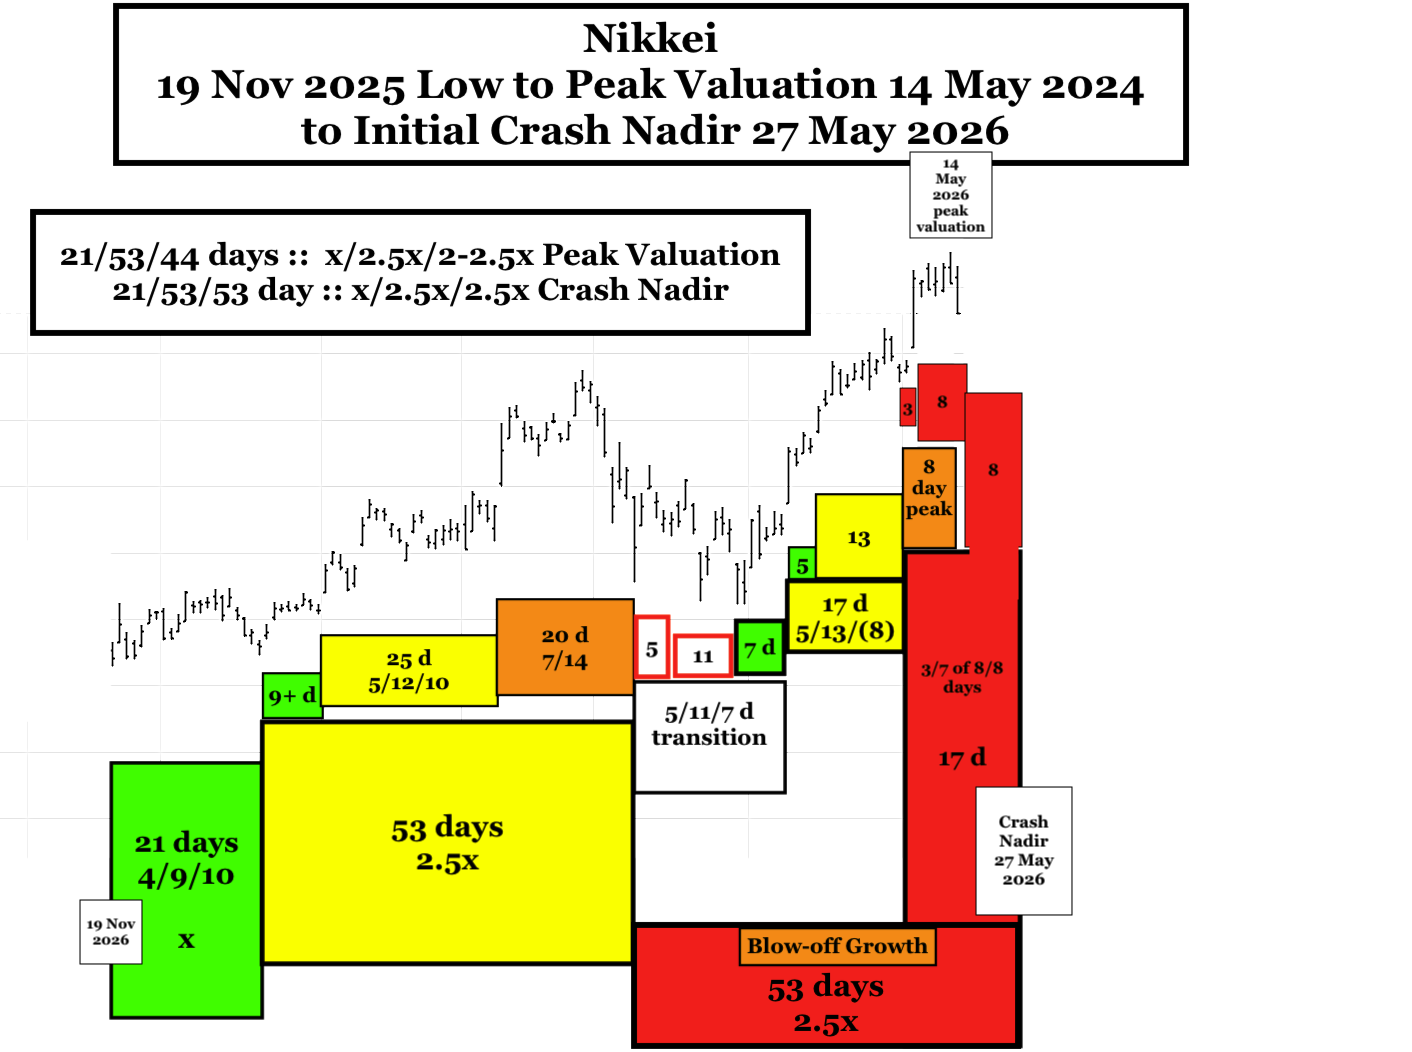
From the Nikkei’s low on 19 November 2025, it will complete an elegant 21/53/53 day fractal series on 27 May 2026. The composite global equity ACWI, which has a trading holiday, will likely complete the collapse in one trading day less than the Nikkei.
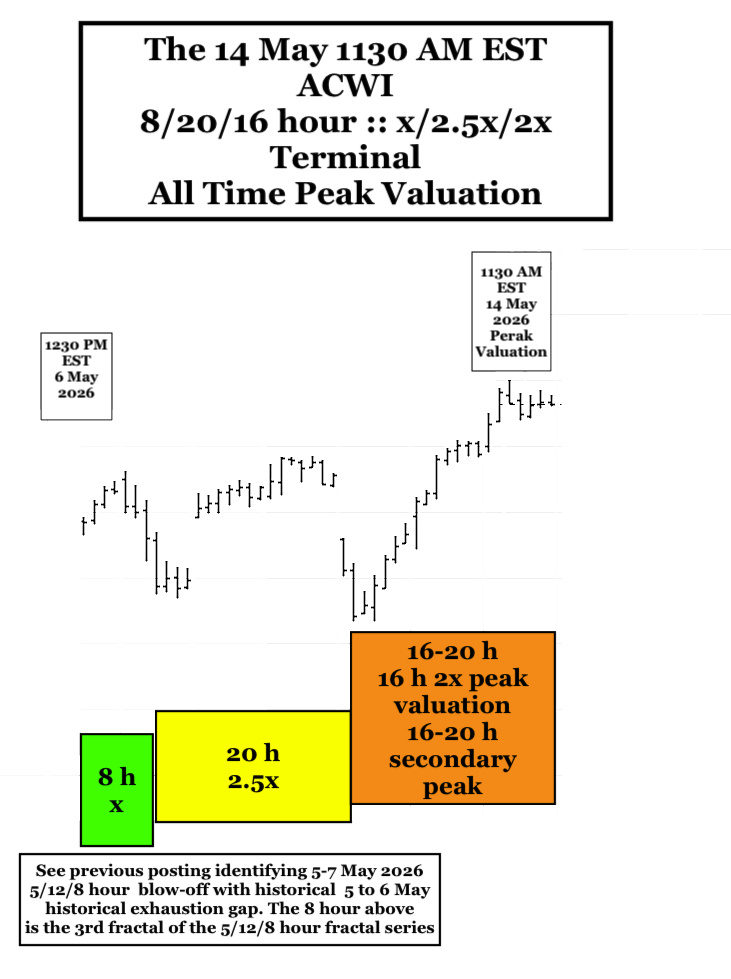
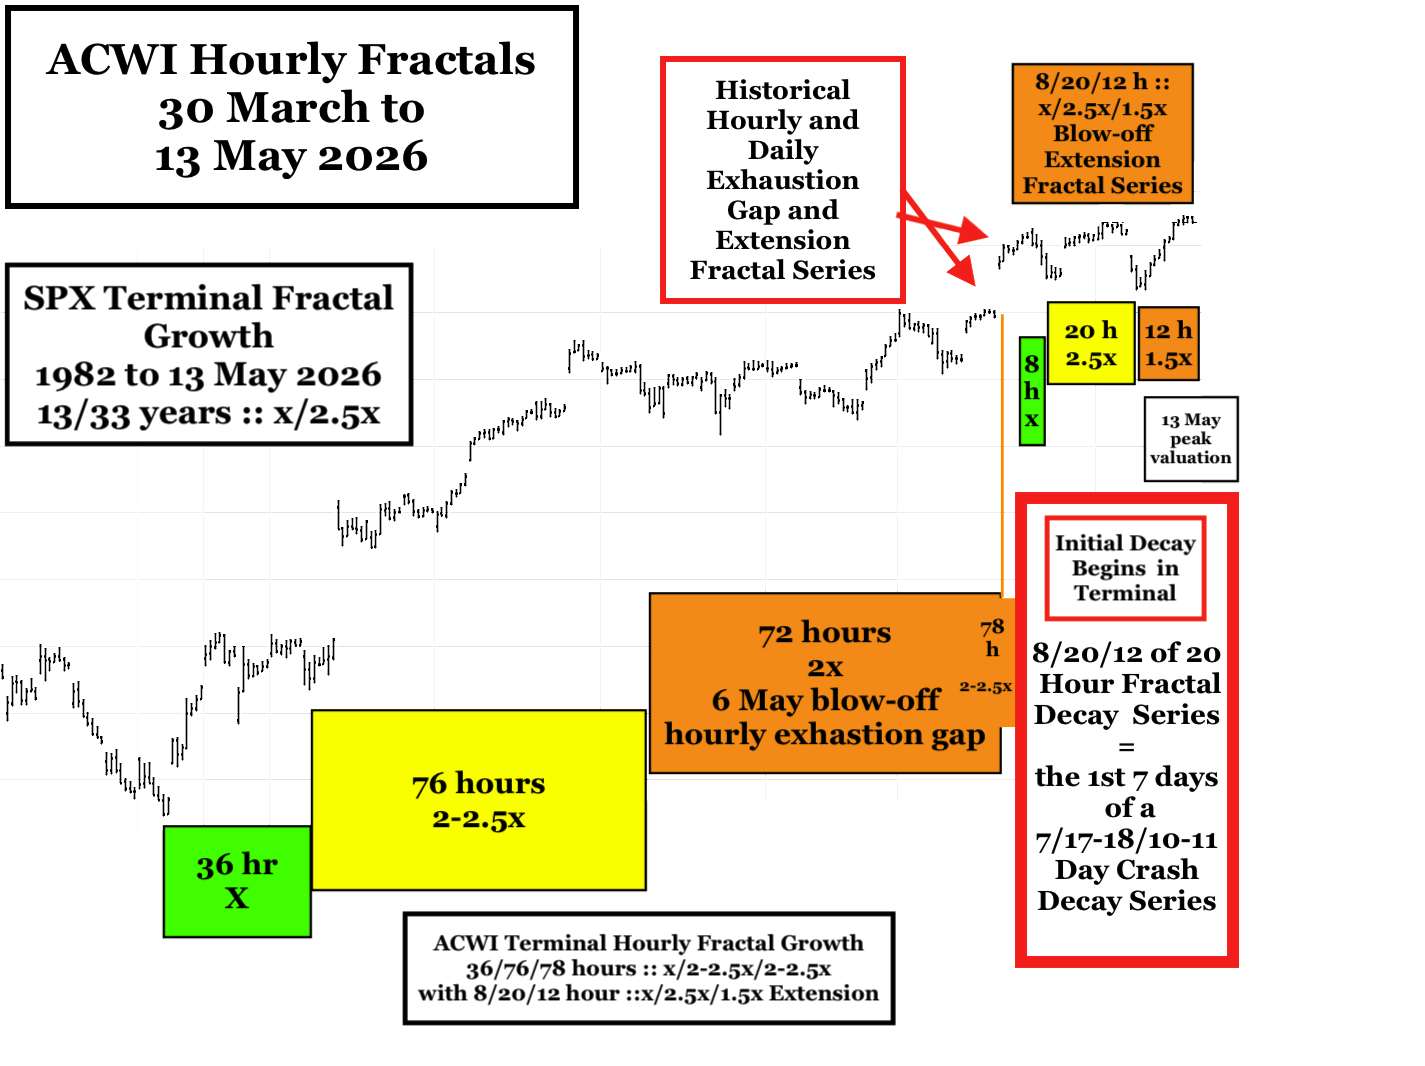
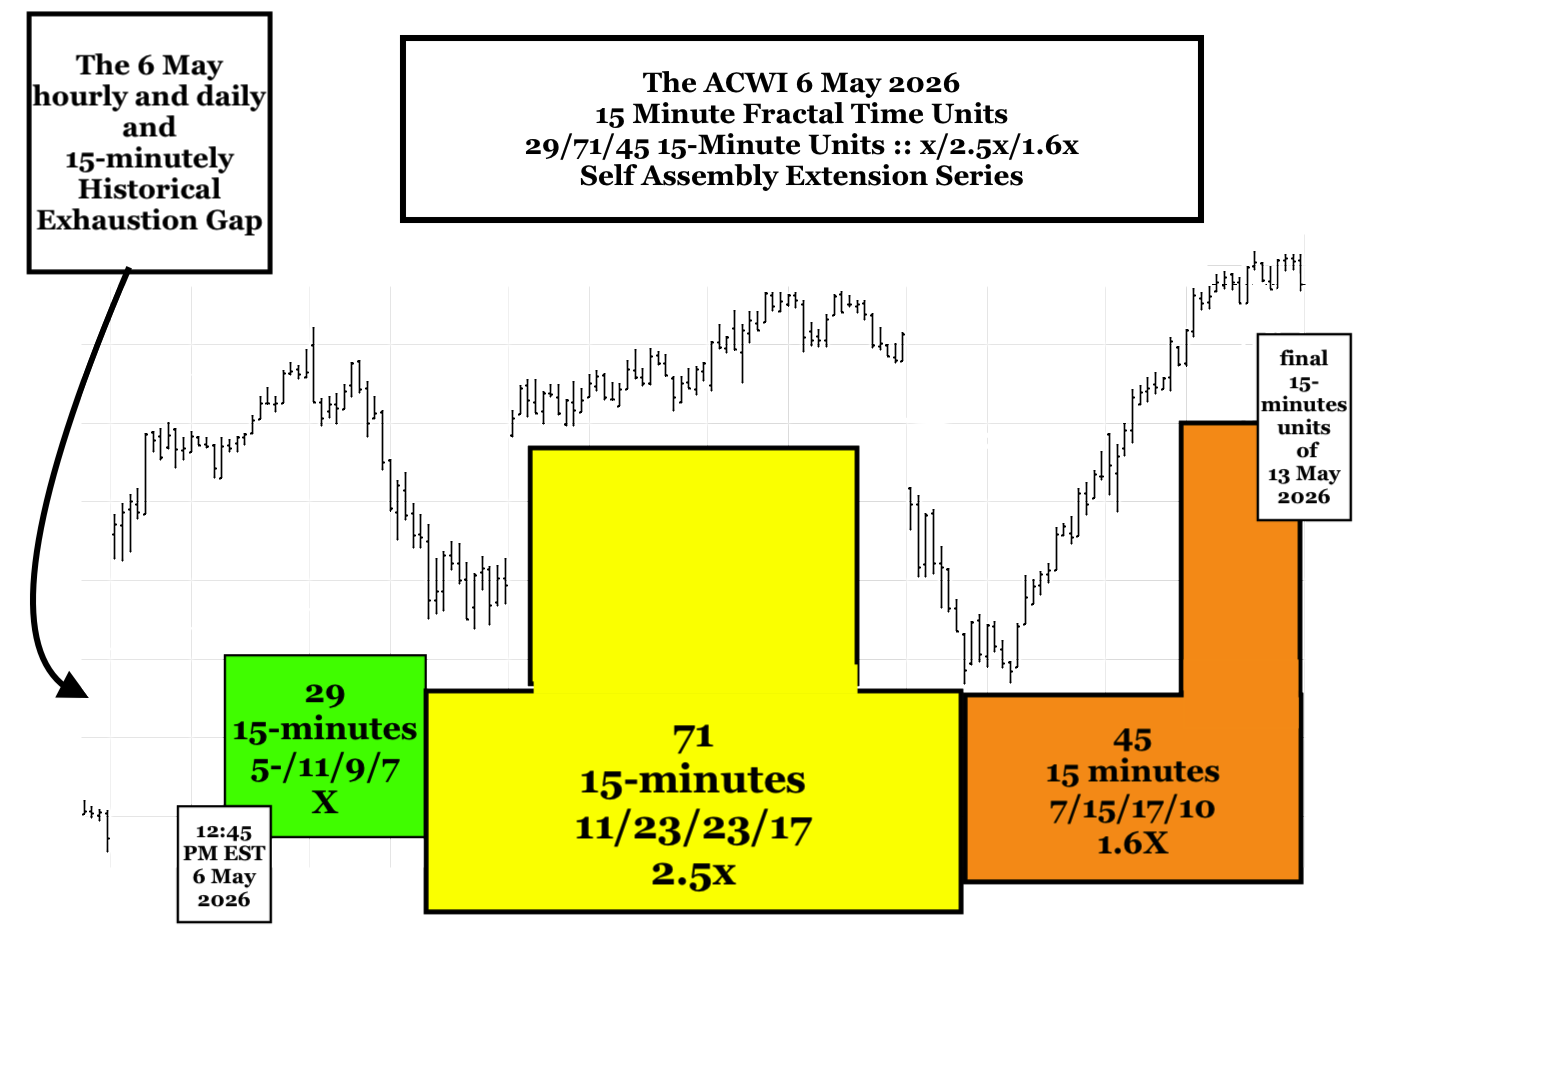
This also indicates that 14 May 2026 was the peak for the ACWI completing an 6 May 8/20/16 hour :: x/2.5x/2x final fractal growth series.
From ACWI’s peak on 1130 EST 14 May 2026, a 12/25/25 hour :: y/2y/2y Lammert 3-phase crash fractal decay series would produce a 27 May 2026 Crash Nadir.
Gold and crypto will follow the crash devaluation, whereas oil under the influence of gulf war, will have major gains.
The Two Lammert Time-Based Fractal Laws of Self-Assembly:
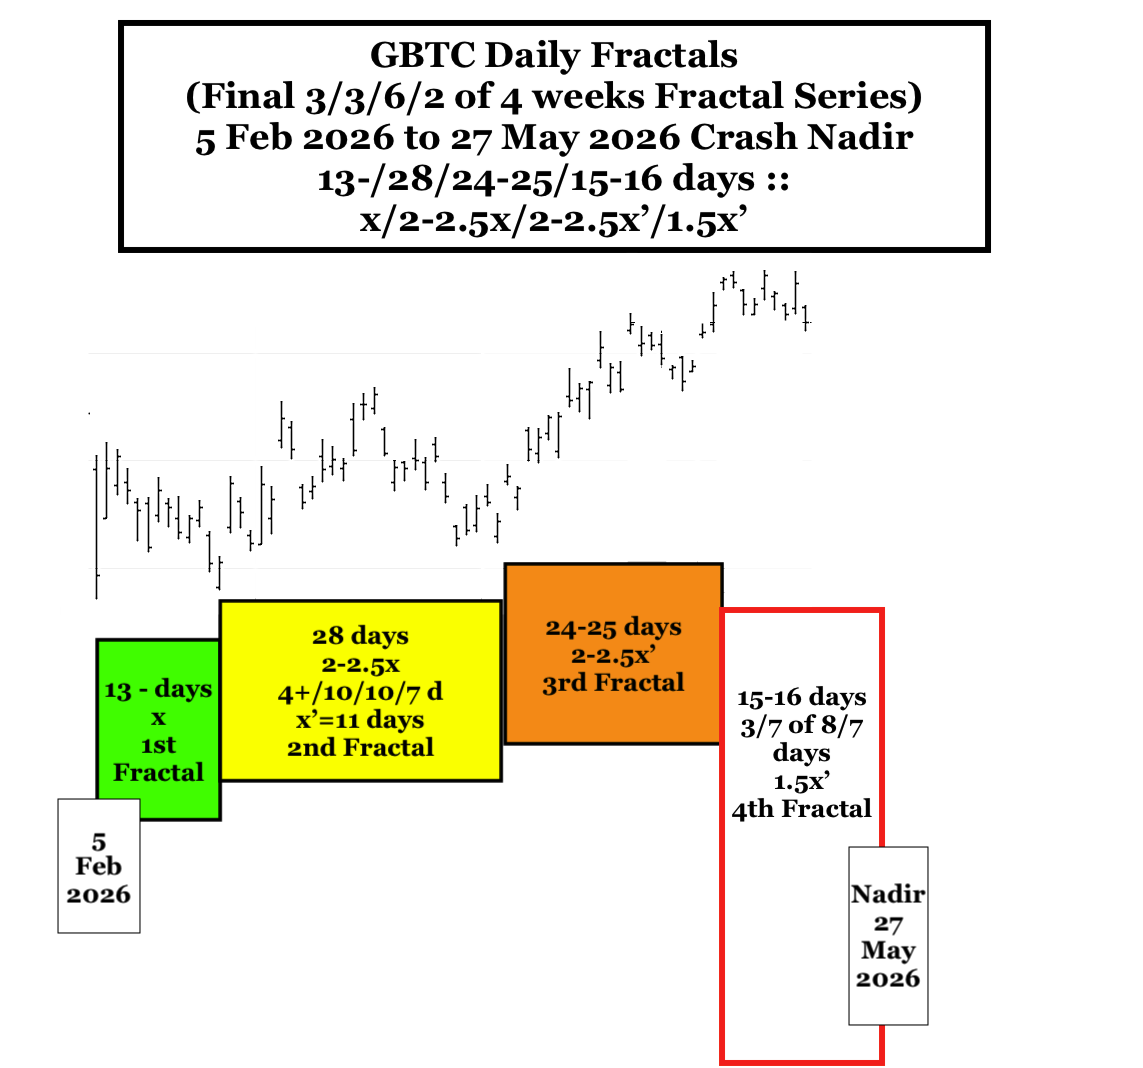
A 4-Phase Series: x/2-2.5x/2-2.5x/1.5-1.6x , where the 3rd fractal ends on a peak or lower high valuation and the other 3 Fractals end on nadir valuations.
A 3-Phase Series: x/2-2.5x/1.5-2.5x, where all 3 fractals end on nadir valuations. This can be written as y/2-2.5y/2-2.5y for crash devaluations where ‘y’ denotes declining valuations.