26 May Final ACWI Blow-off Peak Valuation: 6/12/12 day Crash Fractal Decay Series …
As above.
System initial crash valuation decay is mathematically conjoined with the system’s terminal peak valuation growth. This is the asset-debt macroeconomic system’s deterministic and elegantly simple time-based fractal self-assembly and self ordering and integration and mergence of the system’s incipient valuation crash decay with terminal valuation peak growth. ACWI began its final growth after a historical 30-min, hourly, and daily exhaustion gap blow-off between 5 and 6 May 2026. By this observer’s awareness, this has never happened before.
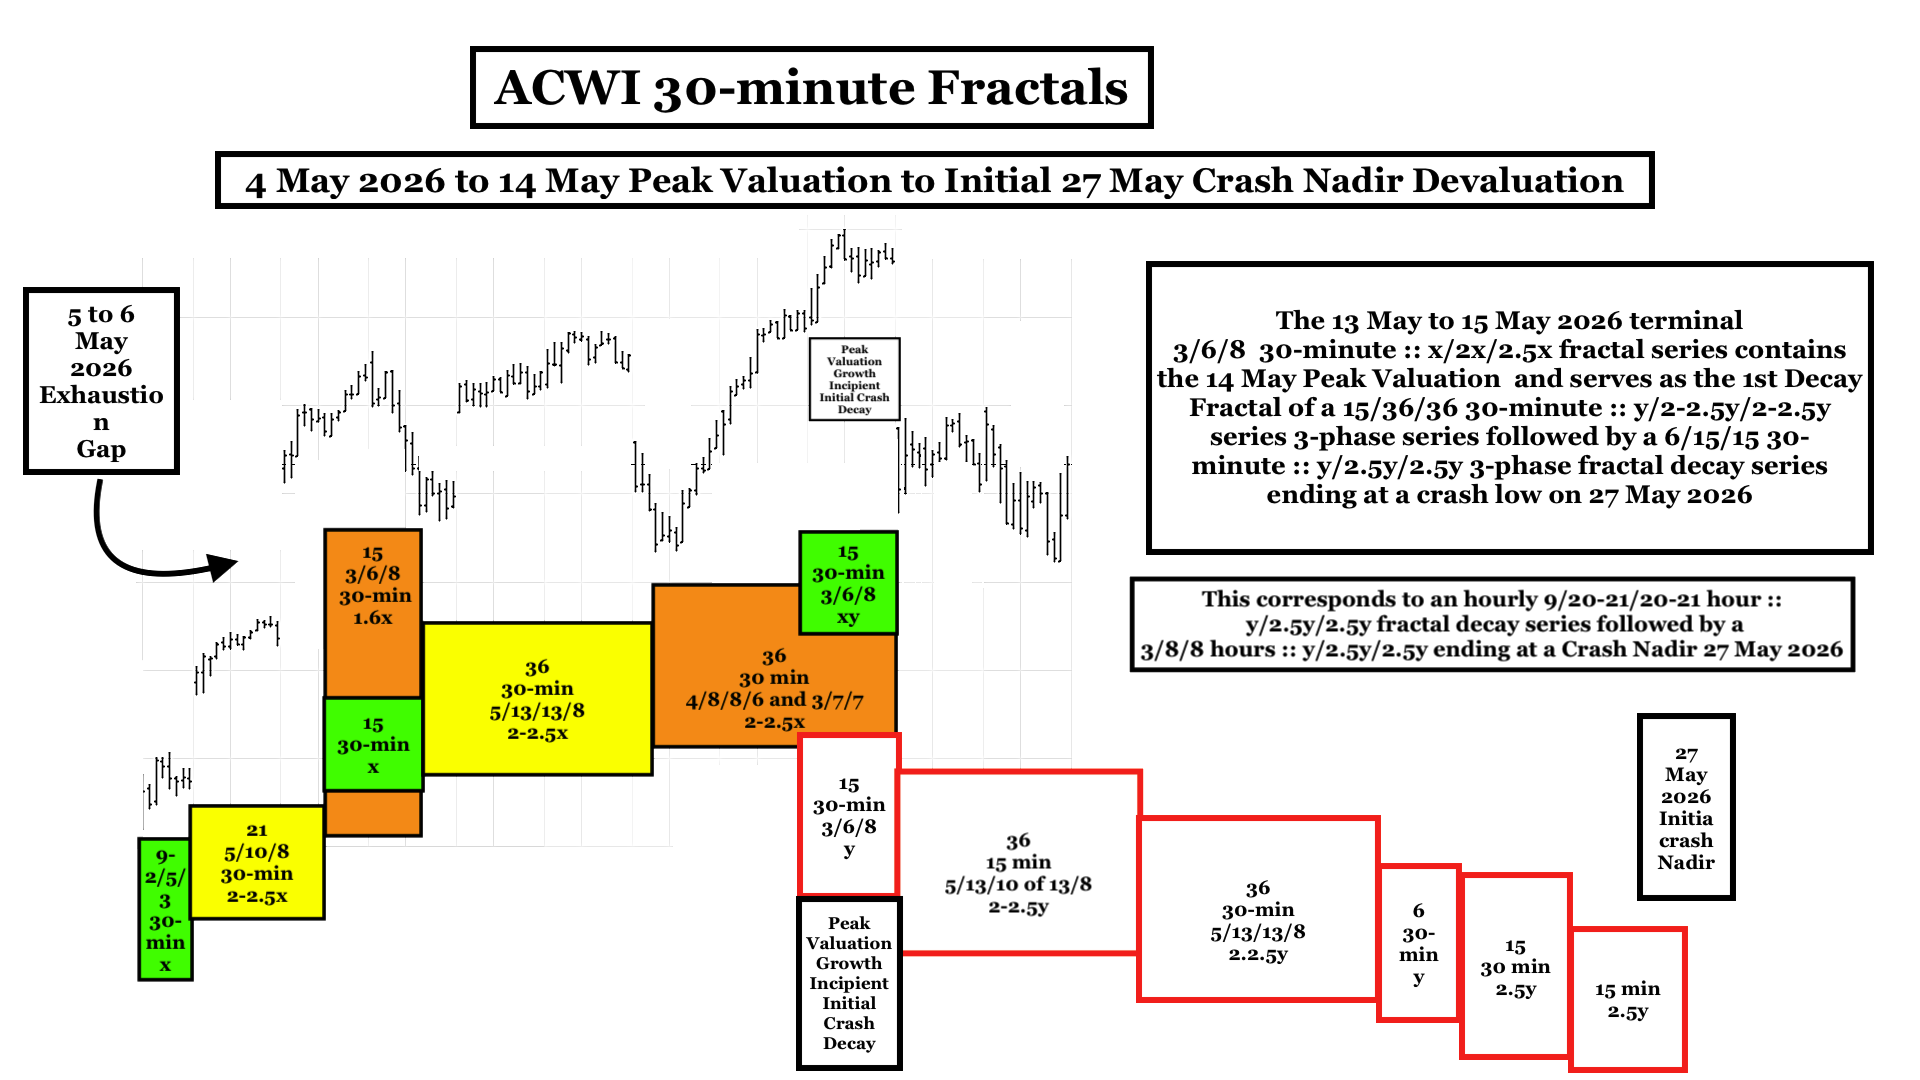
The 9-/21/15 30-minute :: x/2-2.5x/1.6x fractal blow-off is depicted in the graph above The 3rd fractal (15) 30-minute time unit serves as the base 1st fractal of a 13 to 15 May 3036 15/36/36 30-minute fractal series. The 3rd (36) 30-minute fractal ids composed of two series a 4/8/8/6 30 minute series and a 3/6/8 30-minutes. Peak ACWI valuation occurs in the 4th time unit of the (6) 30 minute 3rd fractal. The 3/6/8 series totaling (15) 30 minute units becomes the base for the subsequent 15/36/36 30-minute y/2.5y/2.5y crash decay fractal series. This is followed by an even more acutely deteriorating 6/15/15 30-minute :: y/2.5y/2.5y crash fractal decay series.
ACWI’s 1st crash hourly decay fractal series and 1st decay fractal contains the 14 May 2026 ACWI all time peak valuation. It is a 2/4/5 hour ::x/2x/2.5x fractal series and is 9 hours (vice the previous postings’ 6 hours) in length. This corresponds to a (15) 30-minute fractal series and 1st decay fractal. The apparent discrepancy is that the 7 hour per day hourly fractals actually contain only 6.5 trading hours per day whereas the 30 minute fractals contain (26) 30 minute units per day. The 9 hour time length contains two 0.5 hours units within the 9 counted hour time units.
On an hourly basis, there are two 3-phase fractal decay series starting 3:30 EST 13 May 2026 to the 27 May 2026 crash low: 9/20-21/2021 hours :: y/2-2.5y/2-2.5y followed by 3/7-8/7-8 hours :: y/2.5y/2.5y ending 27 May 2026.
The SPX 1929 initial peak to nadir valuation crash was 54 days in length according to AI and 50 days by a direct count. By AI the 1987 peak to nadir valuation crash was about 42 trading days. The 14 May 2026 Peak to Nadir valuation crash will occur over 9 trading days.
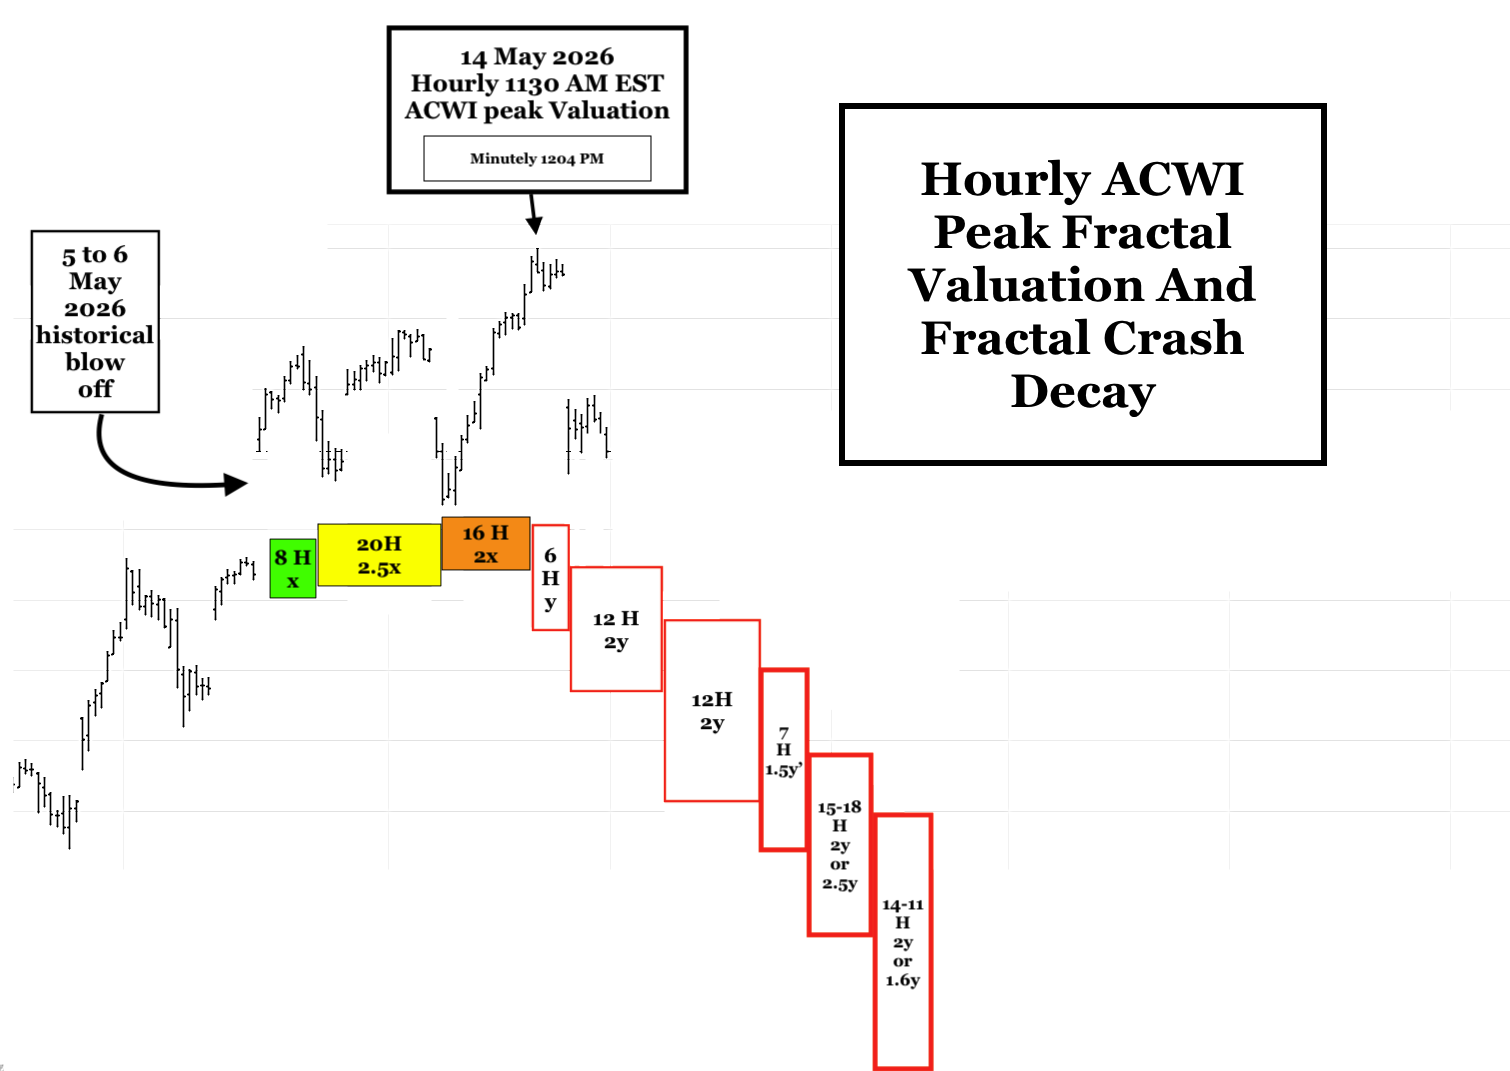
The ACWI/SPX 1130 EST 14 May 2026 to 330PM EST to 27 May 2026 Great Initial Crash is composed of two sequential hourly fractal decay series starting 1130 EST 14 May 2026:
First fractal decay series:: a 4-Phase Series: 6/12/12/7 hours :: y/2y/2y/1.5y’ {you can observe the 6 hour 1st fractal and 7 hours of the 12 hour 2nd fractal(3/4 of 6/5) on hourly SPX and ACWI charts}
Second fractal decay series: The 7 hour 1.5y’ 4th fractal
becomes the base for a final 3-phase decay series;
either a 7/15/14 hour :: y/2.5y/2y series or a
7/18/11 hour :: y/2.5y/1.6y decay series both ending on a 3:30 PM 27 May 2026 crash nadir.
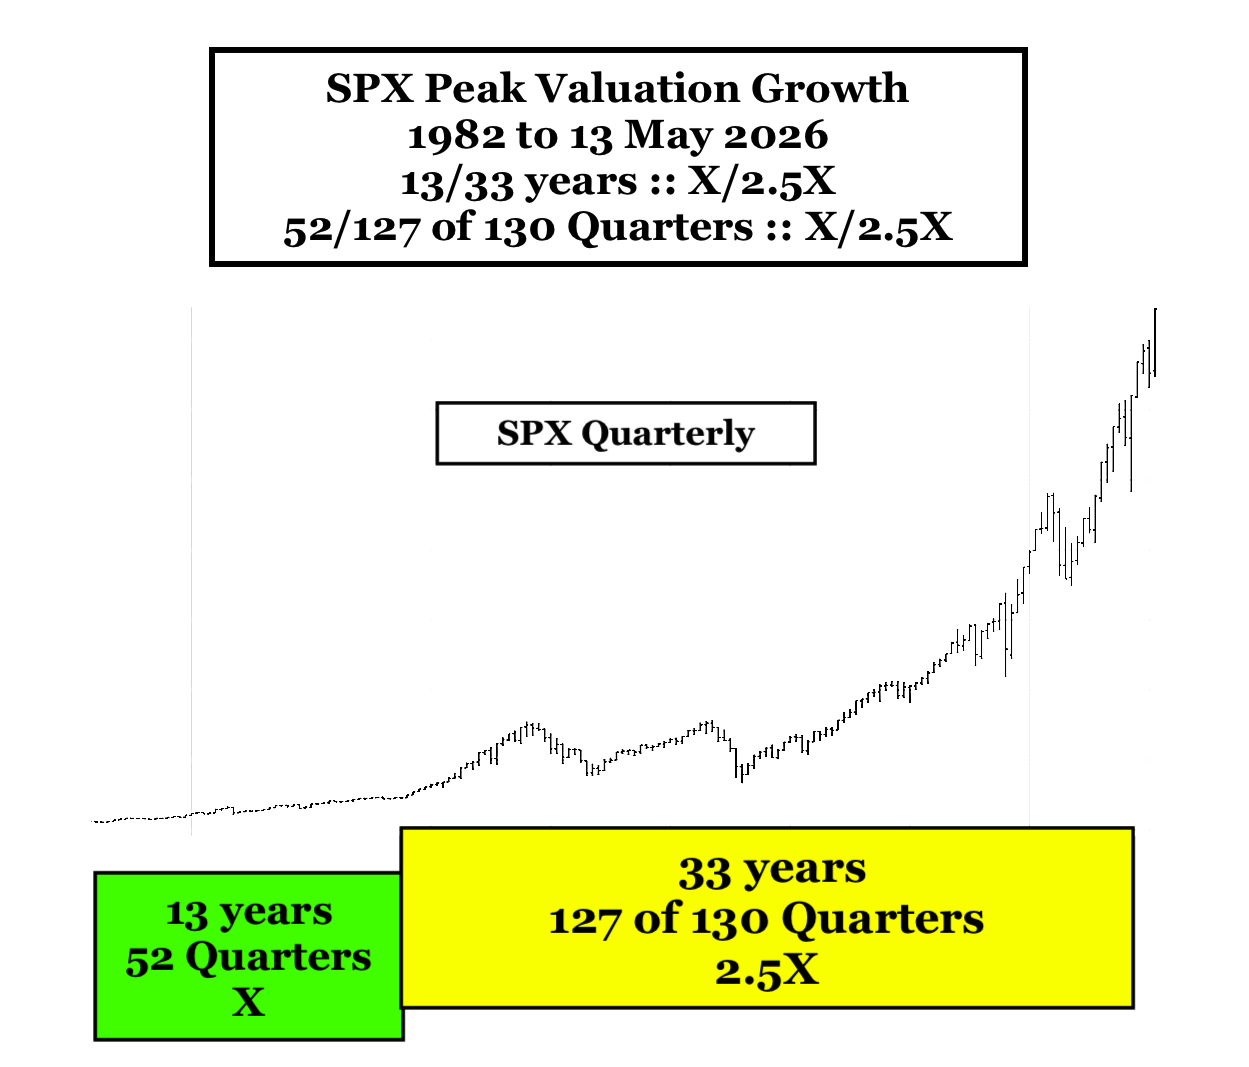
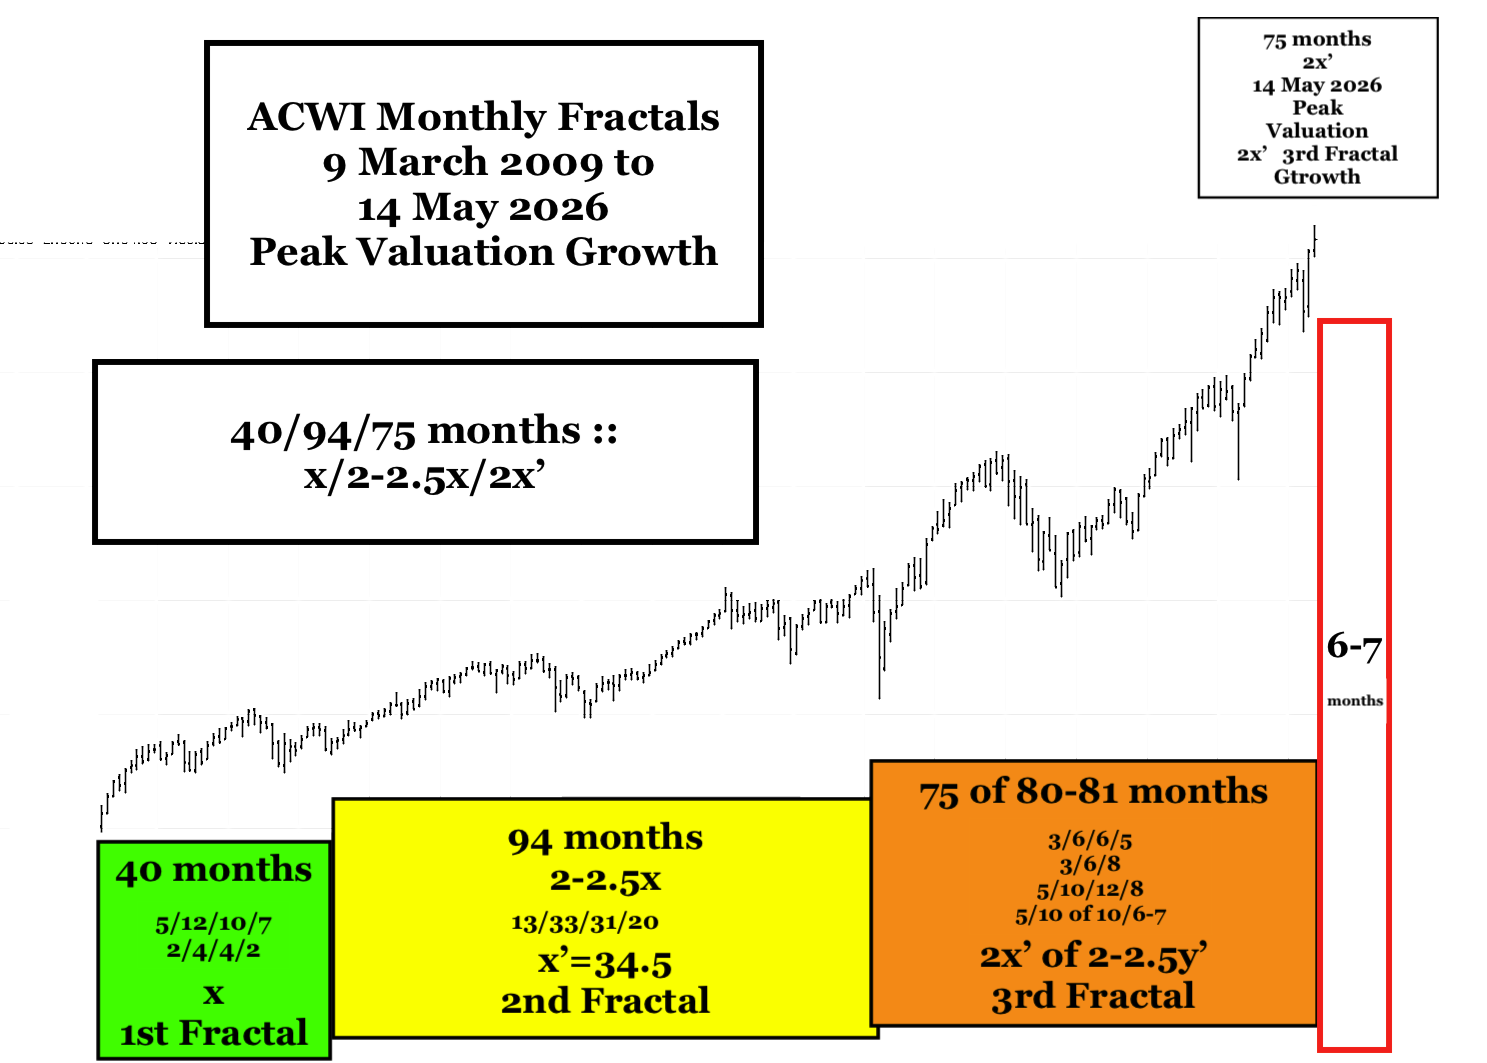
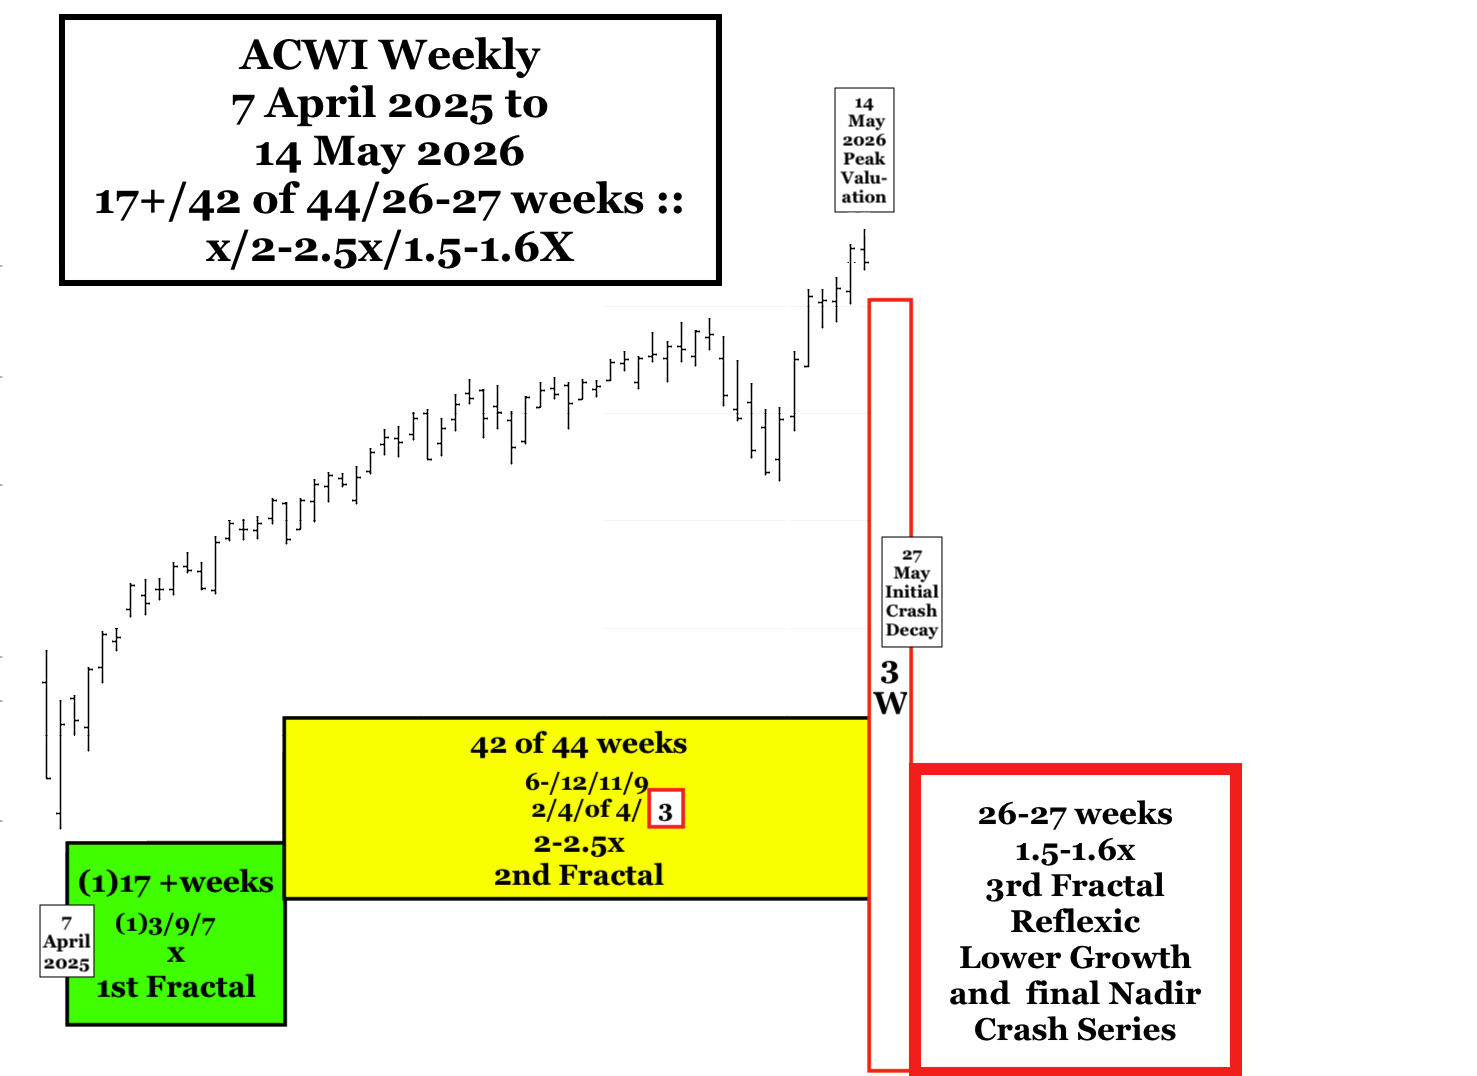
Added 17 May 2026: SPX, ACWI, Gold Proxy, and Crypto Proxy Quarterly, Monthly, Weekly Daily … Lammert Fractal Charts:
SPX:
ACWI:
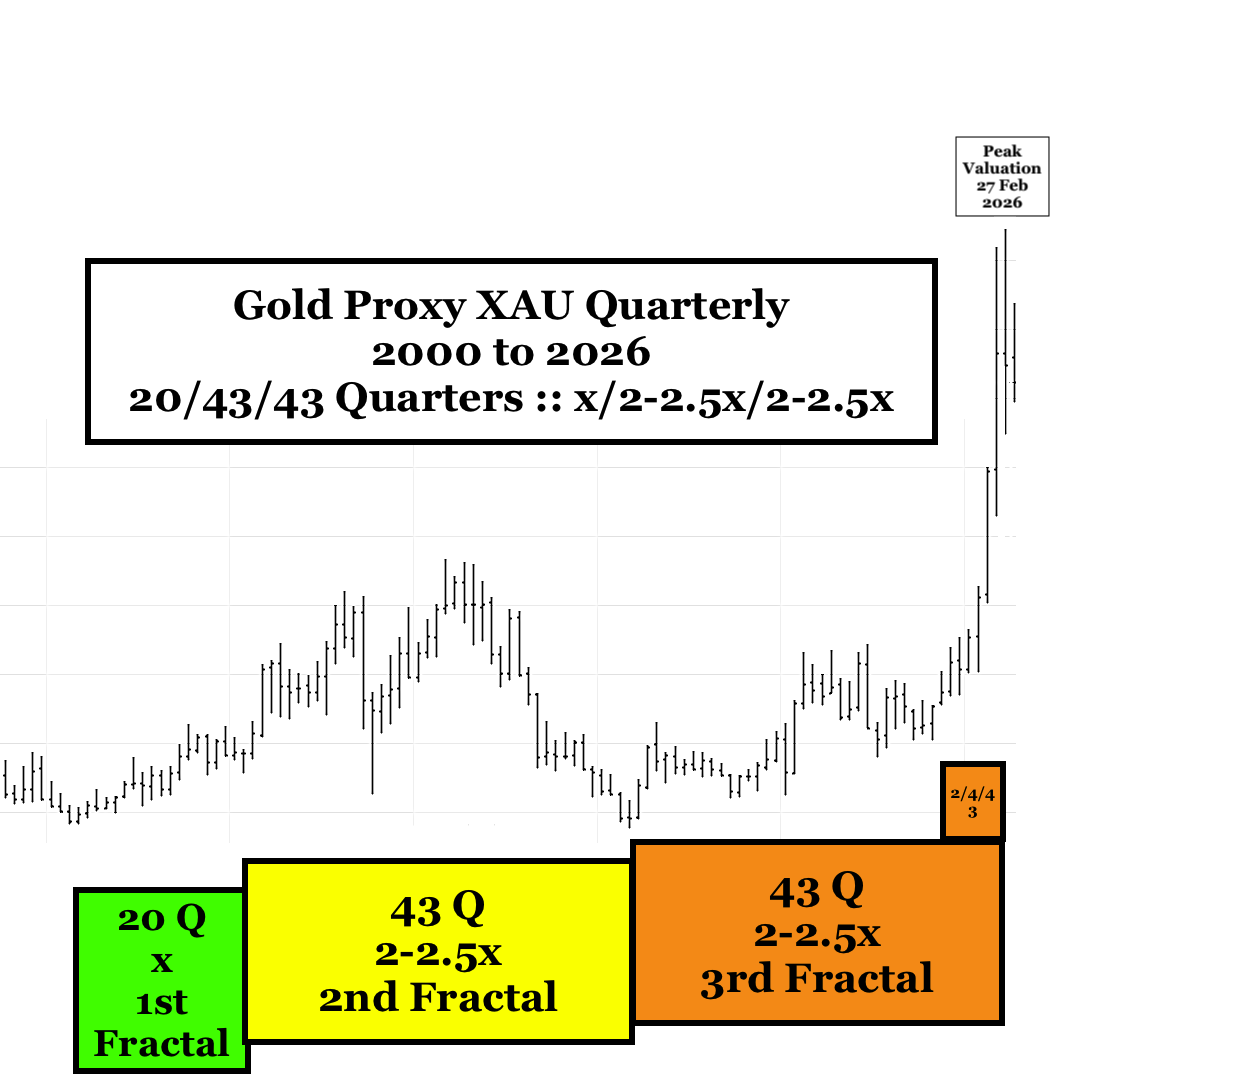
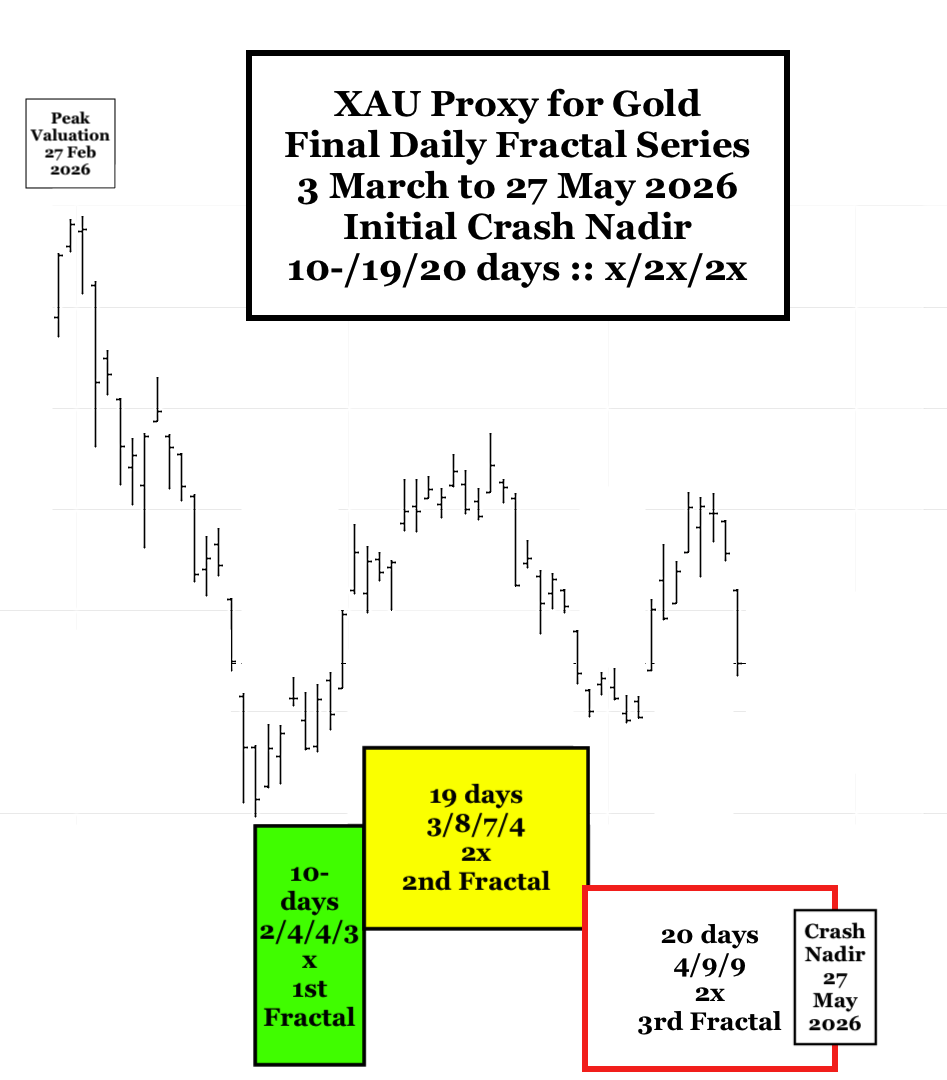
Gold Proxy: XAU
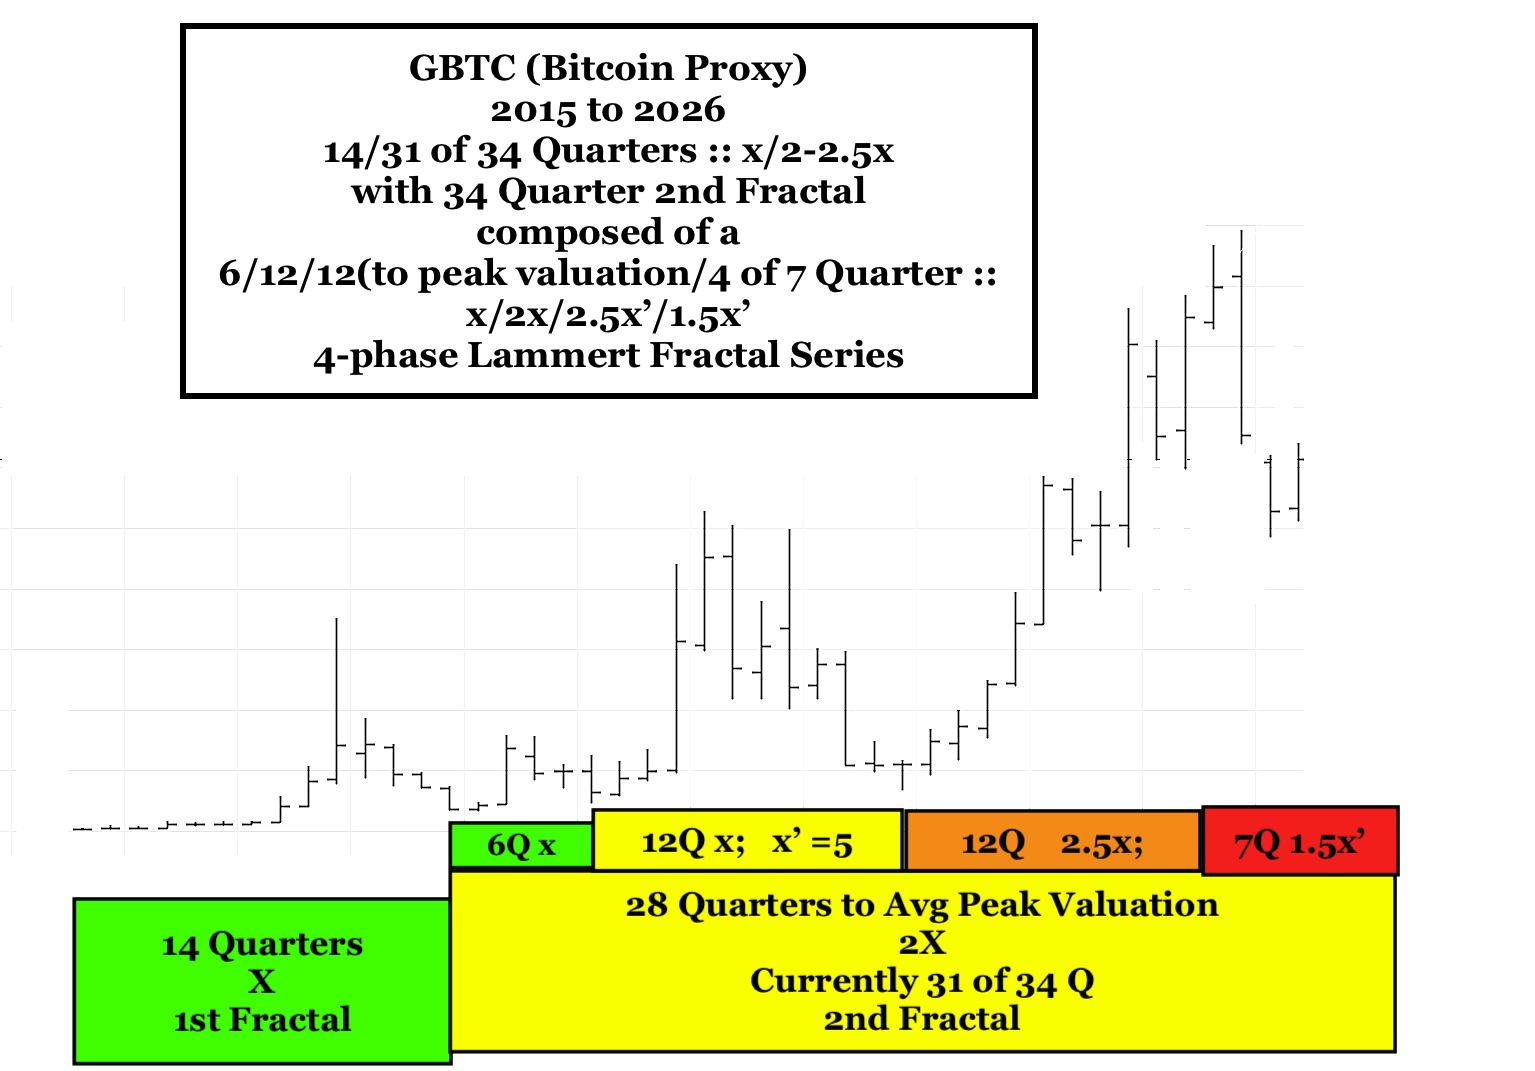
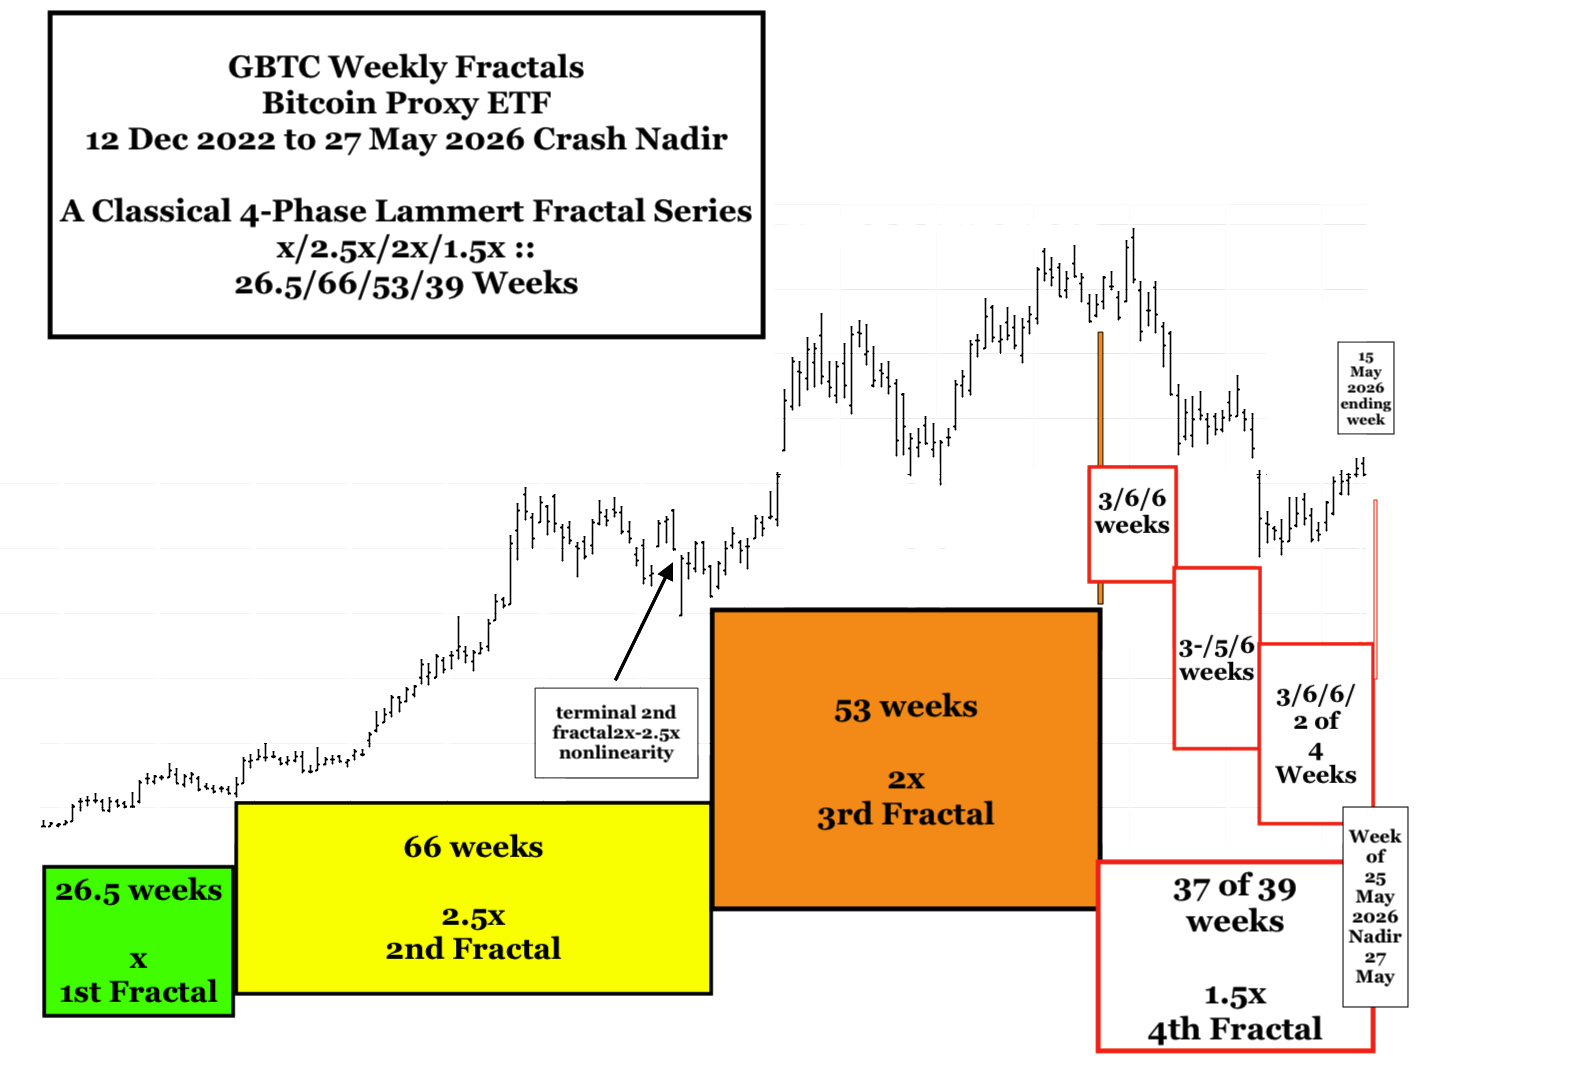
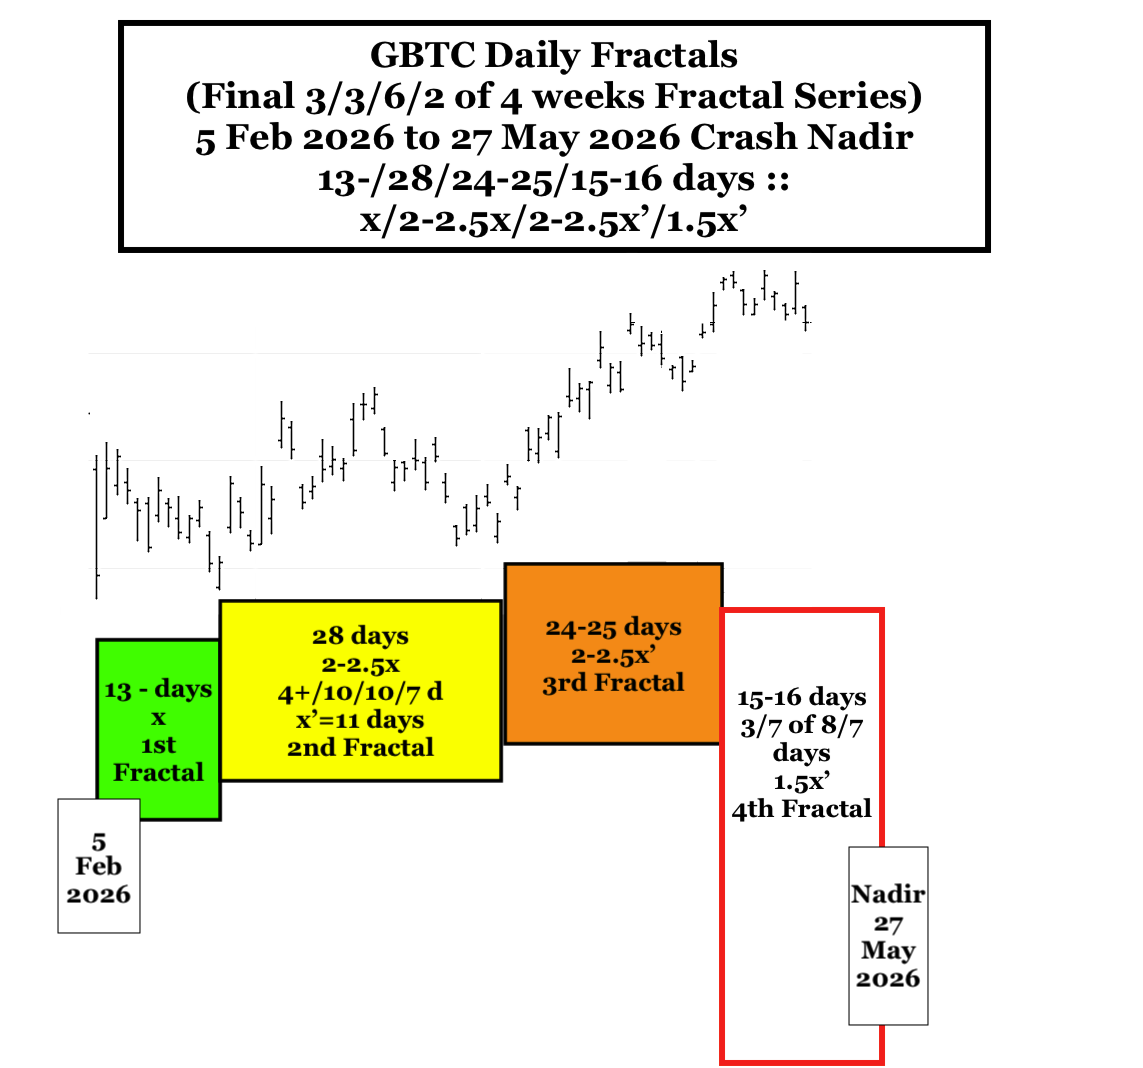
Bitcoin Proxy: GBTC