The Asset-Debt Macroeconomic system is deterministic in its time-based fractal self assembly of its composite asset valuation growth and decay.
There are two observable time based self-ordering simple mathematical fractal series: a 3 phase fractal series of x/2-2.5x/1.5-2.5x and a 4 phase fractal series of x/2-2.5x/2-2.5x/1.5-1.6x. The fractal subunits are defined by nadir valuations with the exception of the 4 phase fractal series whose 3 subunit terminus is defined by a peak valuation or lower high valuation.
For the US Hegemony, a 4 phase long term fractal series undergoing self-assembly is observable as an 1807 series of x/2.5x/2.5x/1.5x with the value x equal to 36 years. Nadir valuations occurred in 1807, 1842/43, and 1932. The 2.5x 90 year third subunit high occurred in November 2021 with an expected low in 2074 for a completed 1807 series of 36/90/90/54 years.
Interpolated in this large 1807 series is an 1981 13/32/32/20 year series ending in 2074. An abrupt ending in the 32 year second fractal of this series is expected.
QE and money printing since 2009 with enormous acceleration in March 2020 and thereafter unprecedented money supply contraction in March 2022 has set the asset grossly-overvalued system for a colossal abrupt 31-32 year second fractal nonlinear devaluation.
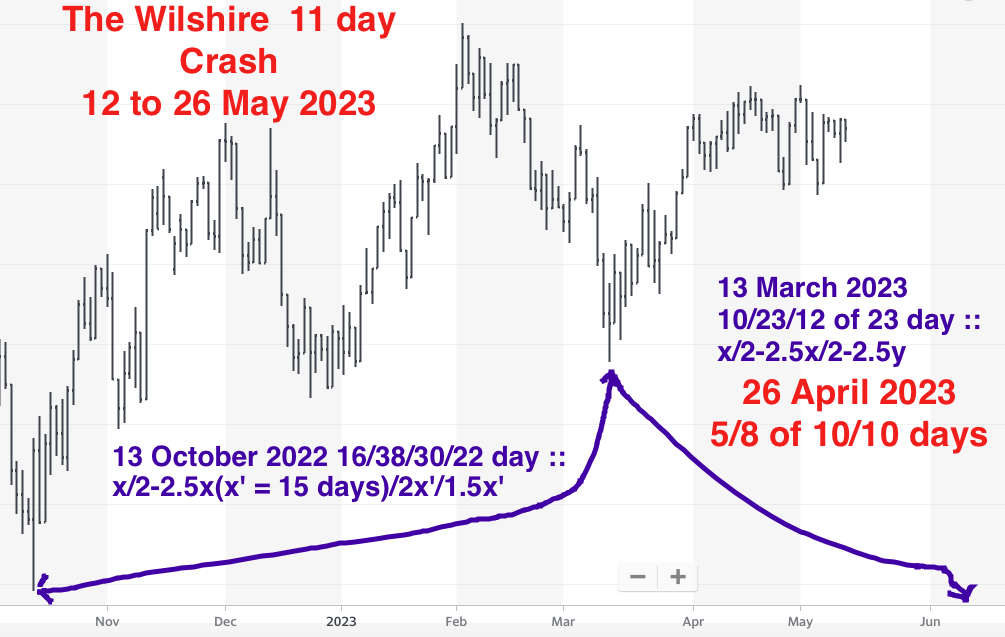
The Wilshire is following a 23 March 2020 28/71/68 of 70 week growth and decay fractal pattern with an expected crash devaluation in the next 11 trading days and ending on Friday 26 May 2023. The nadir devaluation dates defining the 28 week first and 71 week second fractals are 9/24/20 and 1/24/2022, respectively. The third fractal of 70 weeks starts on 24 January 2022 and is composed of three subseries: 7/15/18 weeks; 4/9/8/6 weeks and 2/5/3 of 5 weeks, The 4/9/8/6 week series starts on 10/13/22 and is composed of 16/38/30/22 days ::x/2-2.5x/2x/1.5x.
The final 2/5/5 weeks series starts on 3/13/2023 and is composed of 10/23/23 days. The final 23 day third fractal starts on 4/26/2023 and ends on 26 May 2023.
An additional 42 week lower low series would complete a 1993 – 2024 32 year second fractal and a March 2020 28/71/70/42 week series. Rapid lowering of fed fund rates are expected after the crash devaluation.
There is a mathematical fractal case for an interpolated 1981-82 13/30 year first 13 year base fractal and 30 year second fractal major terminal nonlinearity. This interpolated series is contained within a larger US hegemonic 1807 36/90/90/54 year :: x/2.5x/2.5x/1.5x fractal series with lows in 1807, 1842-43, 1932, and 2074 and a 90 year third fractal high in November 2021.
Both the French CAC and Wilshire are following a x/2.5x/2x/1.5x :: 15/37/30/22 day fractal series starting 12/30/2022 and 12/28/2022 (trading holidays account for the difference of starting dates.) The CAC reached its all time average day valuation high on 4/24/2023, day 30 of the series’ third fractal. The Wilshire’s valuation peaked earlier on 8 November 2021. Both composites are following a March 2020 low 33/66/66-67 week :: x/2x/2x high/lower high valuations. From its 4/24 peak valuation the 22 day 4th decay fractal appears to a 4/21/2023 4/9/7/6 day series with the Wilshire a trading day ahead of the CAC. The Wilshire is currently on day 7 and CAC currently on day 6 of the 9 day second fractal. The 7 day third fractal can be expected to be a valuation increase lateral and upward. The final 6 days would be trade nonlinearly lower with some short counter rallies.
From 1981 to 1993 there is a 10/26/16 quarter first base fractal series totaling 50 quarters. (the 1987 crash was quarter 11, the end of a second sub-fractal of a 26 quarter 5/11/12 quarter series)The 30 year second fractal is composed of 4 sub-series: 1994-2002: 34 quarters: 3/8/6/4 (18) and 3/8/8 (17) 2002-2009: 27 quarters: 3/7/8 (16) and 2/5/5/3 (12) 2009-2016: 29 quarters: 2/5/4/3(11) {(6) composed of a 3/6/8 month fractal series)} and 3/7/6 (14) 2016 to 2024 32 quarters: 4/8/6 (16) 3/7/6/?4 (17)
The total quarters for the first and second fractals are currently 50/116 pacing the timing between 2x and 2.5x (100 and 125) of the second fractal, where terminal nonlinearity could result in 50 percent valuation losses with a lower low valuation in 4 quarters (2024).
This quantitative asset-debt system mathematical fractal model has the appeal of internal consistency.
Over the next 3 weeks and 15 trading days, basic use and precious metal commodity prices, cryptocurrencies, and global equities will undergo a severe crash devaluation reflecting both the historical money supply increase in the covid QE period and the subsequent consumer inflation central bank QT response with historical draconian money supply contraction. Only in the 1930s has money contraction occurred to this degree.
An average total asset growth and decay series from the March 2020 low of 28/70/67 of 70/42 weeks :: x/2.5x/2.5x/1.5x is undergoing self-assembly.
This will complete the first and second fractal of an interpolated 1982 13/31/31-32/20-19 years series, which is part of the US hegemonic 1807 36/90/90/54 year series with a low in 1842/43, a low in 1932, and a third fractal high valuation in November 2021.
Expect rapid lowering of Fed Funds interest rates after the crash.