US long term debt instruments reached an inter-day low of 0.4 pc on 9 March 2020 and have risen to a high of 4.997 pc on 23 October 2023. The US central bank is simply allowing supply and demand market forces to apply QT to an overheated economy fueled by printed money, 2 plus trillion dollars of covid savings, and covid forbearance of payments on US MBS related mortgages and US-lended college debt. Covid savings and easy forbearances on debt payments are expiring or have expired. Outstanding credit card debt, subprime automobile debt, and student loan debt make it difficult for further private debt expansion for the masses in the US consumer based economy.
The current fractal pattern of the US Ten Year Note interest rates, in conjunction with the monthly, weekly, and daily fractal patterns of global equity, gold, commodity, and cryptocurrencies provide predictive guidance for the 2023 interim crash low for the non-debt asset entities.
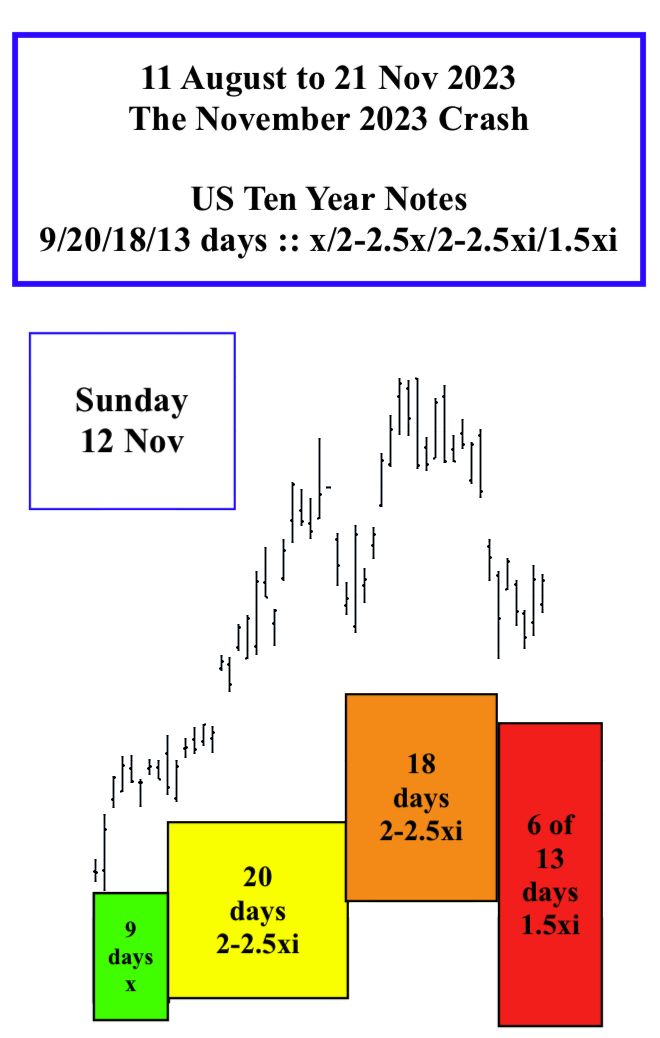
After completing a March 2020, 7/16/17 month :: x/2-2.5x/2-2.5x fractal growth series, US Ten Year interest rates have self ordered into an observable 2/4/4 month fractal growth pattern. On a weekly basis this 2/4/4 month growth fractal is composed of two fractal series: 5/12/7 weeks :: x/2.5x/1.5x and 3/8/3 of 6 weeks :: x/2.5x/2x. The daily fractal series from 5 April 2023 is 21/52/32 days correlating to the 5/12/7 week fractal series and 14/32/ 11 of 25 to 26 days correlating to the 3/8/3 of 6 week fractal growth series. The daily fractal series for US Ten Year Note interest rates are depicted in the image below.
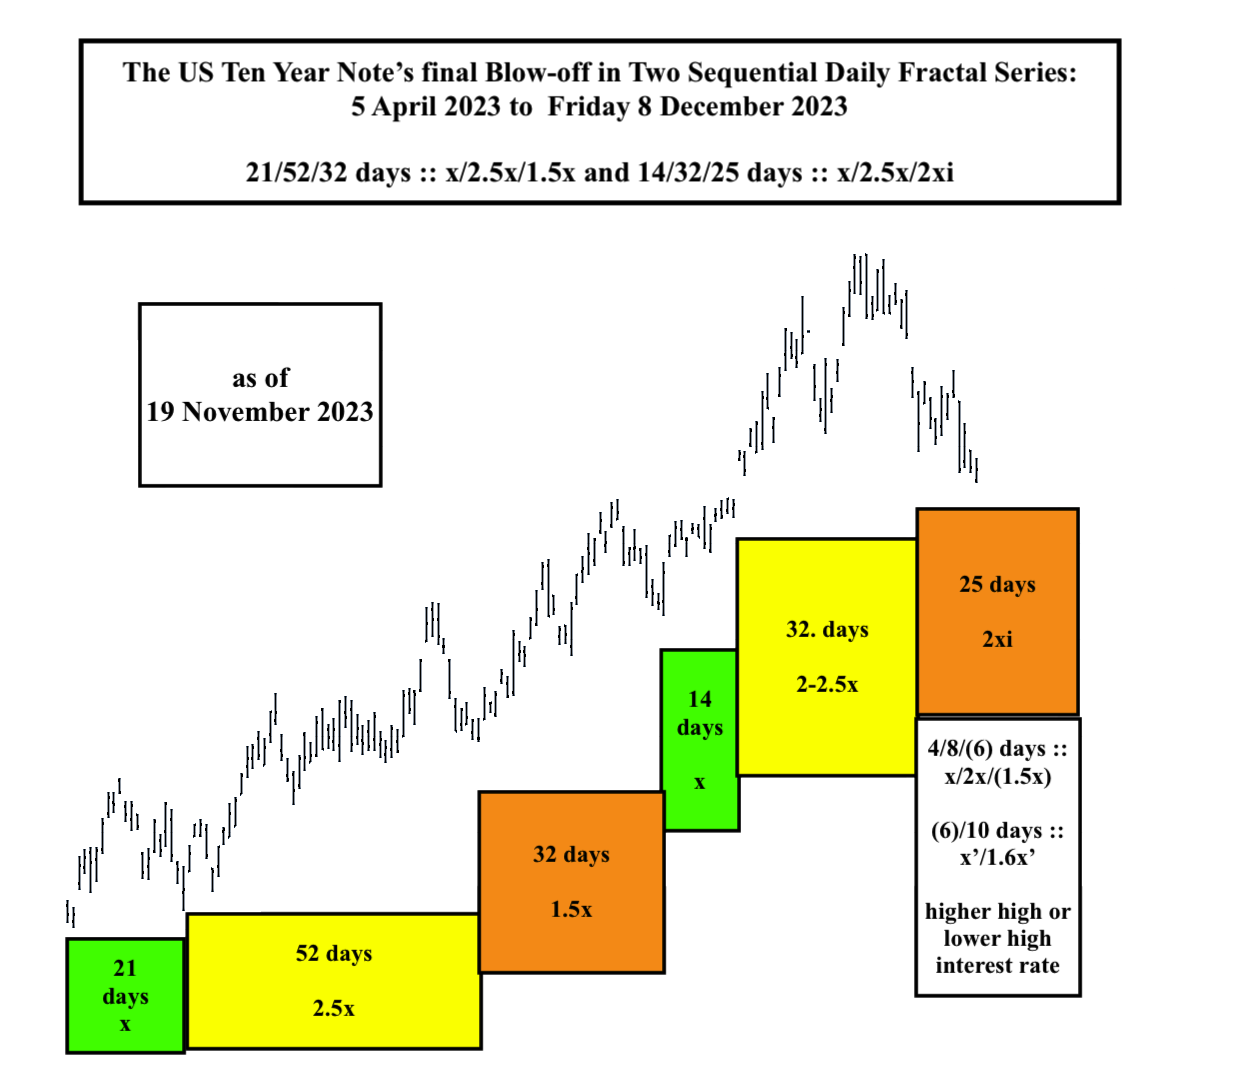
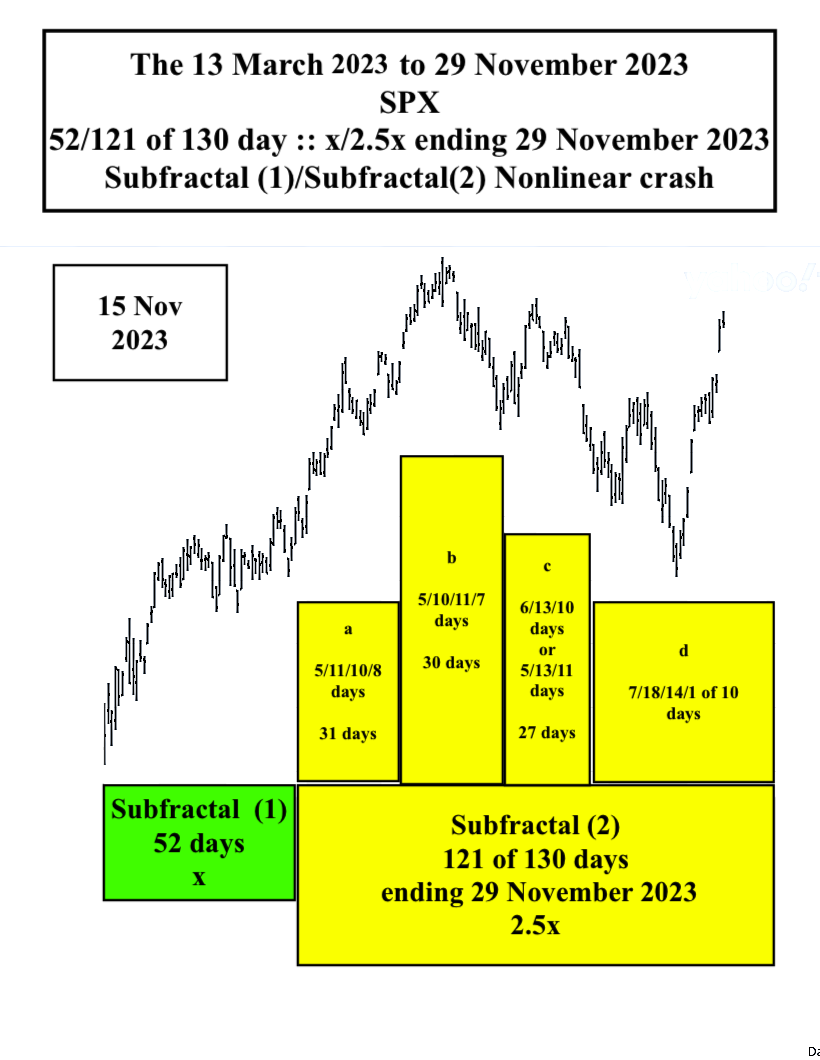
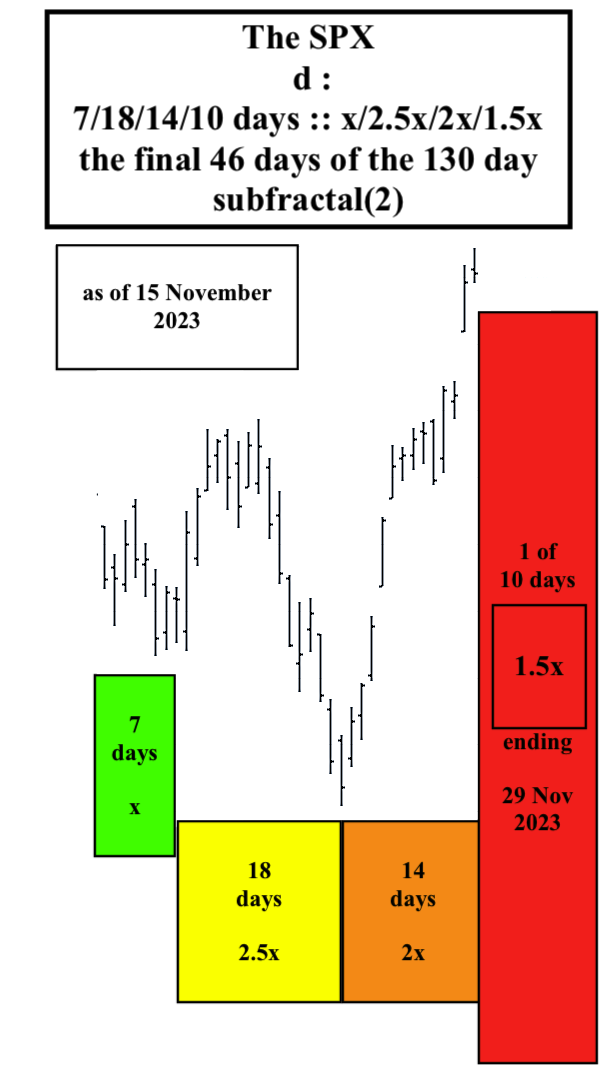
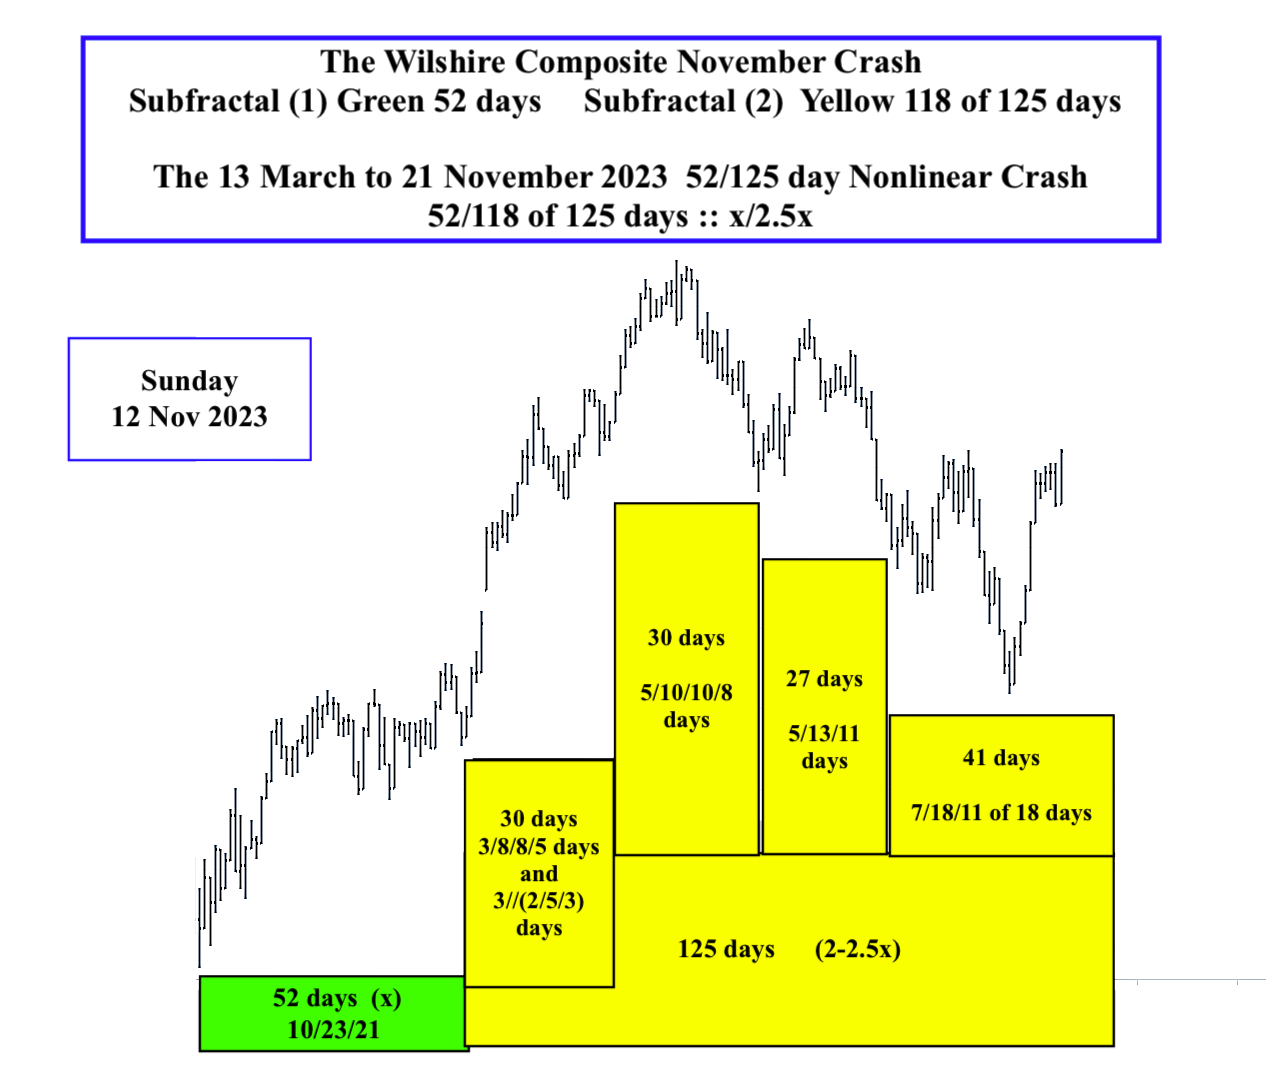
The beginning nadir month of a monthly fractal series contains 4 weeks in it and the beginning nadir week of a weekly fractal series contains 5 days which must be added to the daily subfractal (1) series. For the SPX , 5 down days in the first weekly is added to the 52 day 13 March 2023 to 24 May 2023 subfractal (1) for a total of 56 days {56 vice 57 days because the fifth day of the 5 days contained in the first week down is same as the first day of the subsequent 52 day subfractal(1) series). 8 December 2023 would complete a 56/139 day :: x/2-2.5x subfractal(1) and subfractal (2)series. If the final lower high for the US Ten year note was on day 26 of a 14/32/26 day series 11 December 2023, would complete a 56/140 day series.
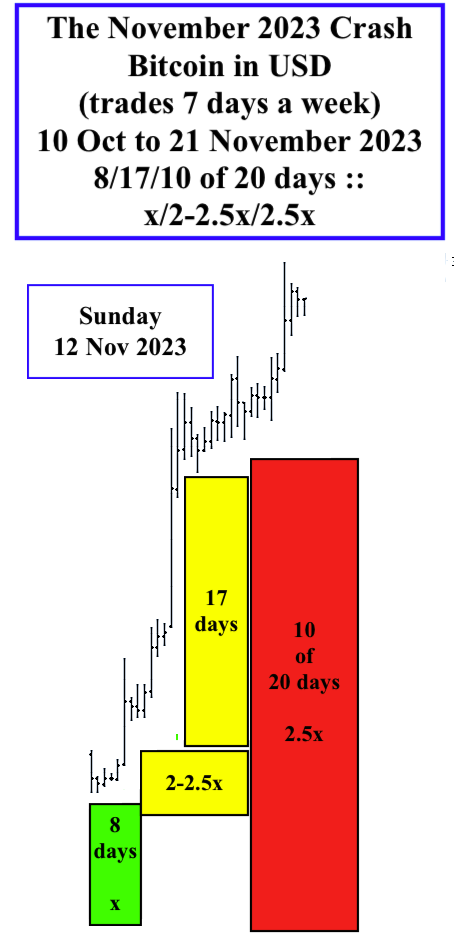
Bitcoin in USD final daily series(trading 7 days a week) appears to be self-assembled into an 11 October 2023 10/25/25 day fractal series ending on 8 December 2023. Ford is appears to be self-ordered as a 24 May 2023 19/47/47/14 of 28 to 29 day :: x/2.5x/2.5x/1.5x fractal series ending 8 December or 11 December 2023.
Added 20 November 1030 PM EST
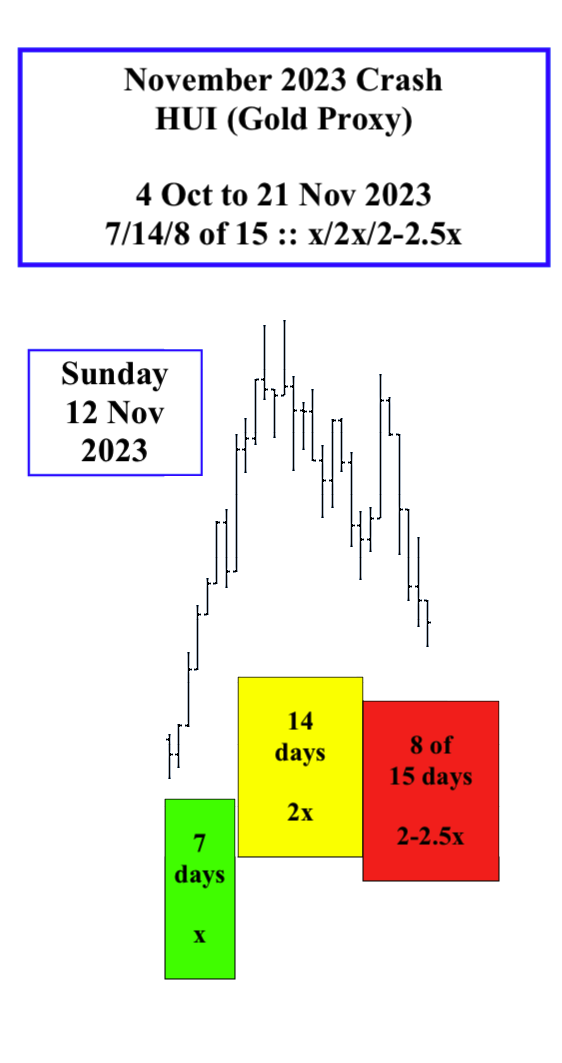
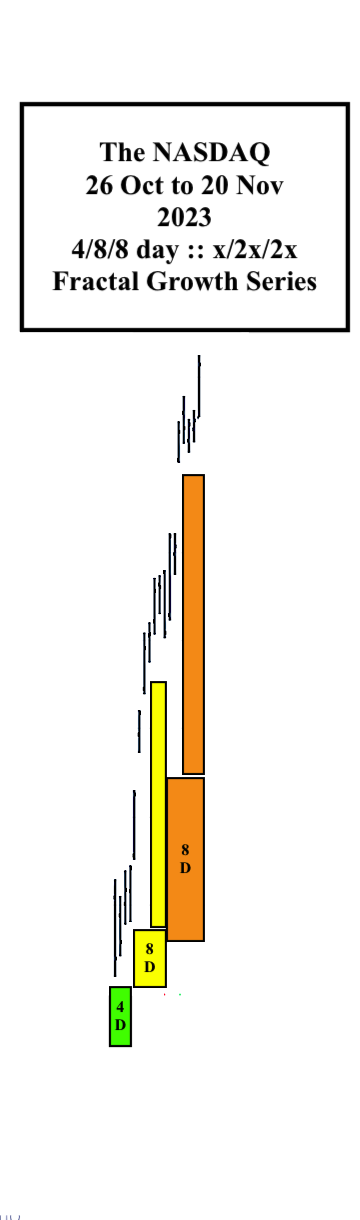
All global equity markets, commodities, gold and cryptocurrencies will undergo a major nonlinear devaluation over the next 13-14 tradings days (13 days for the US considering the holiday) with a current target low date of 8 December 2023. All the major indices have had secondary lower peak valuations with 26-29 October 2023 3-4/7-8/7-8 day final blow-off growth fractal series. For the US NASDAQ, this was a 26 October 2023 4/8/8 day :: x/2x/2x fractal growth series with a 20 November peak valuation slightly lower than its earlier 19 July 2023 high (which is the secondary high to its all-time November 2021 high. See below:
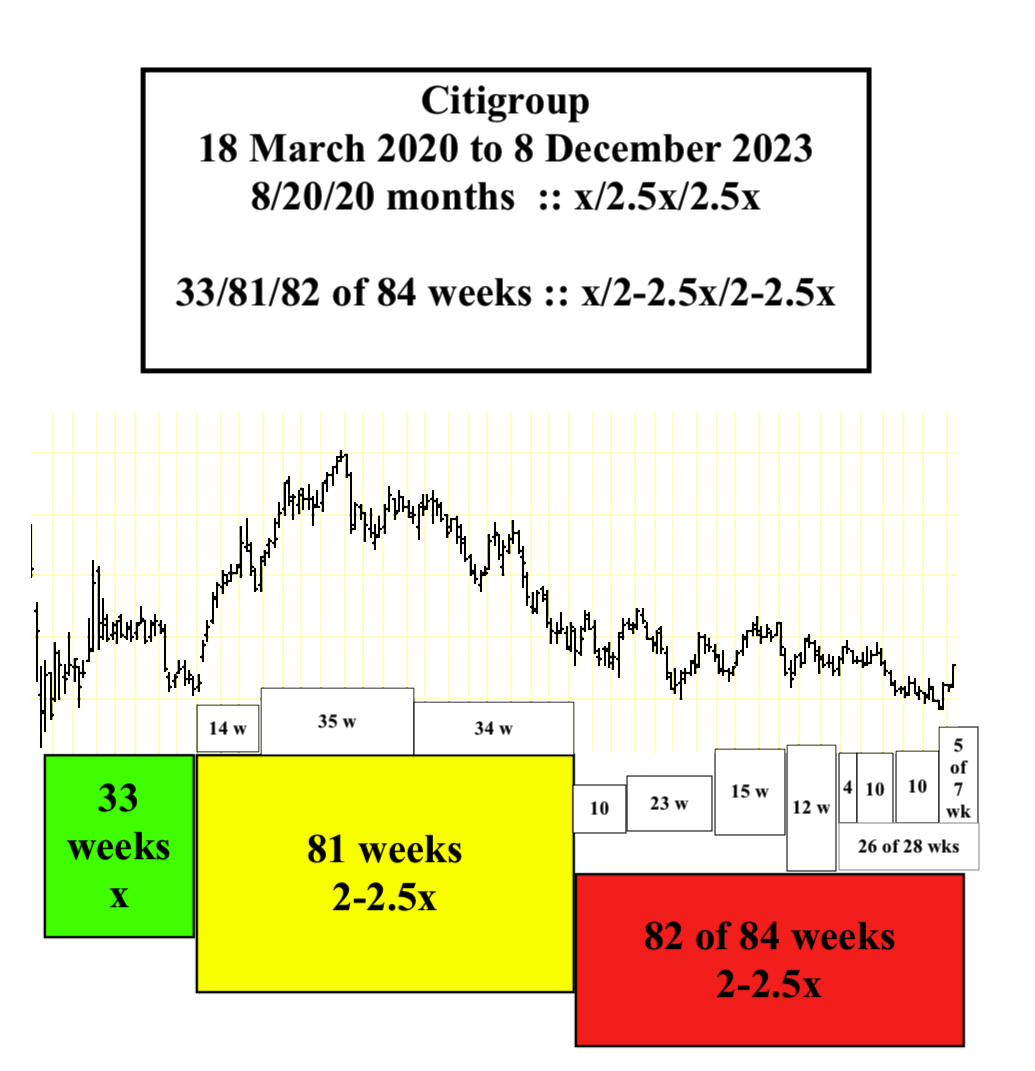
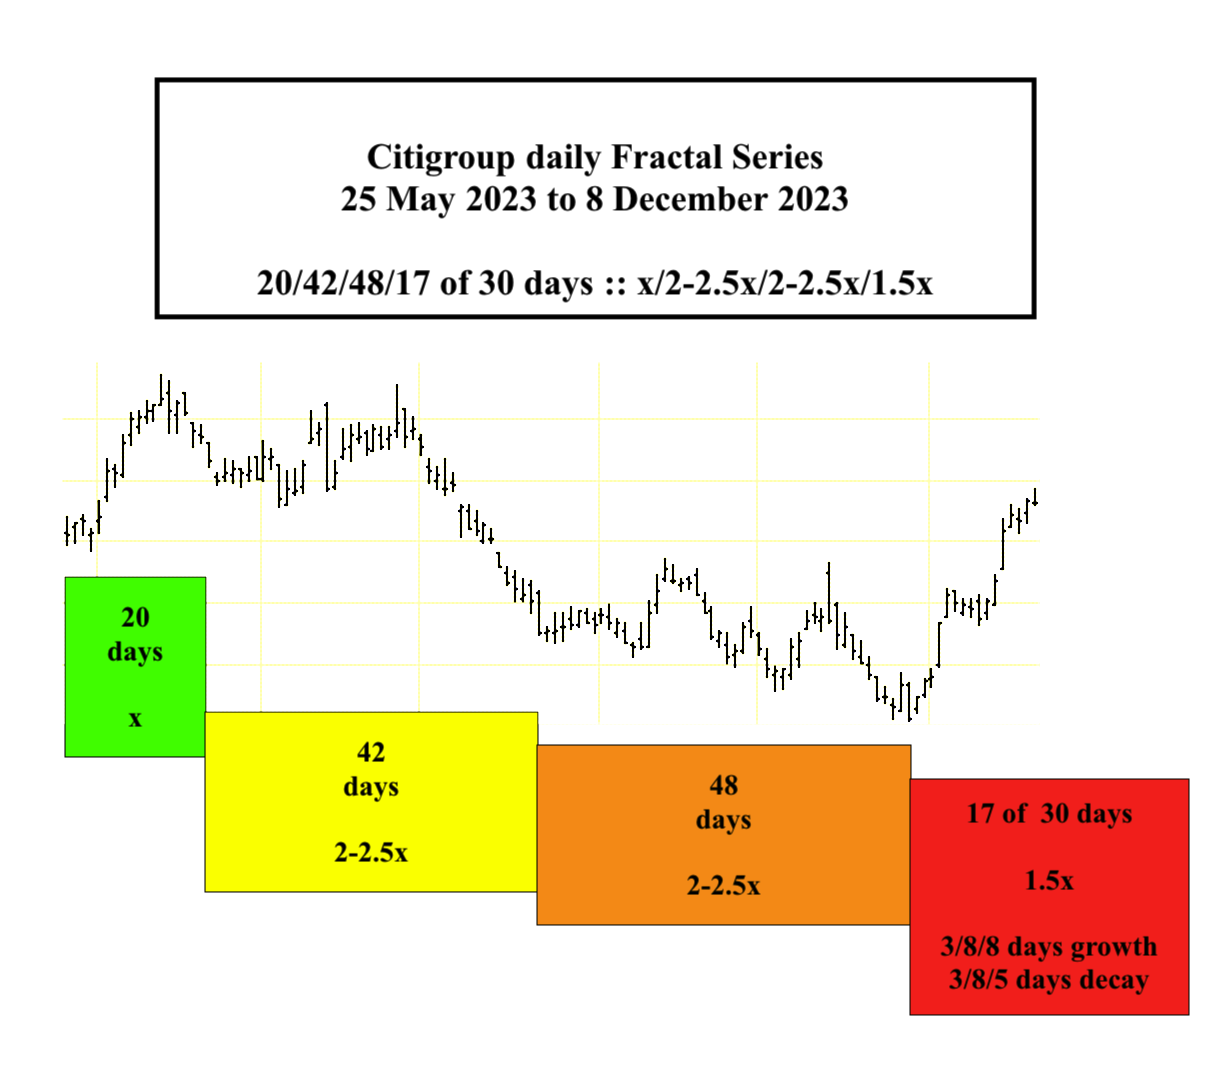
For Citybank its March 2020 to 8 December 2023 current 8/20/19 of 20 month :: x/2x 2x fractal series and 25 May 2023 current daily fractal series are depicted below.