360% total 2022 US total debt to 2022 US GDP is one thing with US fed fund rates at near zero percent; but something quite different at a 10-11 month rapidly ratcheted 4.25 to 4.5% US fed funds rate.
The reactive large quantum raises by US and western central banks to control consumer inflation have acted akin to repetitively placing sequentially heavier 300, 600, 900, 1200 et. al. pound bags of straw on an aged overly-debt burdened osteoporotic Camel’s back.
The global asset debt macroeconomy and its assets’ valuations and the massive US 0.6 quadrillion dollar derivative positions involving those assets (and subject to margin calls) represent the integrated ingredients a nonlinear system. Expect a sudden and dramatic nonlinear decline in asset valuations.
Is the system patterned and can the nonlinearity of asset valuations be predicted?
Saturation Asset-Debt US 2008 QE/QT Global Macroeconomics …
The incipient 54 year fourth fractal nonlinear devaluation of a US hegemonic 1807 36/90/90/54 year cycle … with a 90 year (from 1932) high valuation (the US Wilshire 5000 and Bitcoin in US dollars) on 8 November 2021.
As Meta goes, so goes the global US QE/QT Asset-Debt Macroeconomic System: 3 November 2022 5/13/13/3 of 7 days.
Most of the US central bank excessive debt and money creation since the 2007-2010 global real estate collapse has flowed into the US financial sector and to a much lessor extent to foreign sovereign manufacturers which has also benefited US corporation sellers of those manufactured goods and again the financial sector. US corporations have used those easy profits from the QE easy money programs for stock buy-banks, elevating the wealth of corporate leadership.
This has resulted in a extremely overvalued financial sector whose financial engineering of collateralize derivates of asset products represents at best a landscape of Evergrande-built decaying Chinese high rises constructed without plumbing, elevators, and electricity. It is a quadrillion dollar house of cards which leaves the global asset-debt system exposure to instantaneous liquidity problems and nonlinear valuation collapse. An observable large black swan paddles in the pond awaiting flight …
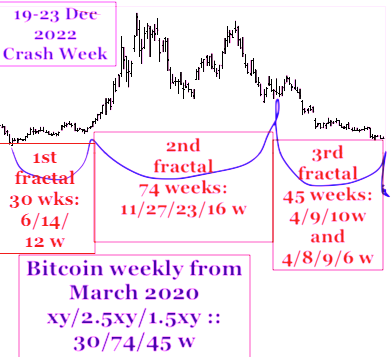
November 2021 represented a March 2009 31/62/62 month :: x/2x/2x three phase fractal valuation maximum growth high for the Wilshire and Bitcoin in US dollars.
November 2021 represented an 1807 three phase fractal 36/90/90 year ::x/2.5x/2.5x maximum valuation high for the US equity market and its progenitor earlier tradable exchange systems.
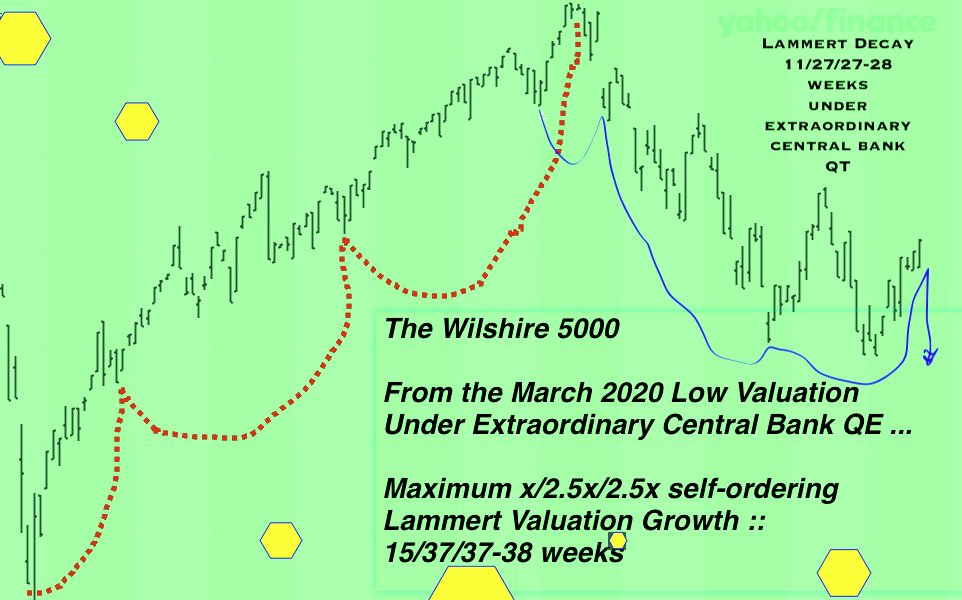
November 2021 represented a March 2020 three phase fractal 15/37/37-38 week :: x/2.5x/2.5x maximum asset valuation growth for the Wilshire composite. Because money was both given directly to the real economy wage earners during this new phase of pandemic QE and because there were supply shortages and political constraints on domestically produced energy, real consumer inflation occurred this cycle prompting central bank unprecedented rapidly accelerating QT.
The elegance of the asset-debt system is in its efficient self-assembly mathematical asset valuation time-based fractal growth and decay process, Valuation decay begins and is integrated in he time period of terminal valuation growth.
The quadrillion dollar asset derivative house of cards created by unregulated financial engineering is ripe for a nonlinear liquidity crises causing nonlinear devaluation of the entire asset-debt system ….
A possible three phase y/2.5y/2.5y fractal decay pathway is shown below in BLUE. :: 11-12/27/27-28 weeks (while maximal weekly growth in shown in RED)

