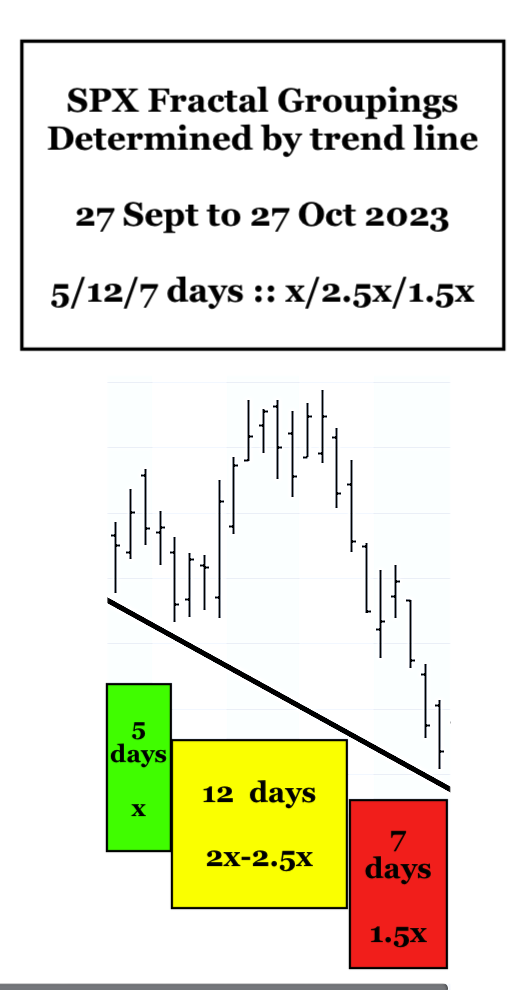
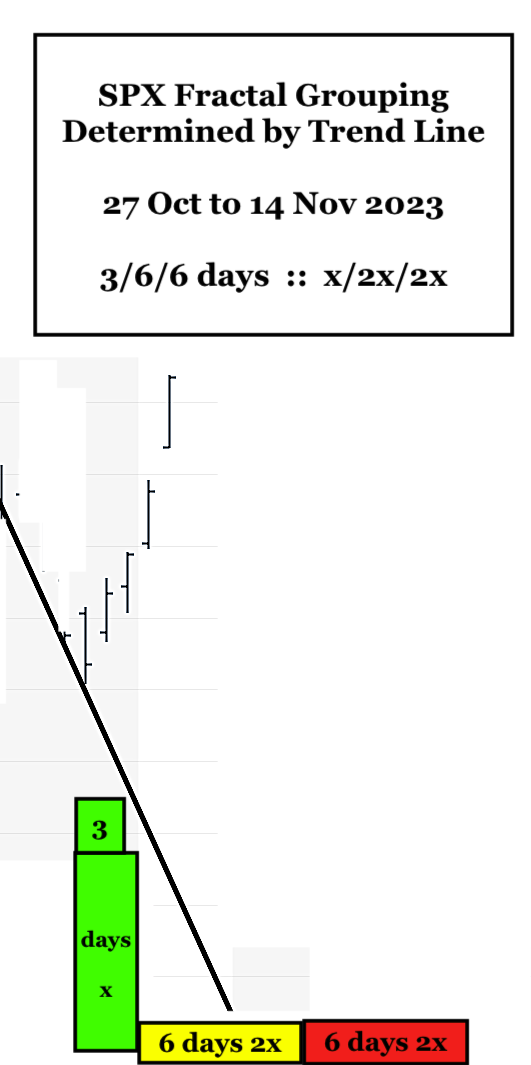
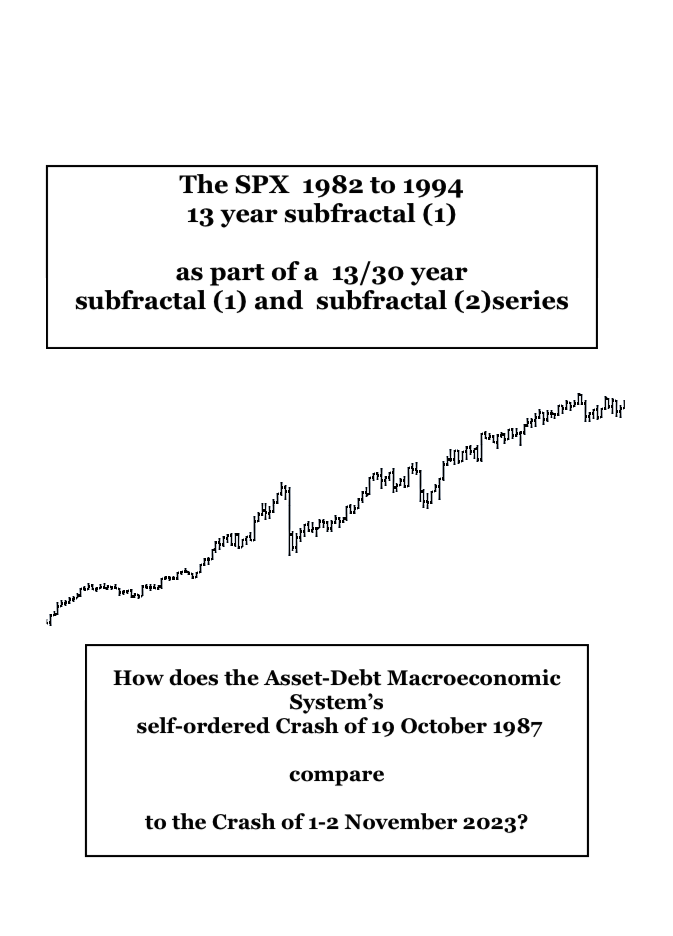
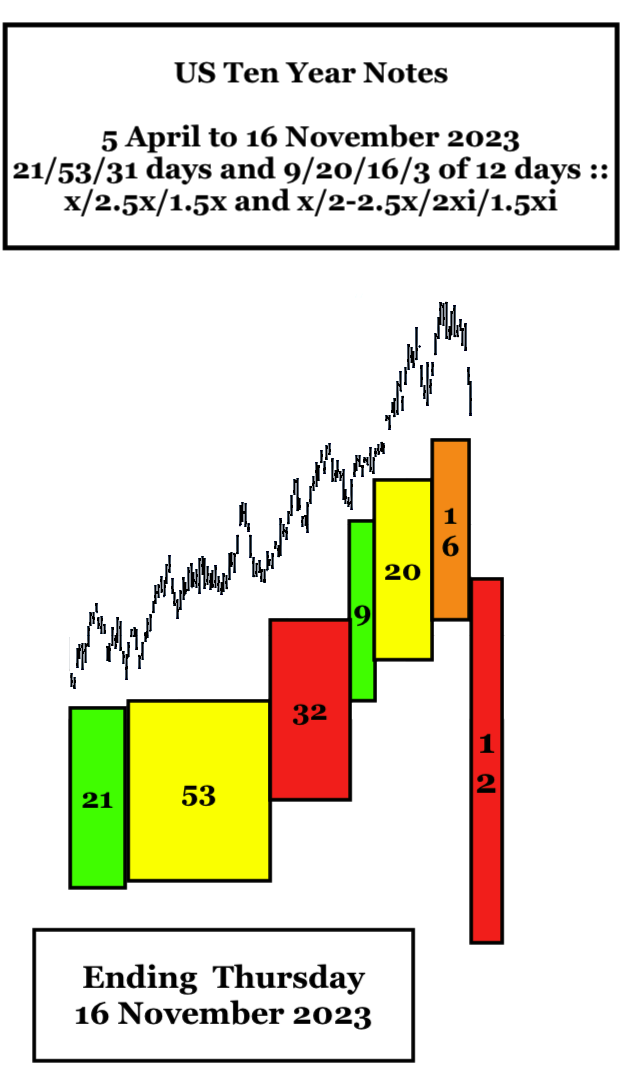
Not all global asset valuations will crash. Recent buyers of US bonds and US Notes will see great valuation increases in purchased sovereign debt as those investment instruments will undergo quantum fractal lower interest rates – to the 16 November 2023 composite equity. gold. commodity, and crypto low valuations. Money exiting those assets sold by the smarter speculators/AI programs will enter the US debt market driving interest rates down. The inverse Sovereign Debt fractal series, ie, Bond and Note interest rates, are following a 4-Phase Lammert x/2-2.5x/2xi/1.5xi collapse where xi is the ideal subfractal 3 and subfractal 4 whose ideal xi time length is determined by dividing the time length of subfractal 2 by 2.5. In the current case a 31 August 2023 9/20/16/3 of 12 day 4-phase Lammert fractal series ending 16 November 2023 is operative(self-assembled by the asset-debt macroeconomic system) where xi is 8 days, that is, 20 days divided by 2.5. This fractal series occurred after a self-ordered fractal series starting 4 April of 21/52/32 days :: a x/2.5x/1.5x series ending 31 August 2023.
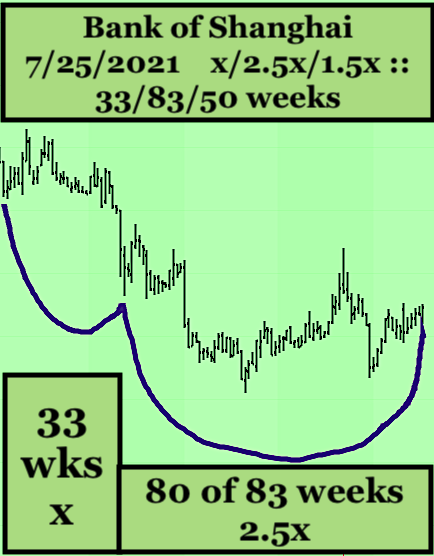
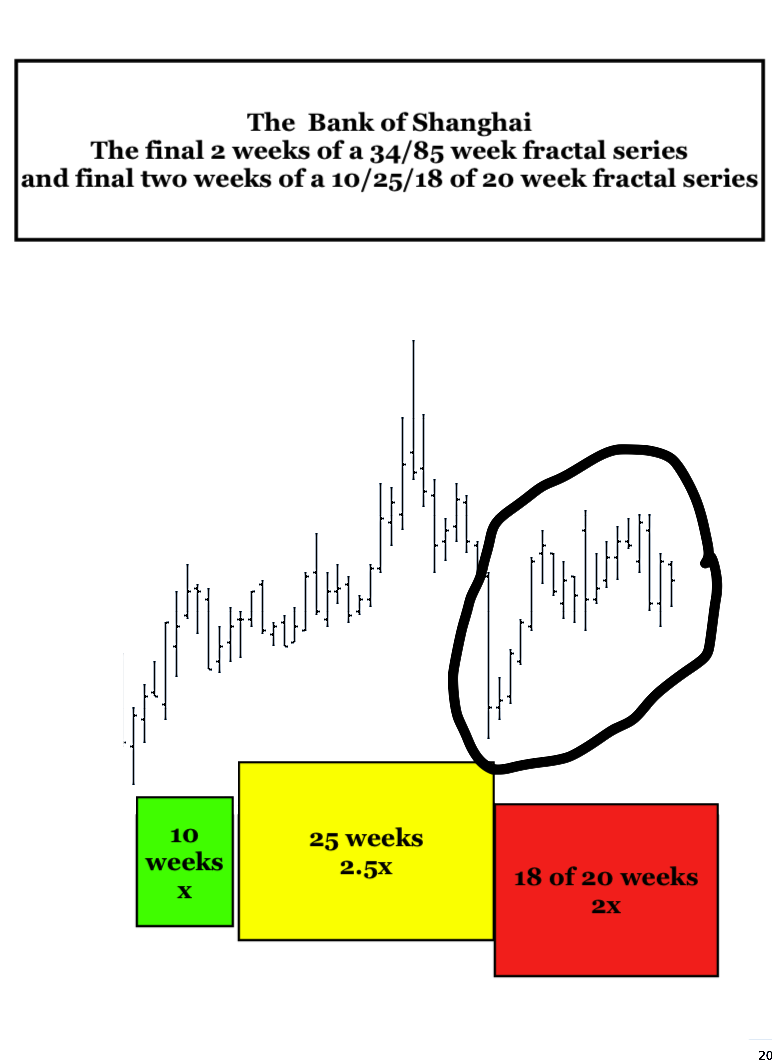
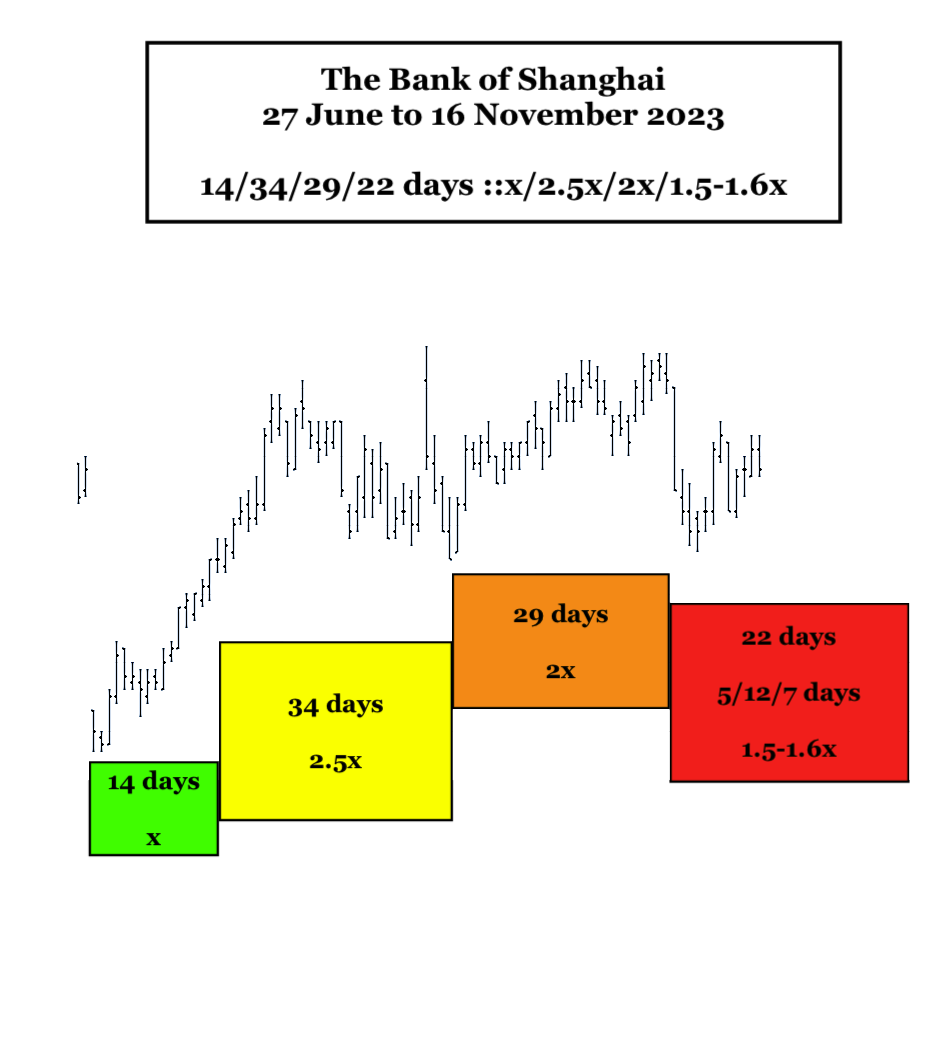
The current fractal target date for the global intermediate crash low for equities, crypto, gold and commodities is 16 November 2023. This intermediate target date is based on two sequential monthly declining Bank of Shanghai equity 3-phase Lammert decay fractal series starting November 2017: 9/20/18 months and 9/21 of 21/12-18 months. A 27 June 2023 daily 4-phase Lammert fractal series of 14/34/29/22 days (ending 16 November 2023 ) completes a July 2021 9/21 month subfractal (1) and subfractal (2) series of a projected 9/21/12-18 month 3 phase decay fractal series.
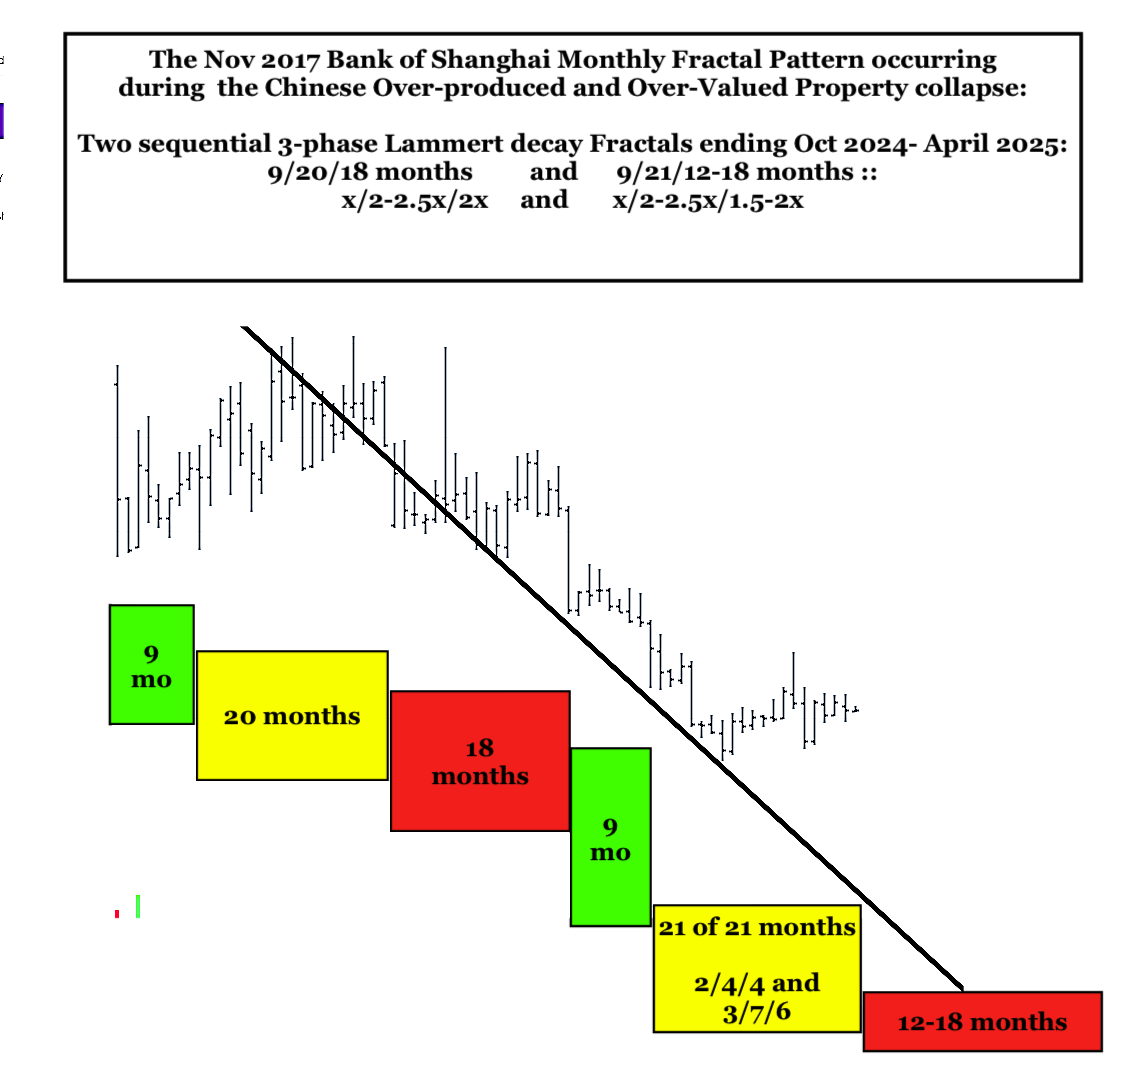
With its collapsing, overproduced by 100 %, and grossly overvalued property sector, China has the overproduced, over-owned, and overvalued manufacturing position that the United States had in 1929.
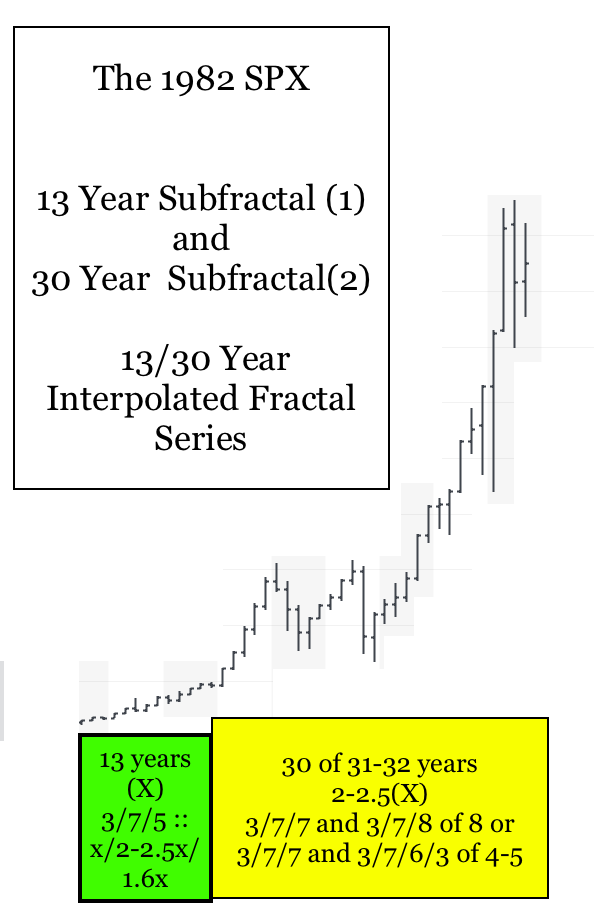
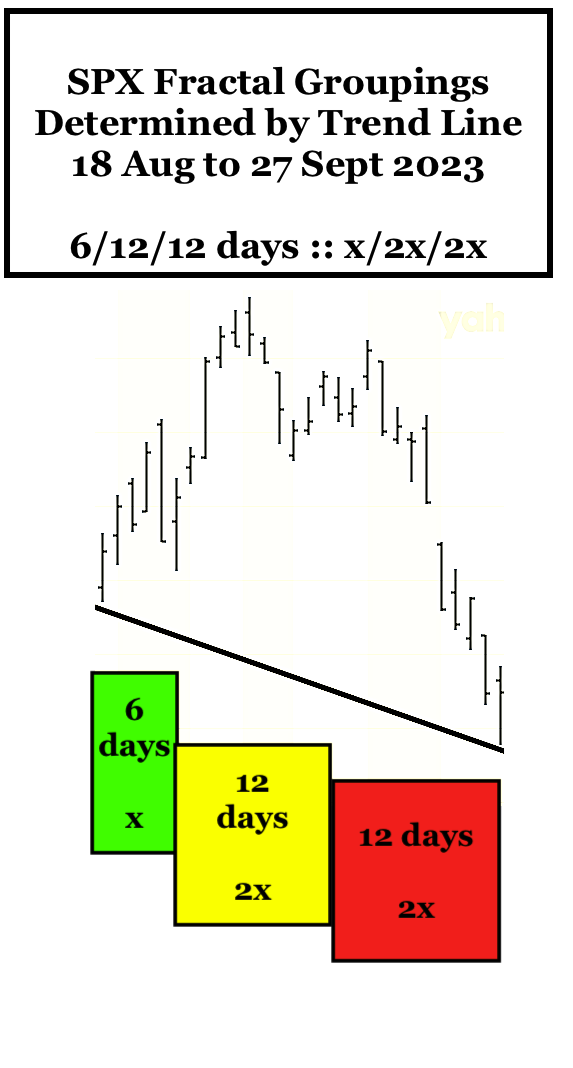
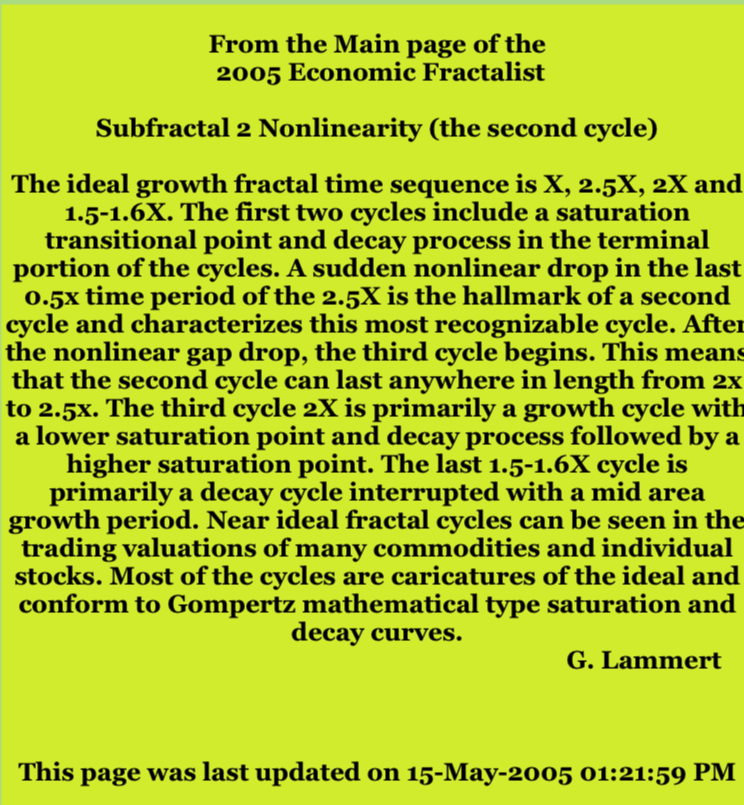
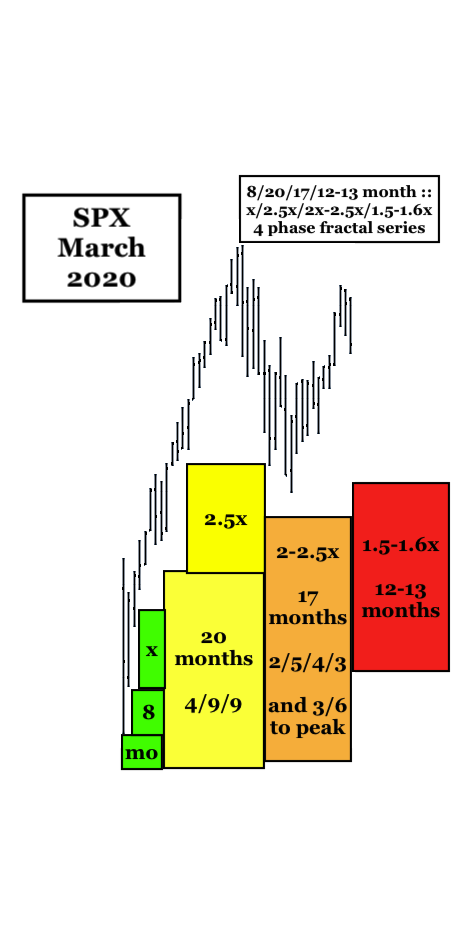
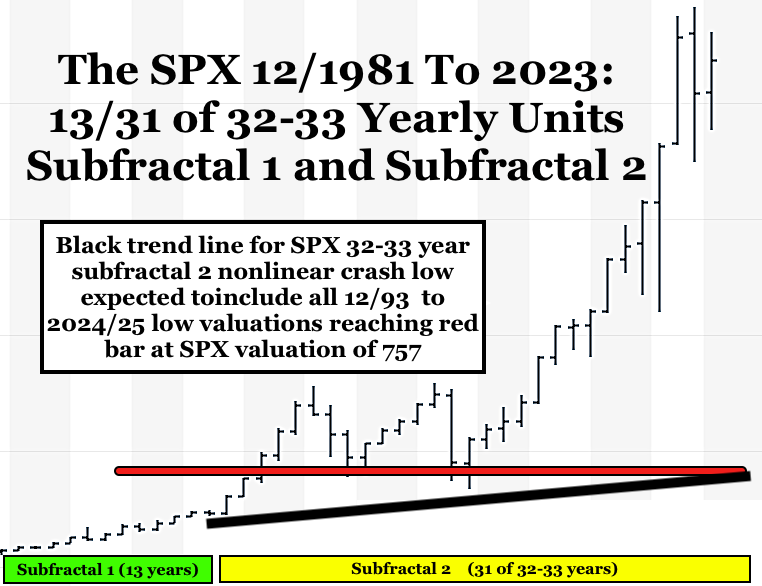
Lammert Fractals are deterministically self-ordered in the most elegantly efficient manner by the global asset-debt macroeconomic system and have two simple mathematical fractal grouping patterns: a 3-phase time-based fractal pattern of x/2-2.5x/1.5-2.5x and a 4-phase time-base fractal pattern of x/2-2.5x/2-2.5x/1.5-1.6x. Self similar fractal time units can be in minutes, hours, days, weeks, months and years. The 2-2.5x subfractal (3) of the 4-phase fractal pattern can be a peak such as the 90 year 8 November 2021 peak for the US 1807 36/90/90/54 year US Great fractal series or a nadir in a shorter declining series. The fractal groupings are determined by the underlying trend line from the first and last time unit of the fractal grouping which means that the nadir valuations determine fractal groupings. the nadir valuation point for the 90 year subfractal (2) of the 1807 36/90/90/54 year Lammert 4-phase great US fractal series occurred on 8 July 1932.
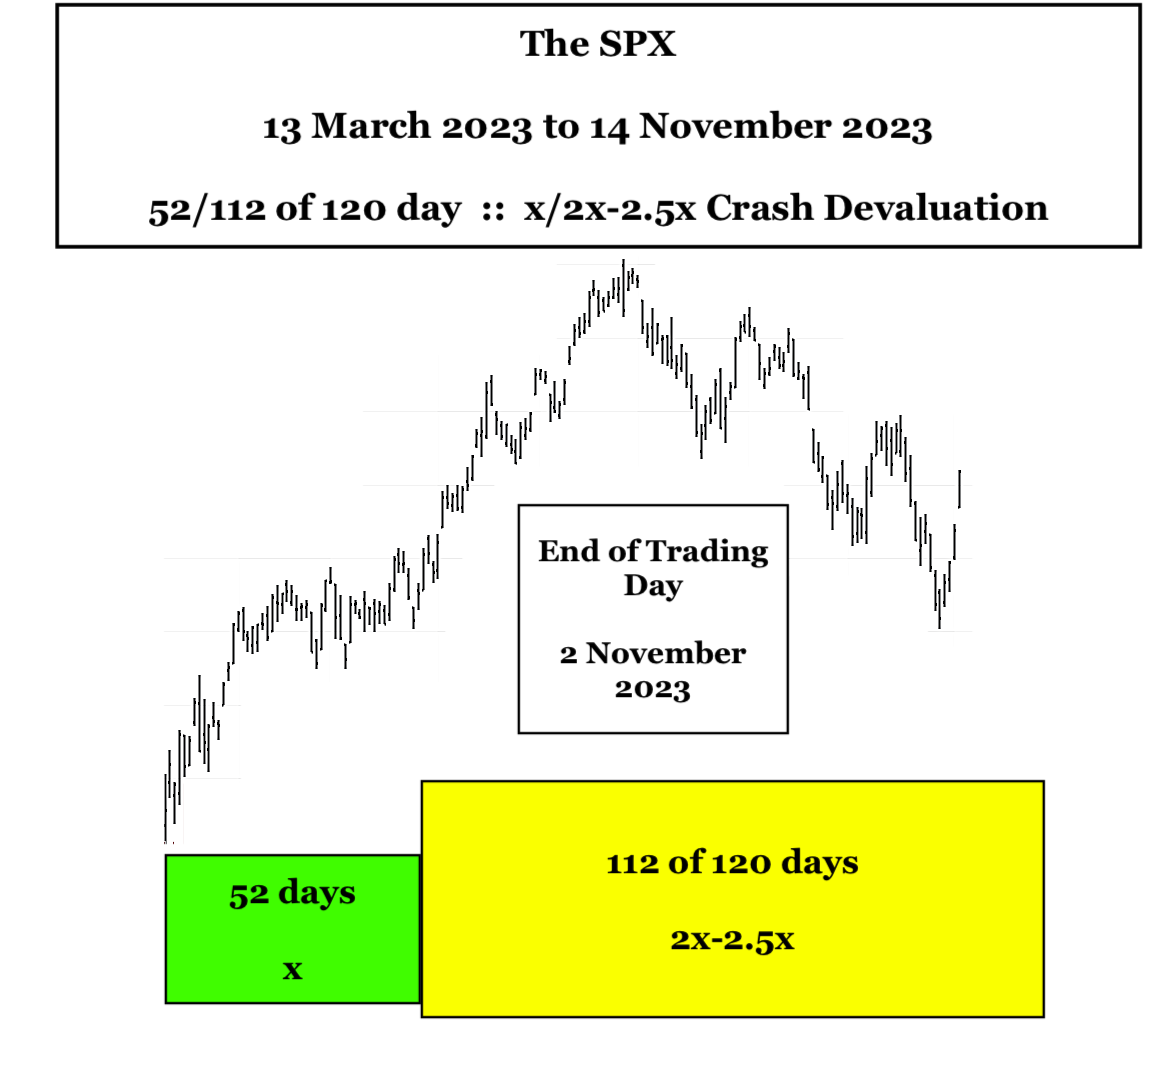
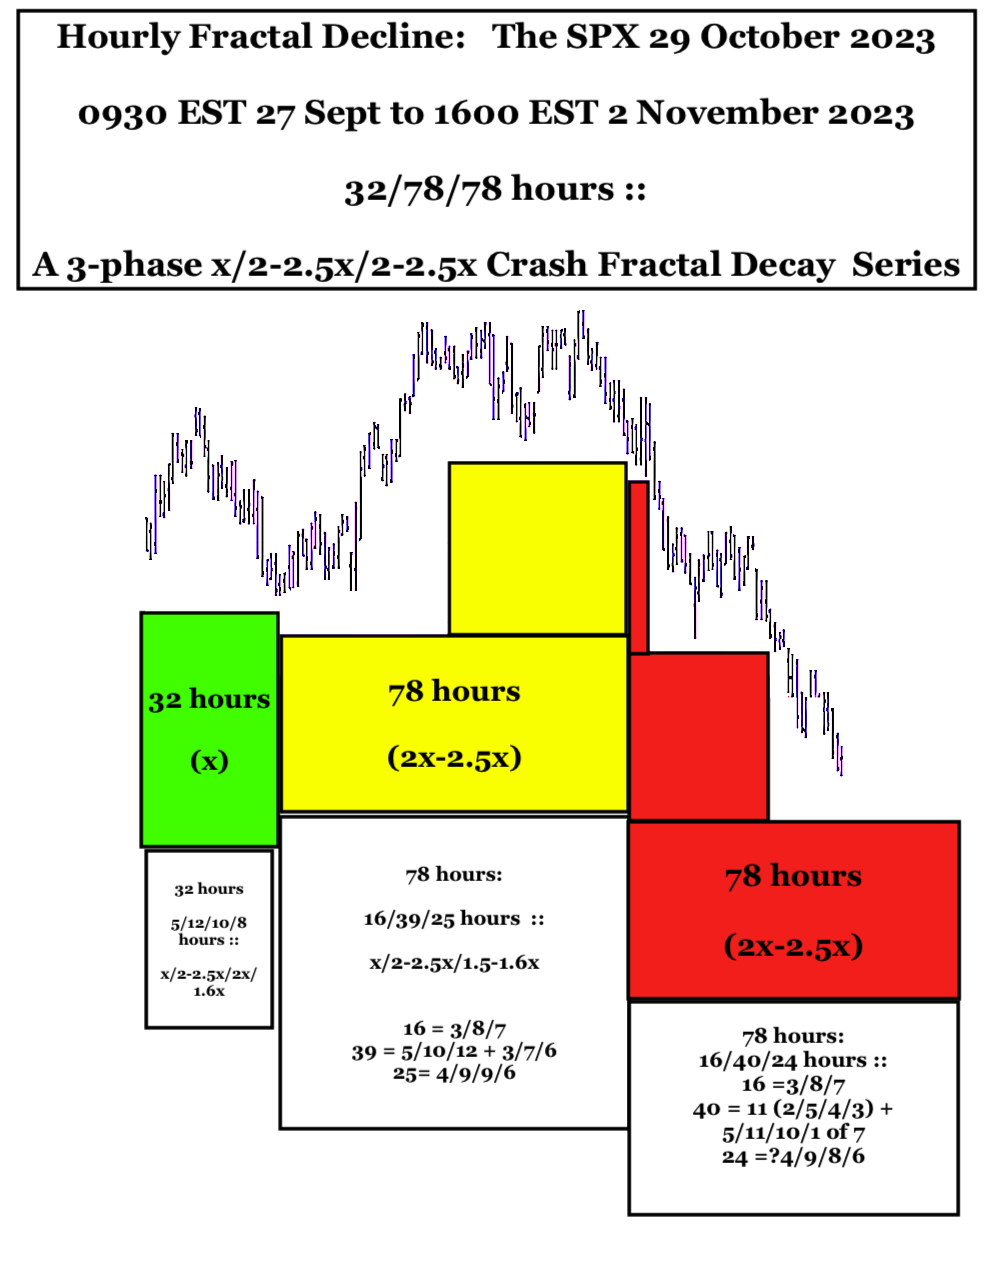
On 2 November 2023, selling was conducted by the “smartest” speculators or AI programs. Equities were sold to those unfortunate FOMO buyers occupying the last musical chairs resulting in gapped higher highs on 1, 2 and 3 November 2023. Conversely for the smart sellers of equities, long term US Notes and Bonds were purchased with exiting equity money with a gapped nonlinear low for Notes and Bonds on 2 and 3 November 2023 which occurred in the context of the completion of a 31 August 2023 9/20/16 day lower high peak interest rate and an 11 October 2023 16 day subfractal (3) growth series of a 3/8/7 day lower high peak interest rate. A gapped low occurred on day 17 of the 11 October subfractal (3) ending 2.5% lower of a projected 9/20/16/3 of 12 day series of lower low interest rate series ending 16 November 2023.
Gold in USD collapse to 16 November 2023.

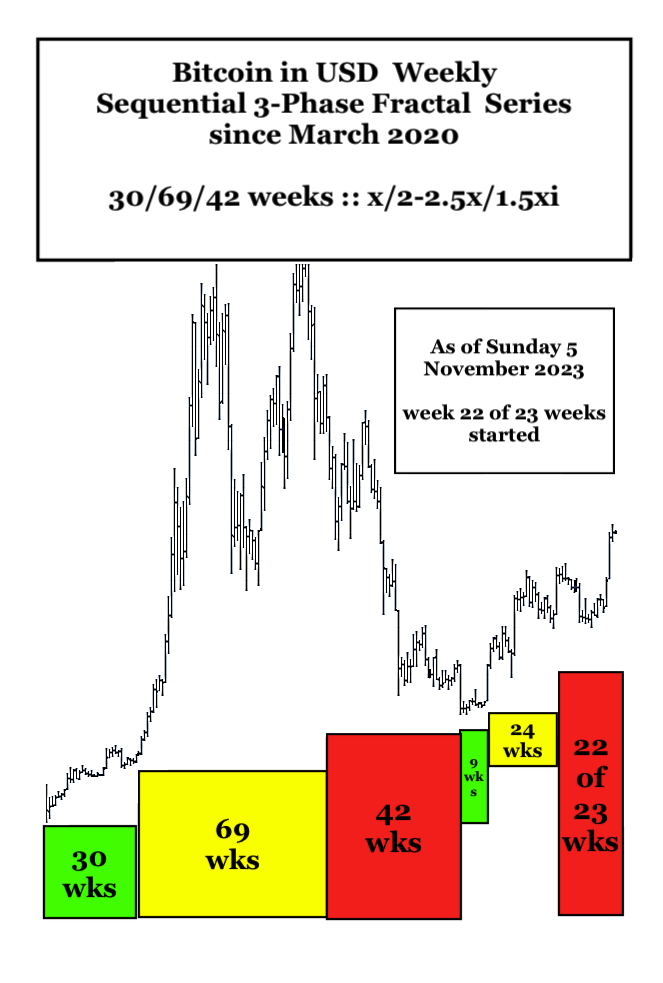
Bitcoin in USD collapse to 16 November 2023 low valuation..
Bitcoin in USD is following a Jan 2015 20/44/36/27 month complex Lammert 4-pahes fractal series. March 2020 was the 20/44 month subfractal 1 and subfractal 2 low. Since that March 2020 low Bitcoin in USD, unintelligible QE and subsequent necessary QT have fostered system created self- assembled 30/69/42 weeks and 9/24/22 0f 23 week sequential 3=phase Lammert fractal series.
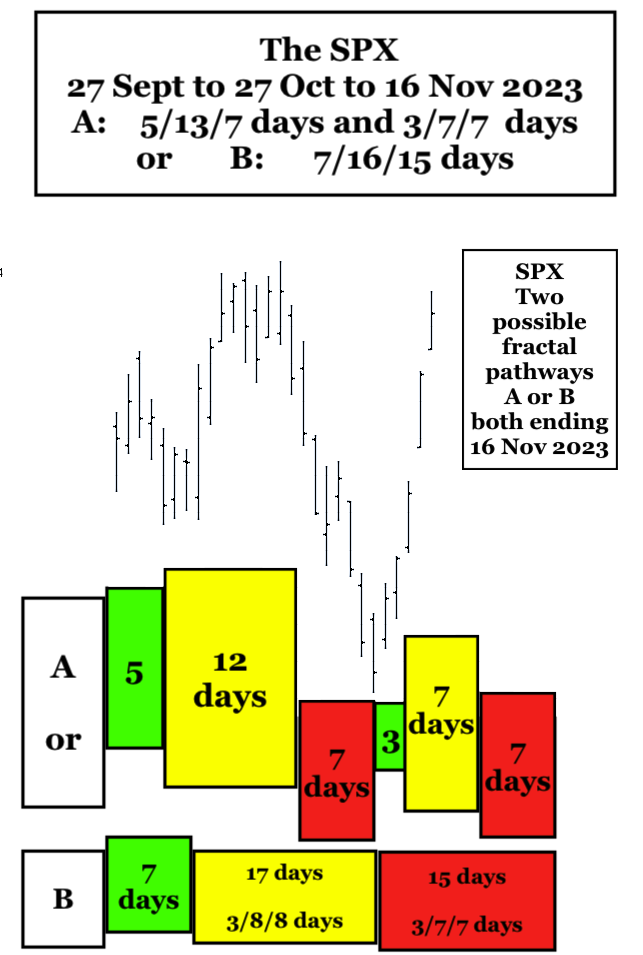
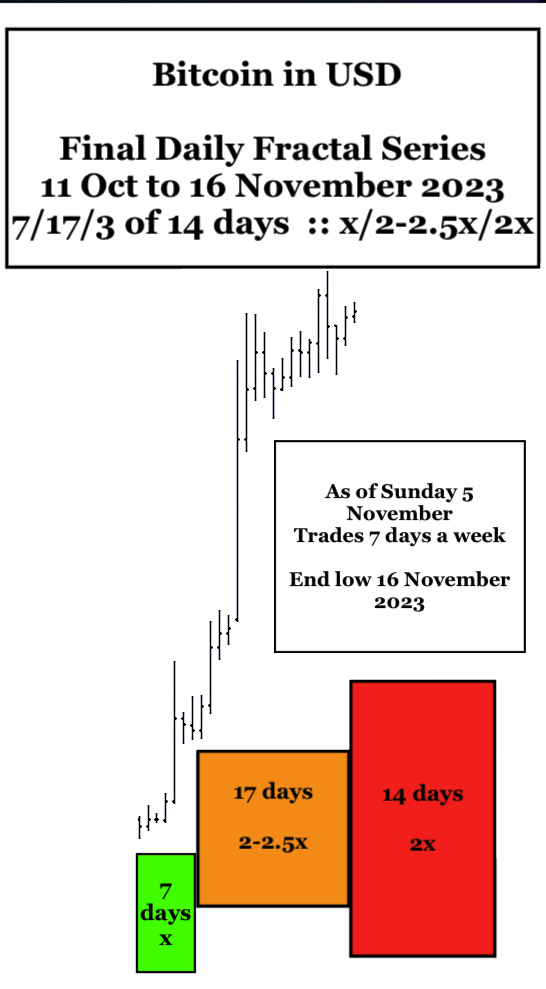
The daily fractal series for Bitcoin in USD that concludes the 9/24/23 week fractal series is a 11 October 2-023 7/17/3 of 14 day series ending 16 November 2023.
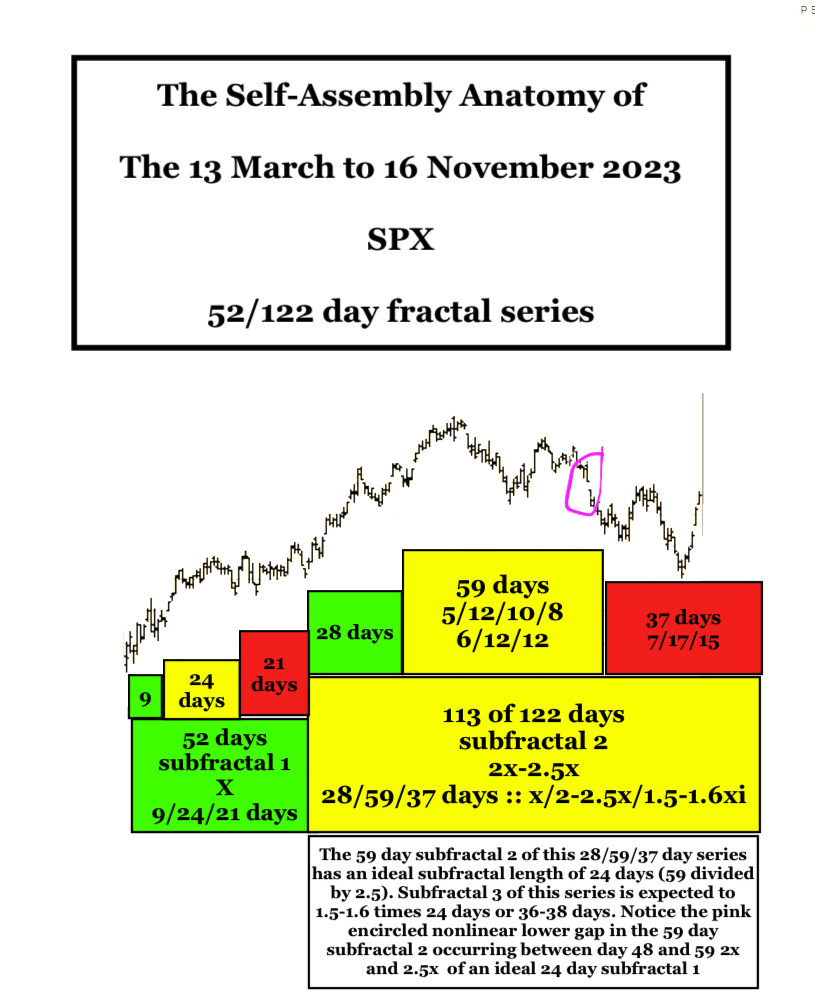
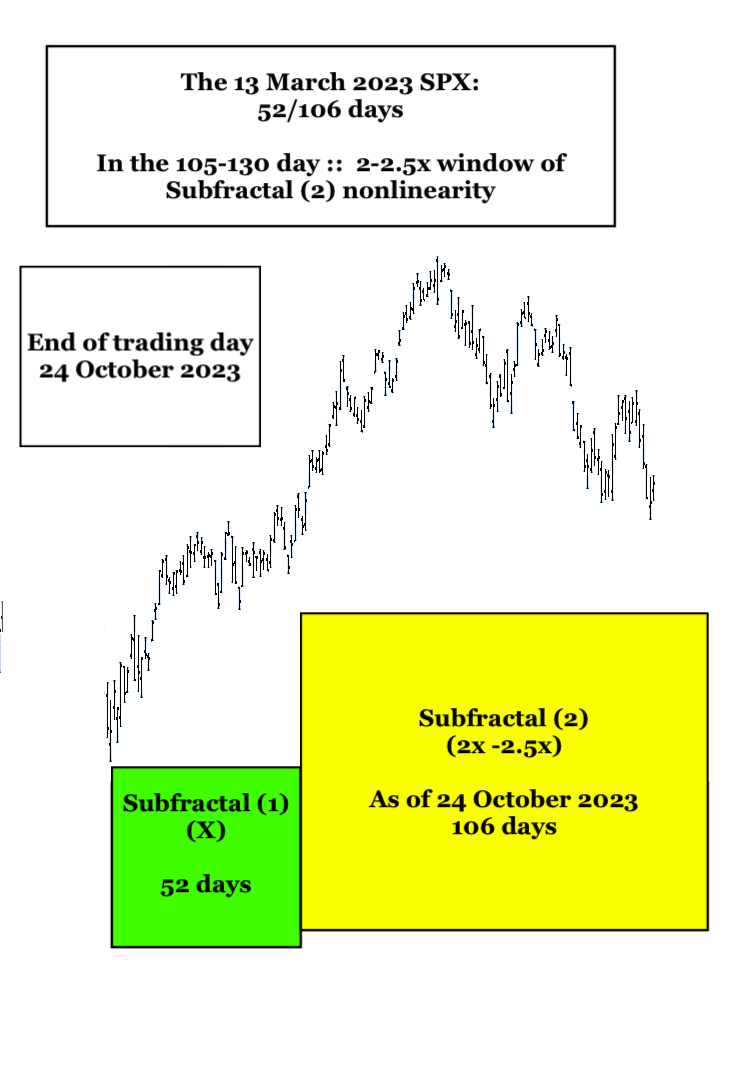
Below is the asset-debt macroeconomic system’s self assembly fractal nature of the 13 March 2023 to 16 November 2023 low consisting of a 52/113 of 122 day :: x/2x-2.5x subfractal 1 and subfractal 2 series: