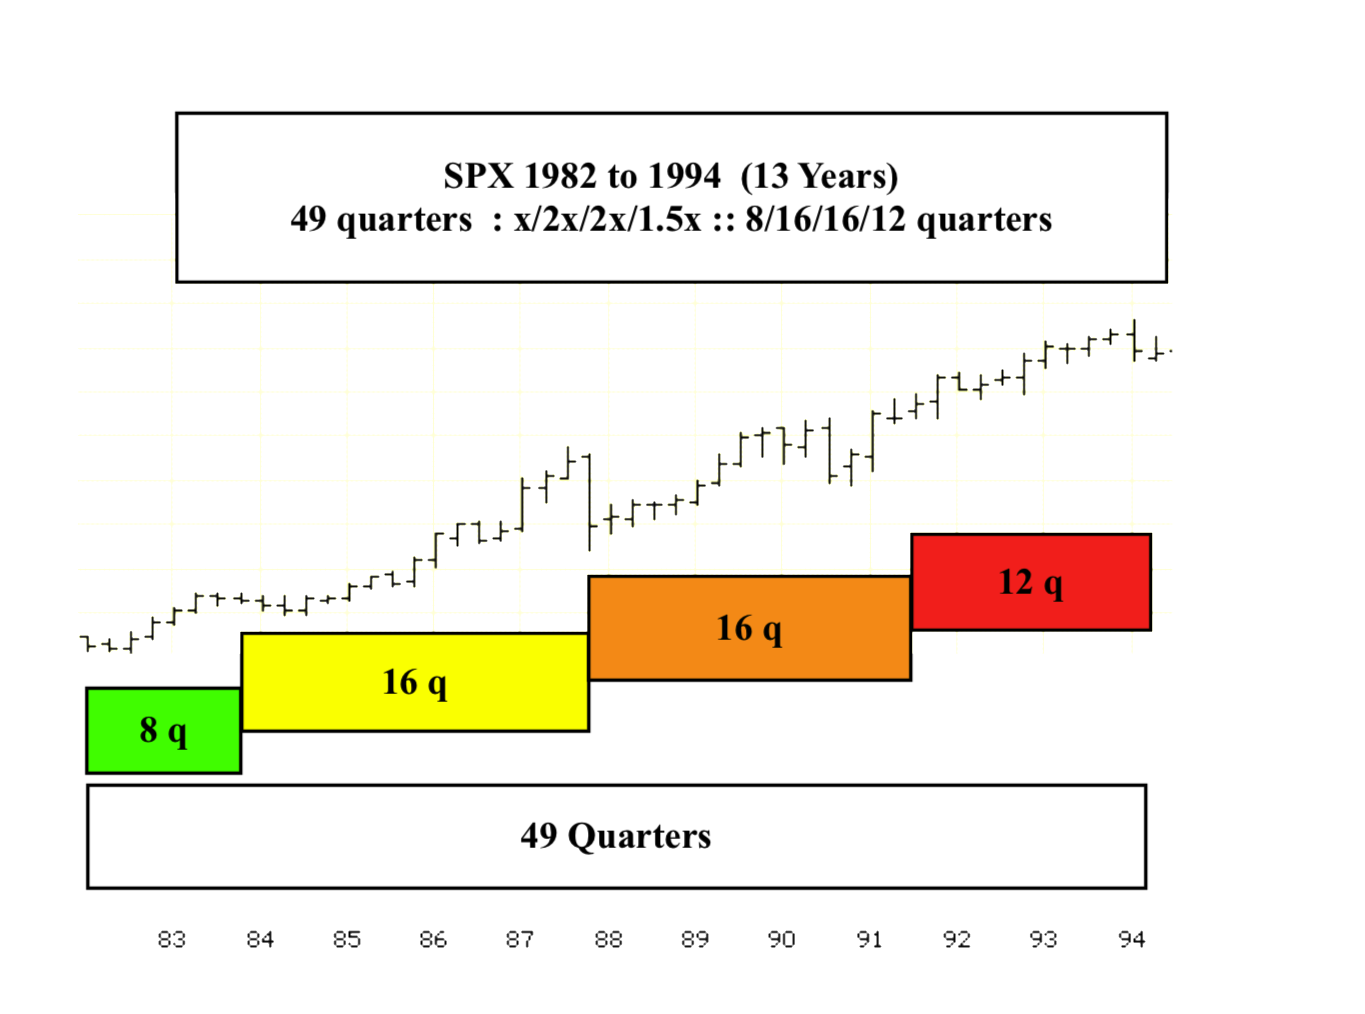
The Great 1982 13/31 of 31-32 Year Second Fractal 2024-25 US Wilshire Crash

As part of a 1807 US hegemony x/2.5x/2.5x/1.5x :: 36/90/90/54 year great fractal progression with nadirs in 1842/43 and 1932, and a peak valuation in November 2021, the valuation of the US progenitor and composite Wilshire has risen with post World War II US global money/credit expansion and with initially its enormous geopolitical and manufacturing dominance. Since the Volcker US peak interest rates in 1982, the Wilshire has been propelled by money and debt expansion from both the gradual 45 year lowering of US (and global) interest rates and later from direct central bank creation and ownership of debt and 2020 MBS’s and from historically low corporate and private debt interest rates tied to near zero fed funds rates whose combined QE effect fueled the post Covid equity boom.

While the US 3 month Treasury minus Ten Year Note has been inverted to a depth and monthly duration similar to the pre1929 equity crash, the SPX, ( but not the Wilshire which includes small cap equities), has peaked on 19 January 2024 to a new high. It is both the combination of end phase creation of service-based economy jobs associated with new debt creation and money dis-proportionally pouring into the SPX’s big 7 tech companies which have supported the SPX’s recent bubble peak valuation.

The 1807 36 year Wilshire progenitor First Fractal ended in 1842/43. The 90 year Second Fractal peaked in 1929 and nadir-ed in 1932. The 90 year 8 July 1932 Wilshire composite Third Fractal peaked on 8 November 2021 with a 54 year 4th Fractal expected to end in 2074.

The US 90 year Third Fractal and 54 year Third Fractal are composed of two interpolated sub-series: a 51 year fractal sub-series 1932 to 1982 of 10-11/22/21 years and a 1982 13/31-32/31-32/18-20 year fractal series ending in 2074.

The graphs below show the quarterly fractal progression from 1982 of 49/120 of 123-5 quarters.


The monthly progression from March 2020 is 8-9/21/20 of 20-21/12-13 months :: x/2.5x/2.5x/1.5-1.6x

New Target for Global Crash Low: 8 December 2023

US long term debt instruments reached an inter-day low of 0.4 pc on 9 March 2020 and have risen to a high of 4.997 pc on 23 October 2023. The US central bank is simply allowing supply and demand market forces to apply QT to an overheated economy fueled by printed money, 2 plus trillion dollars of covid savings, and covid forbearance of payments on US MBS related mortgages and US-lended college debt. Covid savings and easy forbearances on debt payments are expiring or have expired. Outstanding credit card debt, subprime automobile debt, and student loan debt make it difficult for further private debt expansion for the masses in the US consumer based economy.

The current fractal pattern of the US Ten Year Note interest rates, in conjunction with the monthly, weekly, and daily fractal patterns of global equity, gold, commodity, and cryptocurrencies provide predictive guidance for the 2023 interim crash low for the non-debt asset entities.

After completing a March 2020, 7/16/17 month :: x/2-2.5x/2-2.5x fractal growth series, US Ten Year interest rates have self ordered into an observable 2/4/4 month fractal growth pattern. On a weekly basis this 2/4/4 month growth fractal is composed of two fractal series: 5/12/7 weeks :: x/2.5x/1.5x and 3/8/3 of 6 weeks :: x/2.5x/2x. The daily fractal series from 5 April 2023 is 21/52/32 days correlating to the 5/12/7 week fractal series and 14/32/ 11 of 25 to 26 days correlating to the 3/8/3 of 6 week fractal growth series. The daily fractal series for US Ten Year Note interest rates are depicted in the image below.

The beginning nadir month of a monthly fractal series contains 4 weeks in it and the beginning nadir week of a weekly fractal series contains 5 days which must be added to the daily subfractal (1) series. For the SPX , 5 down days in the first weekly is added to the 52 day 13 March 2023 to 24 May 2023 subfractal (1) for a total of 56 days {56 vice 57 days because the fifth day of the 5 days contained in the first week down is same as the first day of the subsequent 52 day subfractal(1) series). 8 December 2023 would complete a 56/139 day :: x/2-2.5x subfractal(1) and subfractal (2)series. If the final lower high for the US Ten year note was on day 26 of a 14/32/26 day series 11 December 2023, would complete a 56/140 day series.

Bitcoin in USD final daily series(trading 7 days a week) appears to be self-assembled into an 11 October 2023 10/25/25 day fractal series ending on 8 December 2023. Ford is appears to be self-ordered as a 24 May 2023 19/47/47/14 of 28 to 29 day :: x/2.5x/2.5x/1.5x fractal series ending 8 December or 11 December 2023.

Added 20 November 1030 PM EST

All global equity markets, commodities, gold and cryptocurrencies will undergo a major nonlinear devaluation over the next 13-14 tradings days (13 days for the US considering the holiday) with a current target low date of 8 December 2023. All the major indices have had secondary lower peak valuations with 26-29 October 2023 3-4/7-8/7-8 day final blow-off growth fractal series. For the US NASDAQ, this was a 26 October 2023 4/8/8 day :: x/2x/2x fractal growth series with a 20 November peak valuation slightly lower than its earlier 19 July 2023 high (which is the secondary high to its all-time November 2021 high. See below:

For Citybank its March 2020 to 8 December 2023 current 8/20/19 of 20 month :: x/2x 2x fractal series and 25 May 2023 current daily fractal series are depicted below.

New Target Date for November 2023 crash low: 29 November 2023 day 130 of a 13 March 2023 52/130 day :: x/2.5x fractal series

The 14 day valuation gain from the 27 October 2023 low was unexpected but within the 13 March 2023 52 /104 to 130 day :: x/2x-2.5x nonlinear window. Qualitatively, the dominant service sector US economy has an operational consumer population that has no savings and has the highest ever collective debt at the highest interest rates in over 15 years. The consumer is tapped out. The Chinese economy whose base population savings is in real estate has a different, but real problem with the collapse of property and real estate prices and a collapse of stock valuations of the large corporations, e.g., Evergrande and Country Garden who build residential properties and are currently defaulting on interest debt payments. With collapsing Chinese property values (and equivalent savings), decreased foreign consumption demand because of foreign consumer debt load, and decreased domestic demand because of lost savings, the Chinese economy is near the threshold of significant retrenchment. The Bank of Shanghai, a proxy for the Chinese macroeconomic system, appears to be following a July 2021 35/85 of 87/70 week :: x/2.5x/2x fractal decay series with a subfractal (2) 87 week expected low at the end of November 2023.

The 13 March 2023 to 29 November 2023 52/121 of 130 day :: x/2.5sx fractal series is depicted below with the current 14 day gain part of a 26 September 2023 7/18/14/1 of 10 day fractal decay series.

Non-Stochastic Saturation Macroeconomics