The current fractal Macroeconomic model to the October 2023 low is
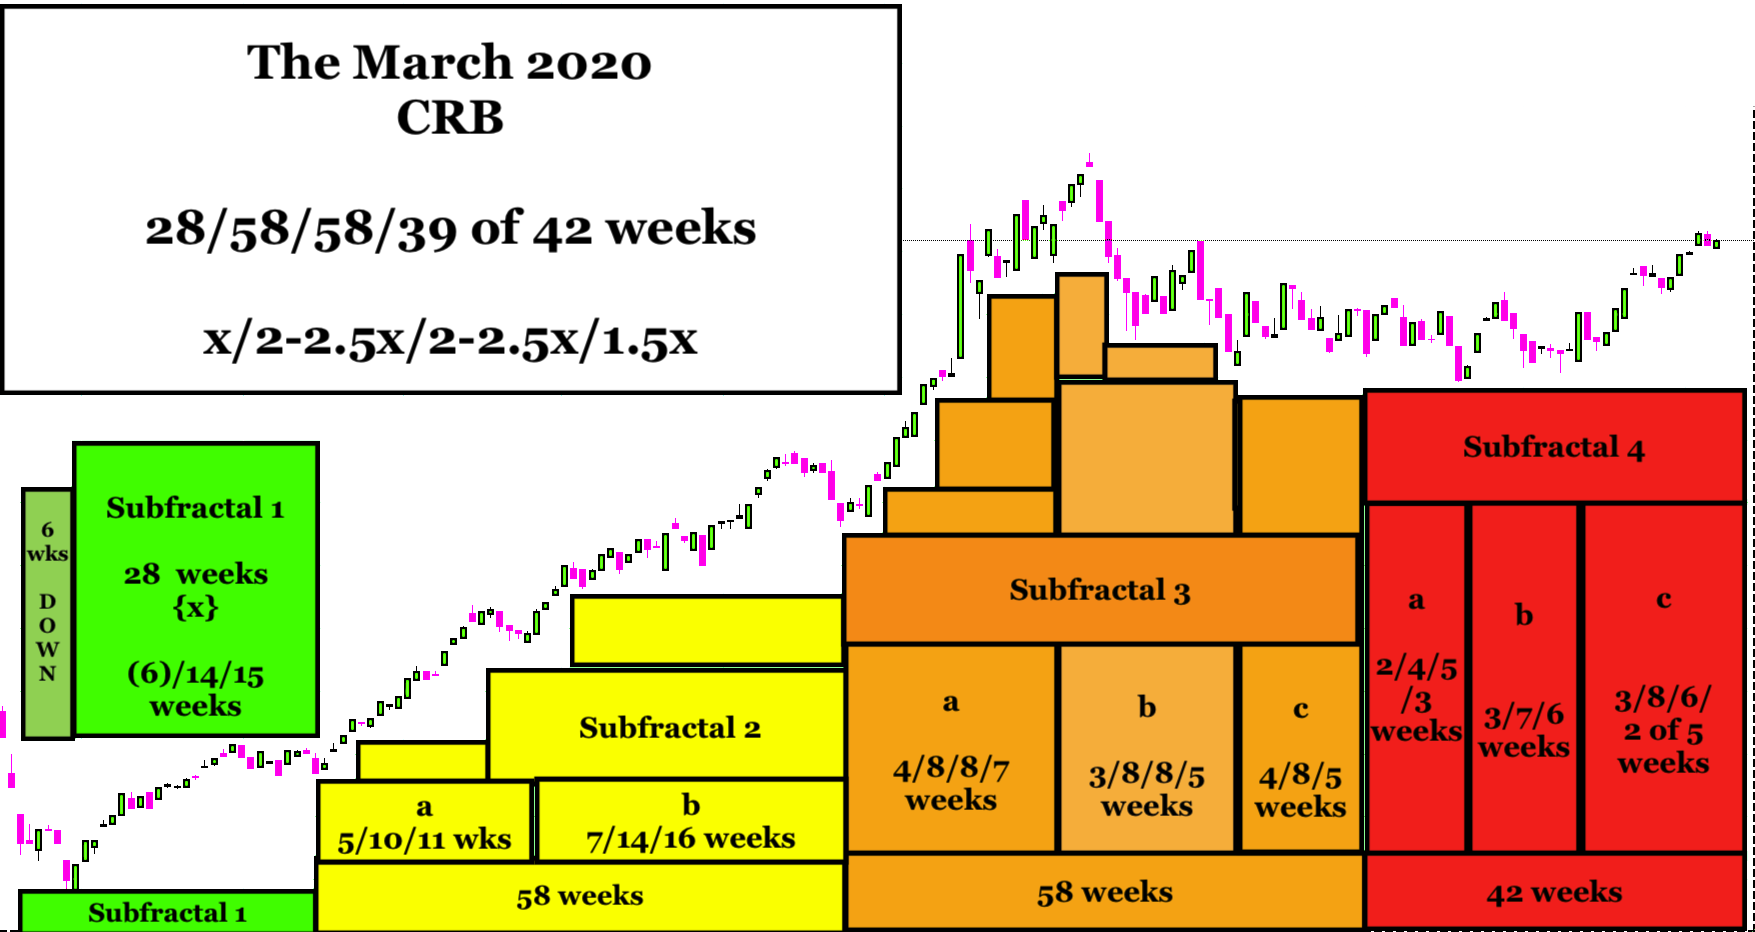
an 18 August 2023 6/15/13/10 day 4 phase :: x/2.5x/2-2.5x/1.6 x fractal series ending on October 16 2023. This a smaller interpolated fractal series is a terminal component of a large March 2020 8/20/18/12 month series ending in September 2024.
Two solid (absolutely no sarcasm intended) US Republican citizen representatives, serving as senior leadership on the House Ways and Means committee) recently presented a solid Ron Paul, Ross Perot-like sobering mathematical argument (below) against the sustainability of America’s spending, obligations, verses its tax revenue numbers with the social security trust fund going bust in 2033. What they said within the context of a family or a business’s budget analogy was unequivocably true, but isn’t the real state of affairs of the US asset-debt macroeconomic system within the context of the larger global system. Nobel prize winners like Paul Krugman and Milton Friedman understand (understood) the ‘real’ math of the asset debt macroeconomic system, whose basis, by customary nomenclature is indeed fraudulent.
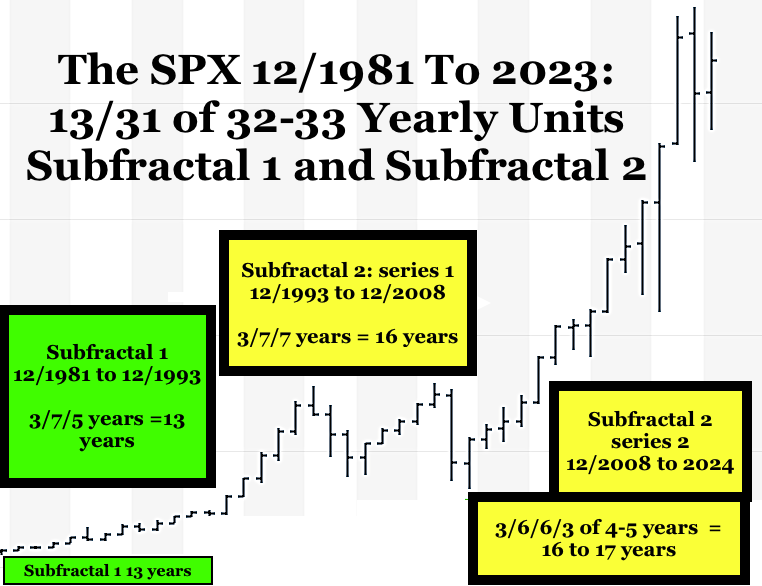
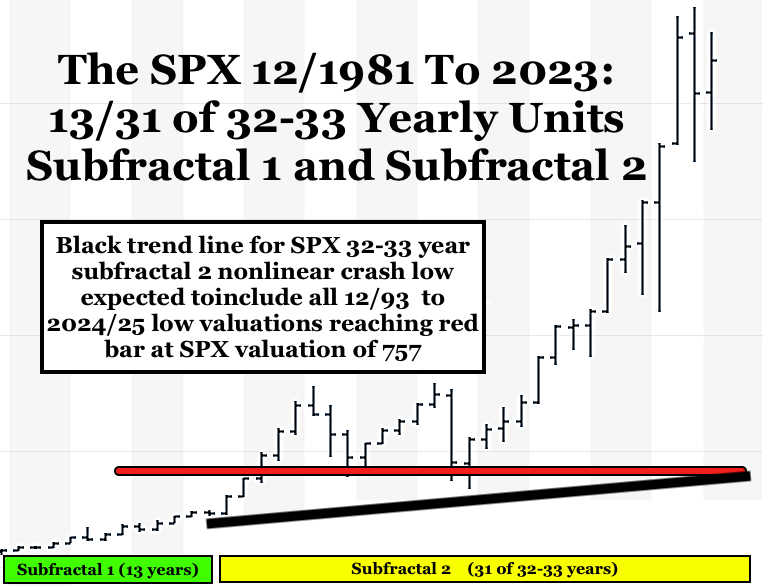
The bottom line in the big picture – of the 1807 36/90/90/54 year :: x/2.5x/2.5x/1.5x (November 8/2021 Wilshire inflation adjusted third subfractal 90 year valuation high) US hegemonic Lammert (longwave) Great Fractal Series – is that the US Federal Reserve {backed by the hopefully reliable US nuclear deliverable arsenal} acts exactly like a Parker Brother’s friendly Monopoly game personal banker. When a player loses the game and goes bankrupt, the friendly personal banker in this sovereign Monopoly game can magically extend a loan (from its own ex nihilo persona) to the loser player to continue playing …
This has already happened in Japan with currently a debt to GDP ratio of 240% with an annual tax-dependent federal spending to debt ratio of about about 20 % (like the US’s ratio). The Bank of Japan (Fed equivalent) holds most of Japan’s debt.
Debt creation and debt burden happens more easily with near zero to negative interest rates on sovereign debt as has happened during recessions since 2009. More recessions can be expected – but not as severe as 1929-1932 when the symbiotic government-central bank printing press was not nearly as well oiled).