Cryptocurrencies reached a GBTC EFF proxy 41/83 month :: x/2x maximum fractal peak valuation in Oct 2025 under the umbrella of the SPX and global equities 1982 13/33 year :: x/2.5x maximum fractal growth peak. Peak asset class valuations within the macroeconomic asset-debt system have been stretched thru optimal conditions: financial engineering and recent cherry-on-top private debt financing, 25 years of more than 10 trillion dollars of corporate buy-backs, 25 years of outsourcing of Americn manufacturing to foreign labor and foreign countries for lower cost and higher American corporate profit, 2009 QE bail-out money printing to banking and financial institutions, and 15-11% GDP deficit COVID spending in 2020 and 2021, respectively, accompanied by low interest rate mortgage-backed securities and out right money printing to sway the 2020 election with citizens, many who received checks (with the then president’s signature) greater than their real salaries.
The global peak of the system’s composite asset valuations has already occurred.
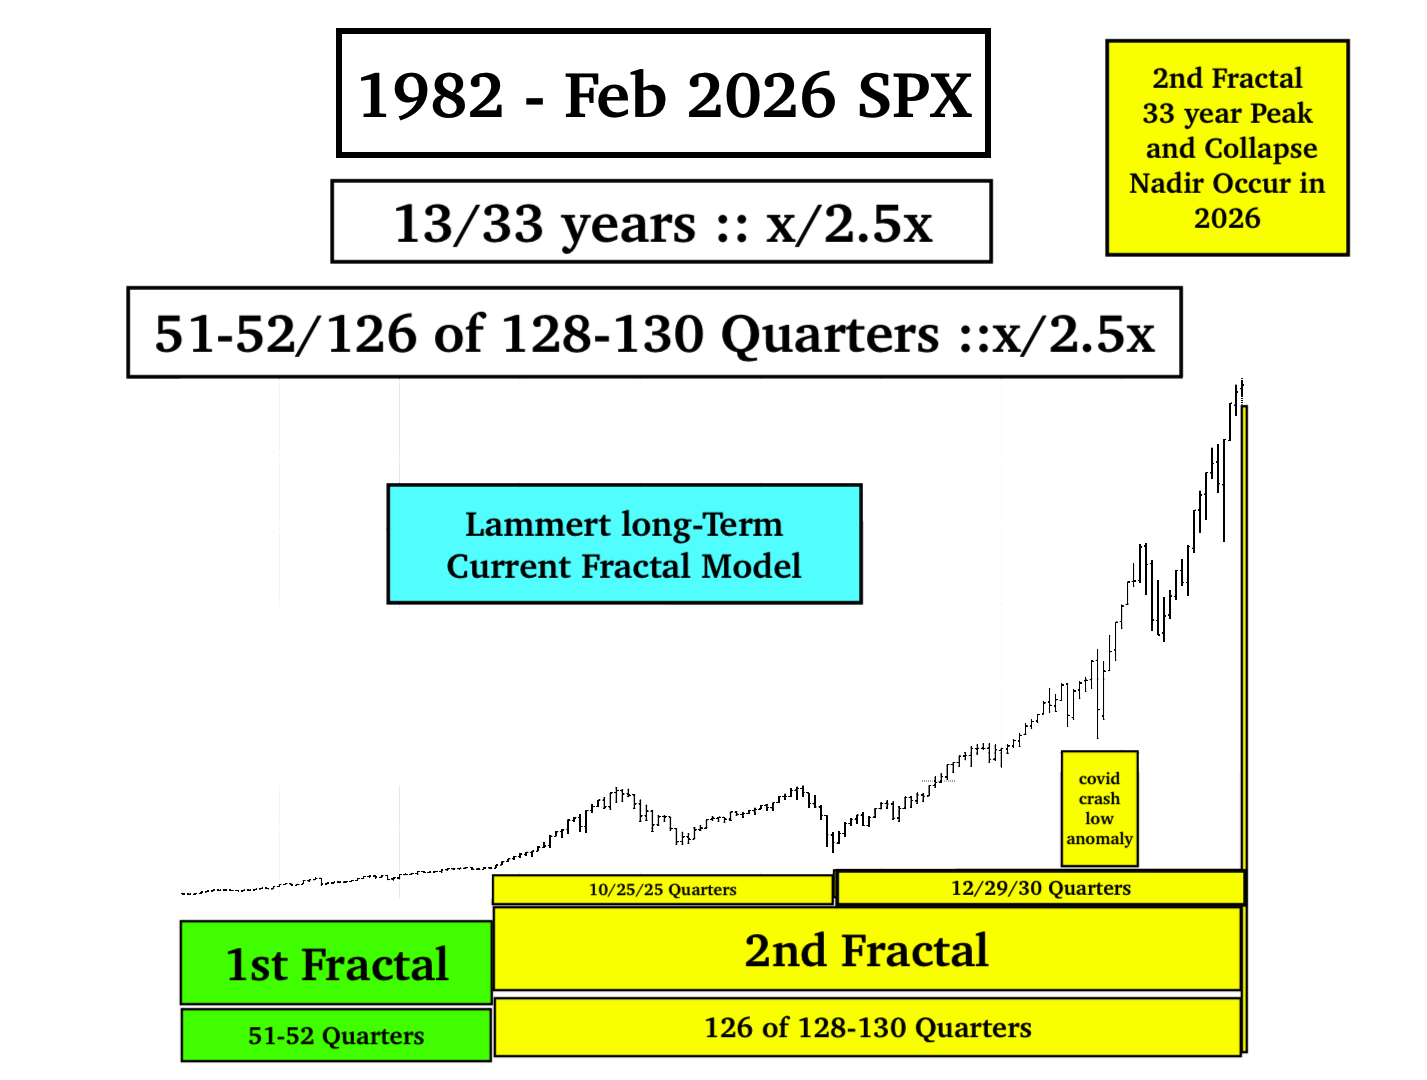
There may be additional 2026 peaks in composite equities and gold and silver from rotational money, but the SPX 13/33 year 1982 cycle will end in a same year, 2026, with a historically dv/dt2 severe collapse of all non sovereign debt asset class valuations.
Sovereigns can print money and expand debt and create economic growth via war-related domestic production and service sector economic growth. But the consumers at the base of America’s consumer driven economy are limited by their paychecks which limits their ability to maintain and expand debt obligation for the purchase of inflated goods and services.
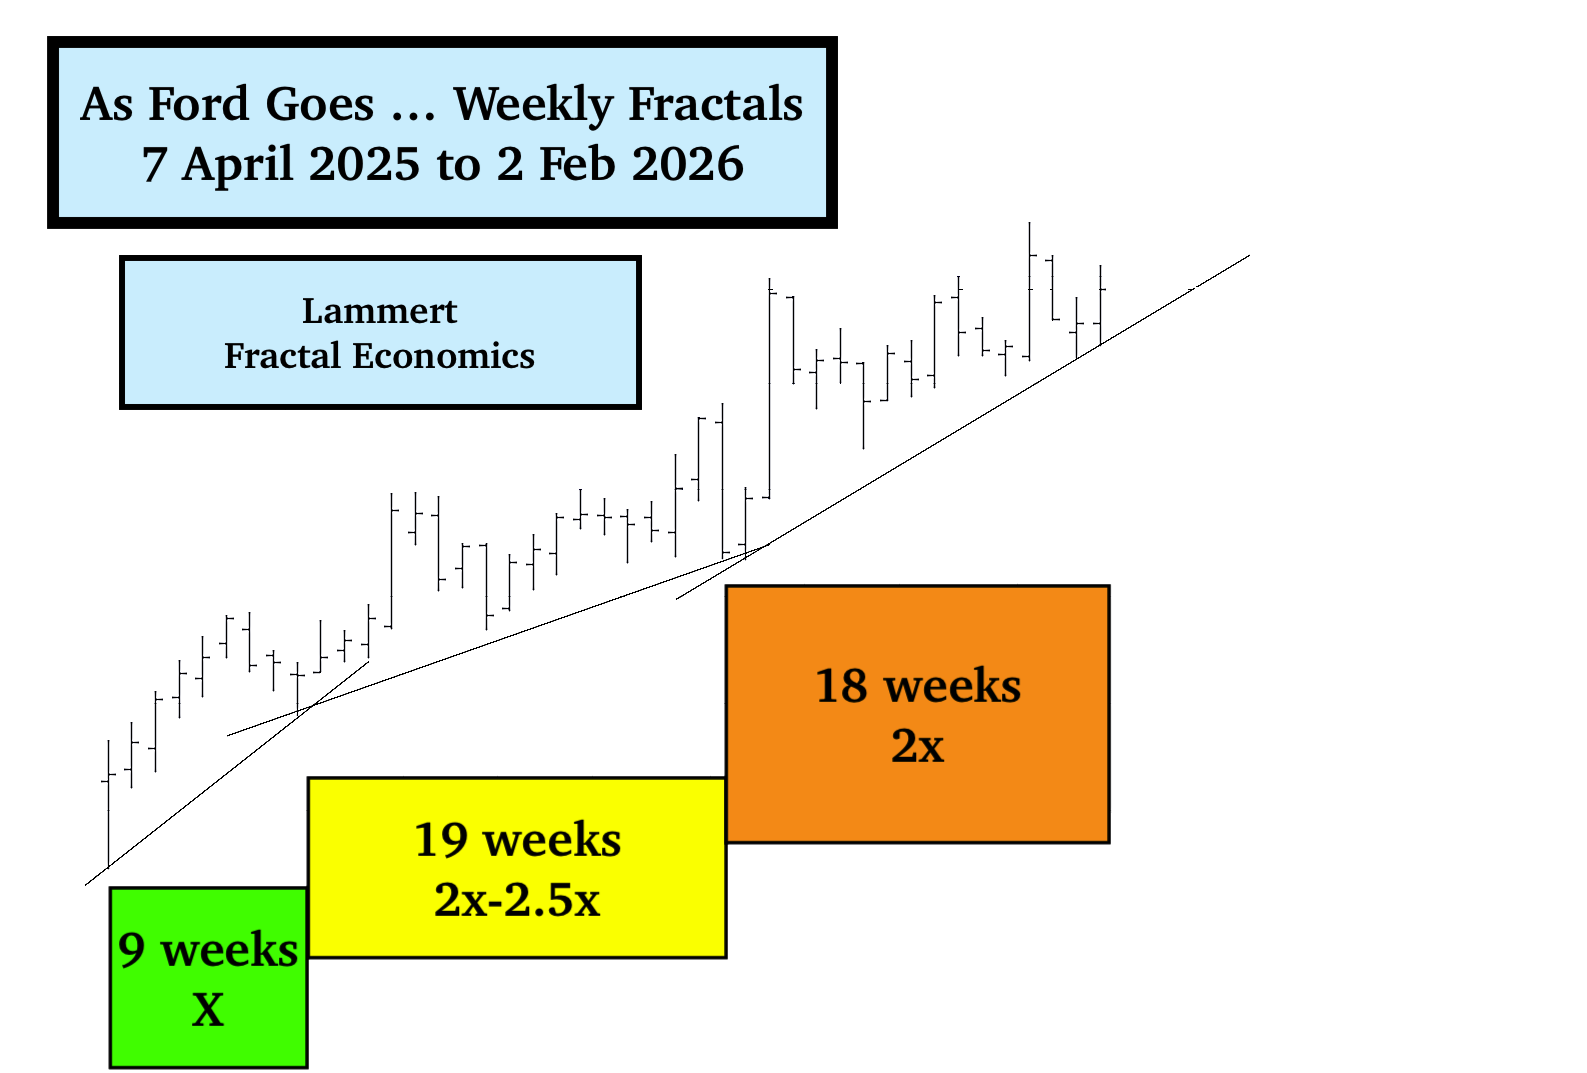
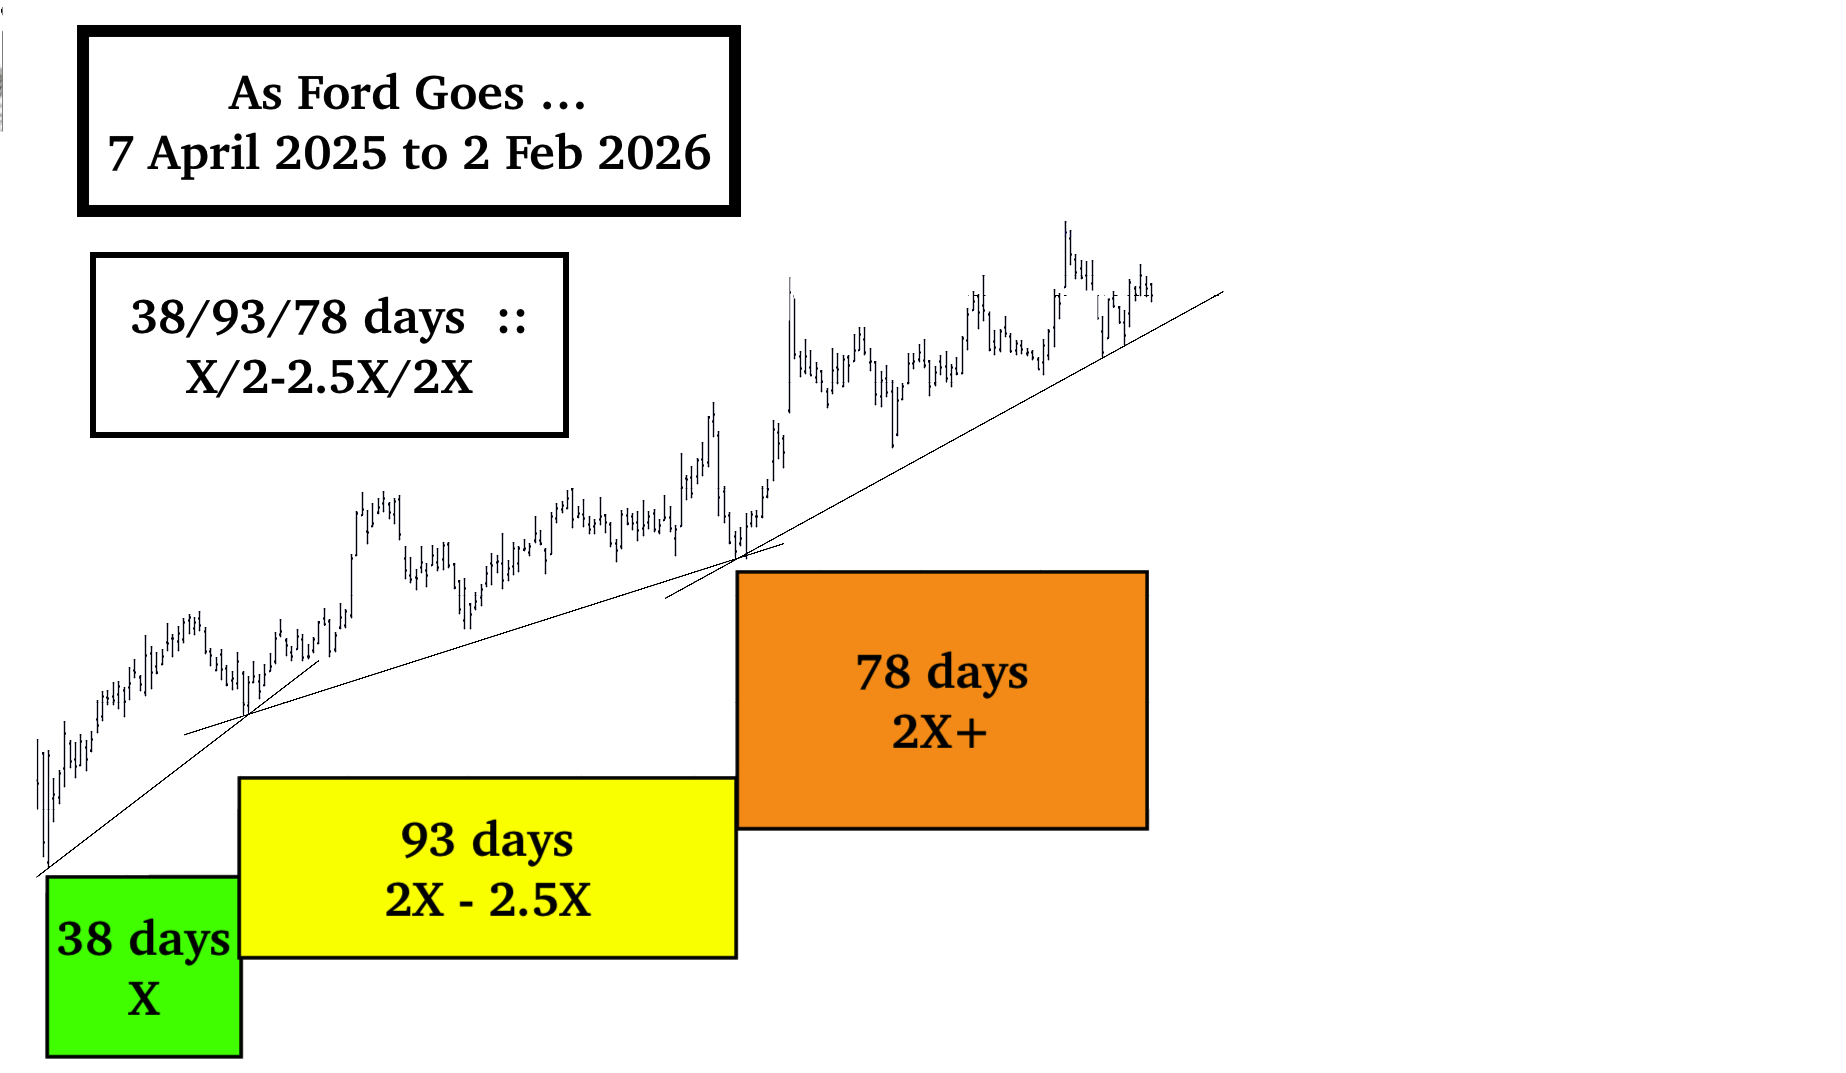
Ford is an American Company and a representative equity that is a proxy for American manufacturing and expandable American consumer debt.
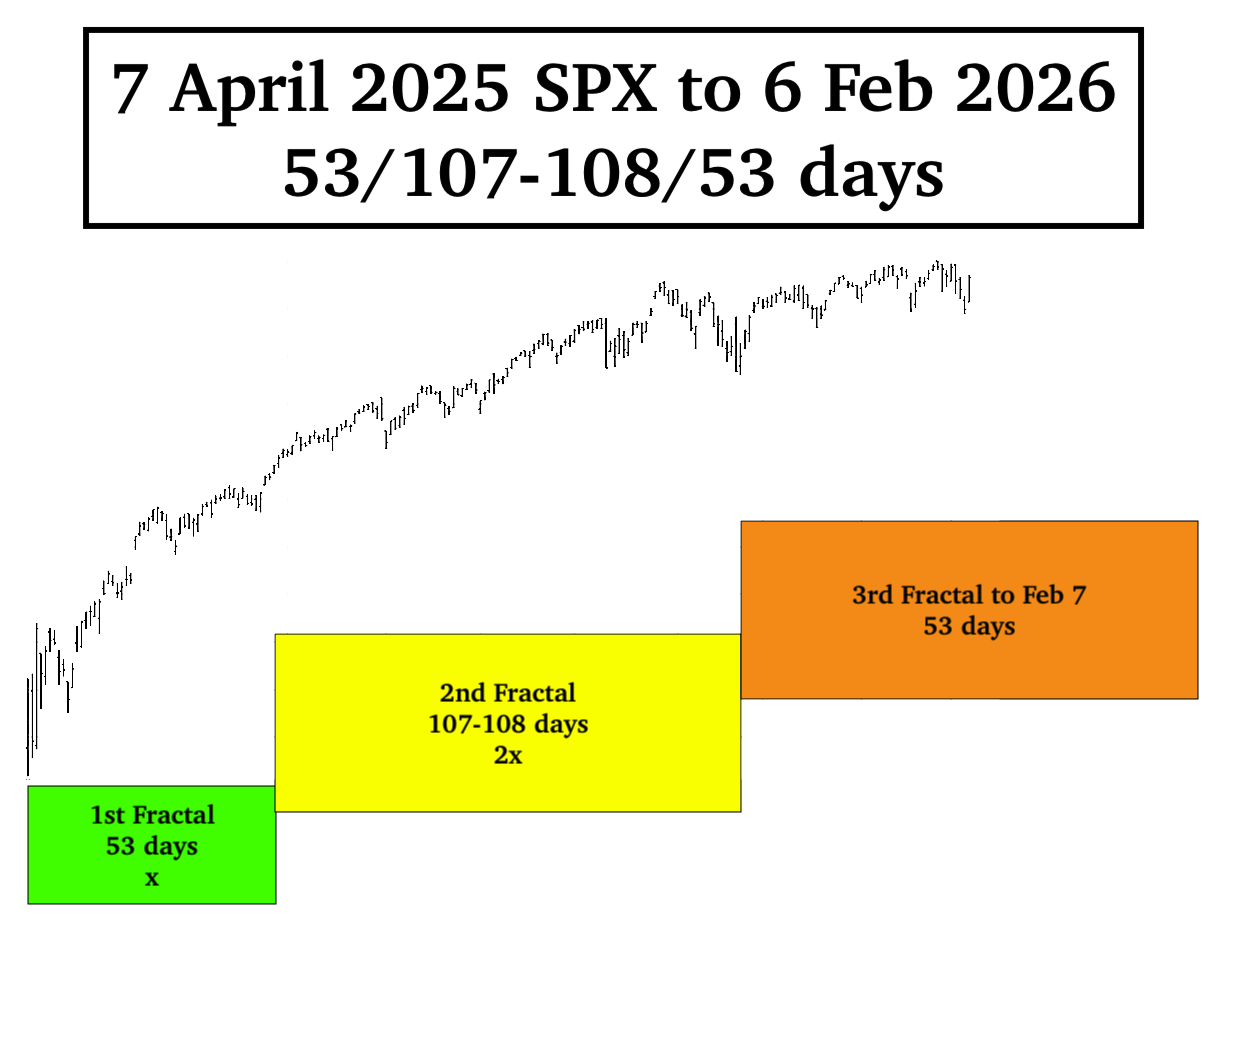
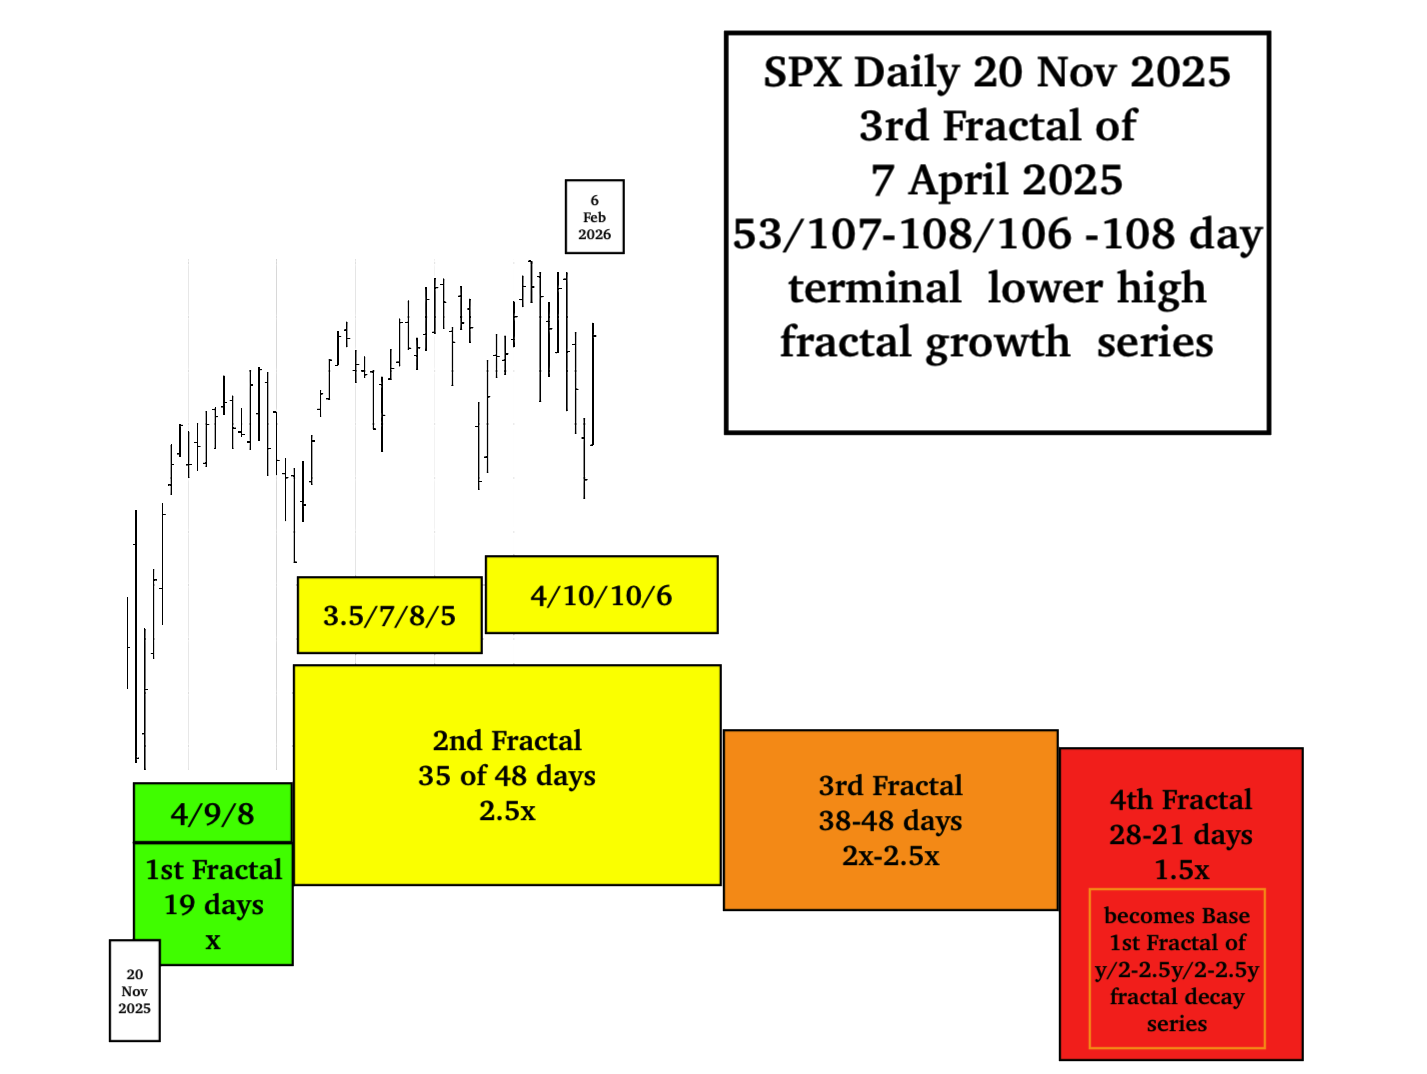
Under the Umbrella of 2009 11-12/29-30/30 Quarter :: x/2.5x/2.5x SPX and Wilshire Maximum Fractal growth, ending Jan-March 2026 and under the window of the 1982 13/33 year :: x/2.5x maximum growth and decline, Ford’s 7 April 2025 x/2-2.5x/2x weekly and daily equity growth appears to be complete in early Feb 2026.
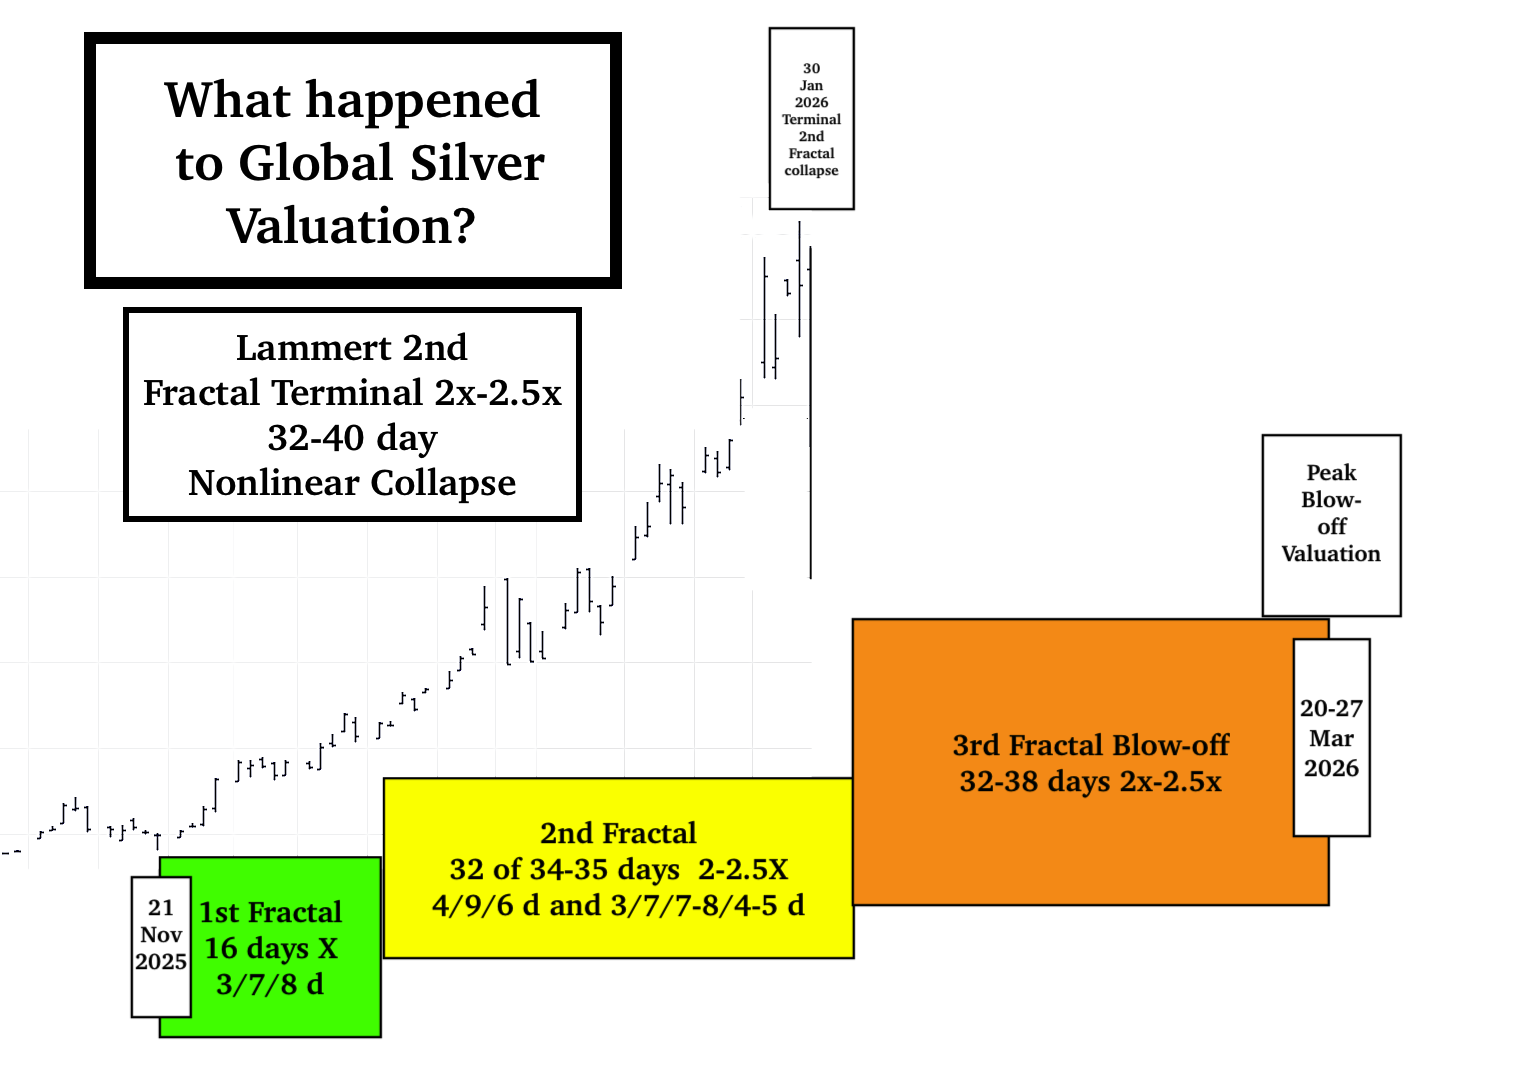
The flash crash on 6 May 2010 was representative of Lammert 2nd Fractal nonlinearity with a daily composite equity loss of nearly 10%. Silver’s flash crash of 30 Jan 2026 represented a 31.37% drop … again a result of Lammert Saturation Asset-Debt Fractal Macroeconomics and Lammert 2nd Fractal Nonlinearity …
The blow-off valuation in gold and silver in US dollars ending 20-27 March 2026 will be unparalleled.
The antiinstitutional, anti-alliance, anti-domestic law, anti-international law, anti-free trade, gross overt international and domestic corruptional … grossly lawless and plainly idiotic policies – facilitated by the majority US supreme court members – by the current American government has obliterated faith in American consistency and global leadership. The world’s preference for the traditional choice assets of value, gold and silver, will result in an historical valuation blow-off of these assets with a peak valuation between 20-27 March 2026.