GBTC proxy for Bitcoin, XAU proxy for Gold, the Indian BSE, the Japanese Nikkei, The European STOXX 600, and the SPX will all have their Initial Crash Nadirs on 17 November 2026.
Does the US and global asset-debt macro-economy deterministically self-order, self-assemble its asset valuations in precise growth patterns to governmental-and-private-debt dependent asset peak valuations and thereafter collapse in a highly ordered manner following two elegantly simple fractal patterns?
It does. The progression to valuation peaks and nadirs are not a random walk, but are a deterministic, boundaried, self-assembly, self-ordered maximally efficient fractal process conforming to two simple Lammert time-based fractal laws of composite asset valuation growth and decay: a 4 phase fractal series of x/2-2.5x/2-2.5x/1.5-1.6x and a 3 phase fractal series of x/2-2.5x/1.5-2.5x. (For rare crash decay fractals, the ‘x’ is denoted as ‘y’ to indicate decline.)
Below : Lammert yearly fractal progression since 1932; an interpolated part of the US 1807 Hegemonic 36/90/90/54-57 year :: x/2.5x/2.5x/1.5-1.6x asset-debt macroeconomic 4-phase fractal series ending in 2074 to 2077 – with a 36 year 1st fractal nadir in 1842-43, a 90 year 2nd fractal nadir in 1932, a 90 year 3rd fractal interpolated peak on 7 Nov 2021 and an interpolated 4th fractal nadir anticipated in 54-57 years in 2074-2077.
Below is the current yearly fractal model from 1932 to 2026 showing x/2-25x/2-2.5x fractal growth and 1982 13/33 :: x/2.5x 1st and 2nd fractal series peak 6 Oct 2026 valuation growth and initial 2026 and subsequent crash fractal decay.
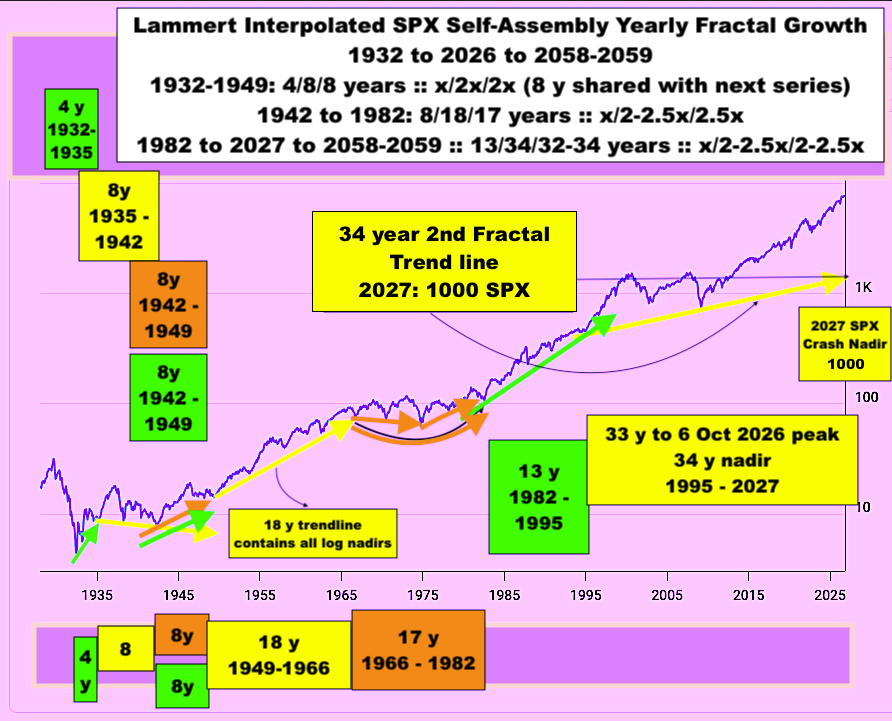
The 1982 13/33 year :: x/2.5x 1st and 2nd fractals (shown below) of an anticipated 13/34/30-32/20 year interpolated 4-phase fractal series would end in 2075-2077.
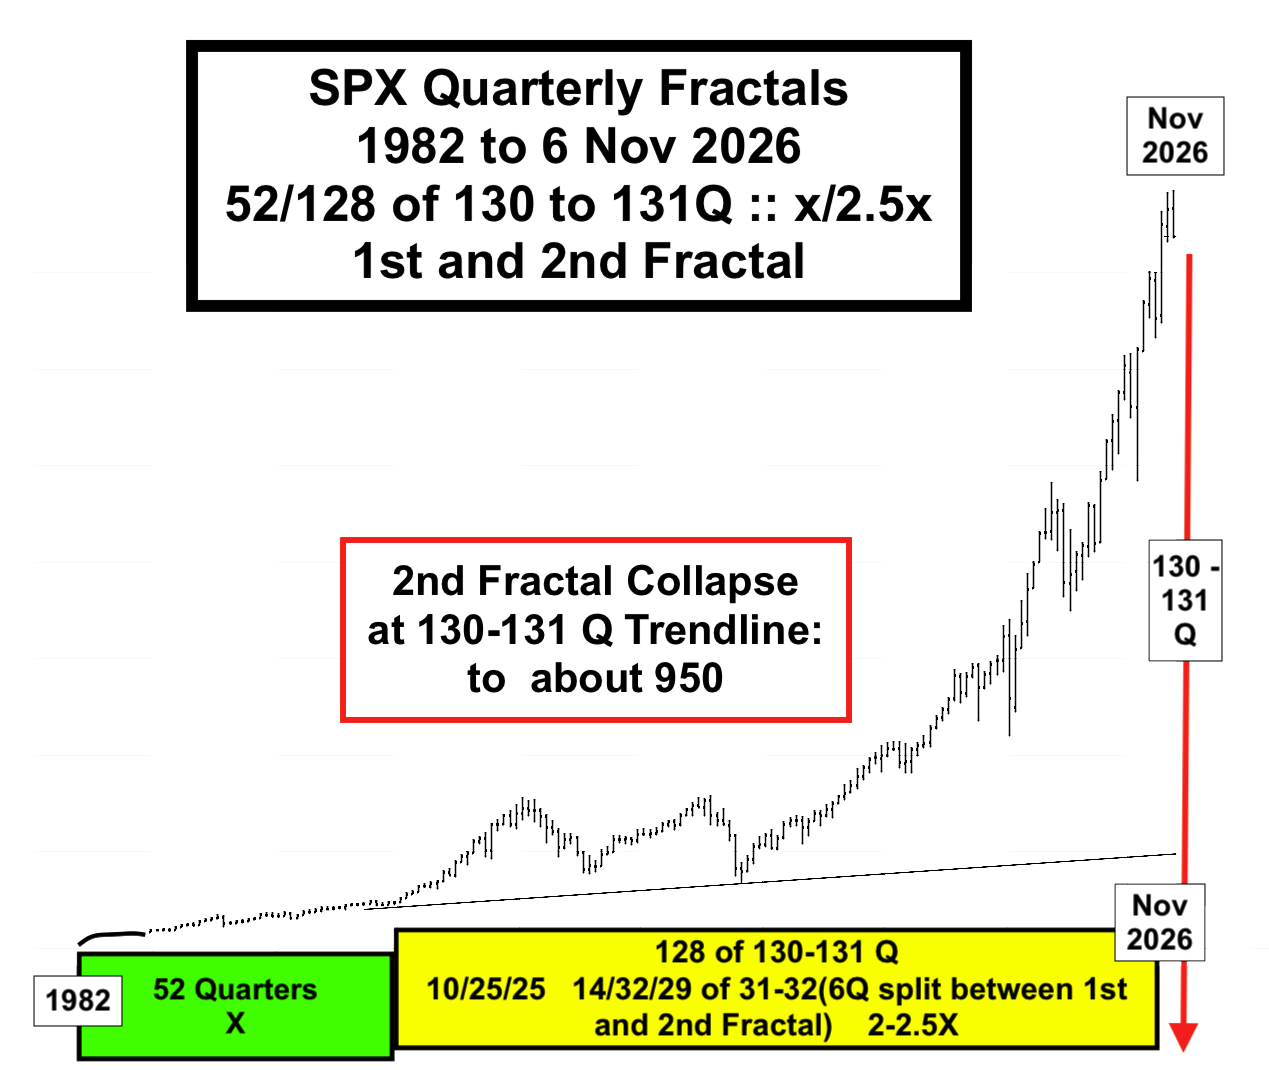
Below: from the 2020 Covid low: a highly ordered 3-Phase Lammert SPX fractal self assembly with the Oct-November 2 month crash ending with a crash nadir on 17 Nov 2026 (without trading halts).
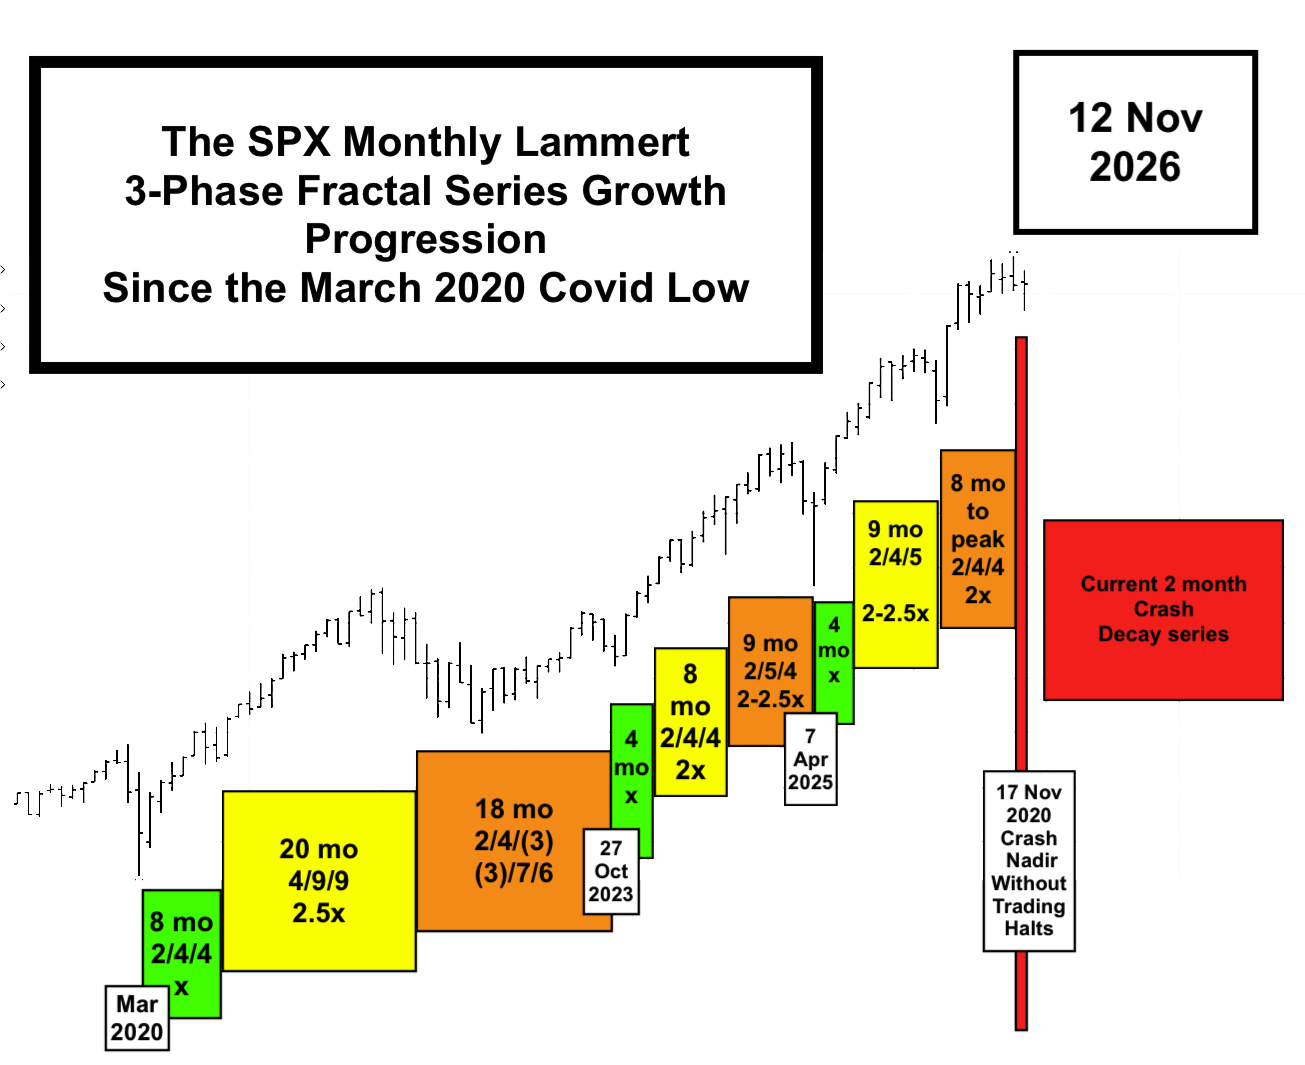
The world is coming to a 19 Oct 1987-like nonlinear initial crash event. By the current Lammert fractal model, that nonlinear gapped lower low valuation crash will come on 16 and/or 17 Nov 2026, held perhaps to a 20% loss for the day by trading halts. The 17 November 2026 SPX nonlinear gapped lower low valuation will represent the most characterizing portion of a terminal 2nd fractal occurrence at the extreme end of a 1994 33 year 2nd Fractal of a 1982 13/33 year : : x/2.5x 1st and 2nd Fractal Series and peaking on 6 October 2026 with a opening trading day exhaustion gap. A nonlinear 2nd Fractal Crash could have occurred anywhere in the 2x to 2.5x :: 26-33 year terminal portion of the 1994 33 year 2nd fractal. The 90 year nominal 3rd fractal occurred as an interpolated fractal phenomena on 7 November 2021. With unprecedented peacetime US governmental deficit to GDP annual spending of 5.8-14.9% from 2020 to 2026 and with recent massive private debt expansion for AI/chips/data-centers, facilitated equity growth thru favored ever-lowered corporate tax schedules and massive corporate stock buy-backs, the SPX peaked on 6 October 2026 occurring near the maximum of the 26-33 year :: 2x-2.5x 2nd fractal growth time duration. Unlike 19 Oct 1987, which occurred in a long robust growth and credit expansion period, 16 and 17 Nov 2026 will occur under the umbrella of an ongoing enormous private bad-debt-dependent collapse with fractal dependent lower high counter-growth and lower lows nadirs to reach the deterministic system equivalent of 8 July 1932 for the DJIA and 1 June 1932 for the SPX.
64% of global currency debt is denominated in US dollars. Gold, bitcoin, US, and world equities will undergo an initial nonlinear valuation collapse on 16 and 17 Nov 2026, followed by further liquidation of assets in a asset-debt system response to repay private dollar-denominated debt.
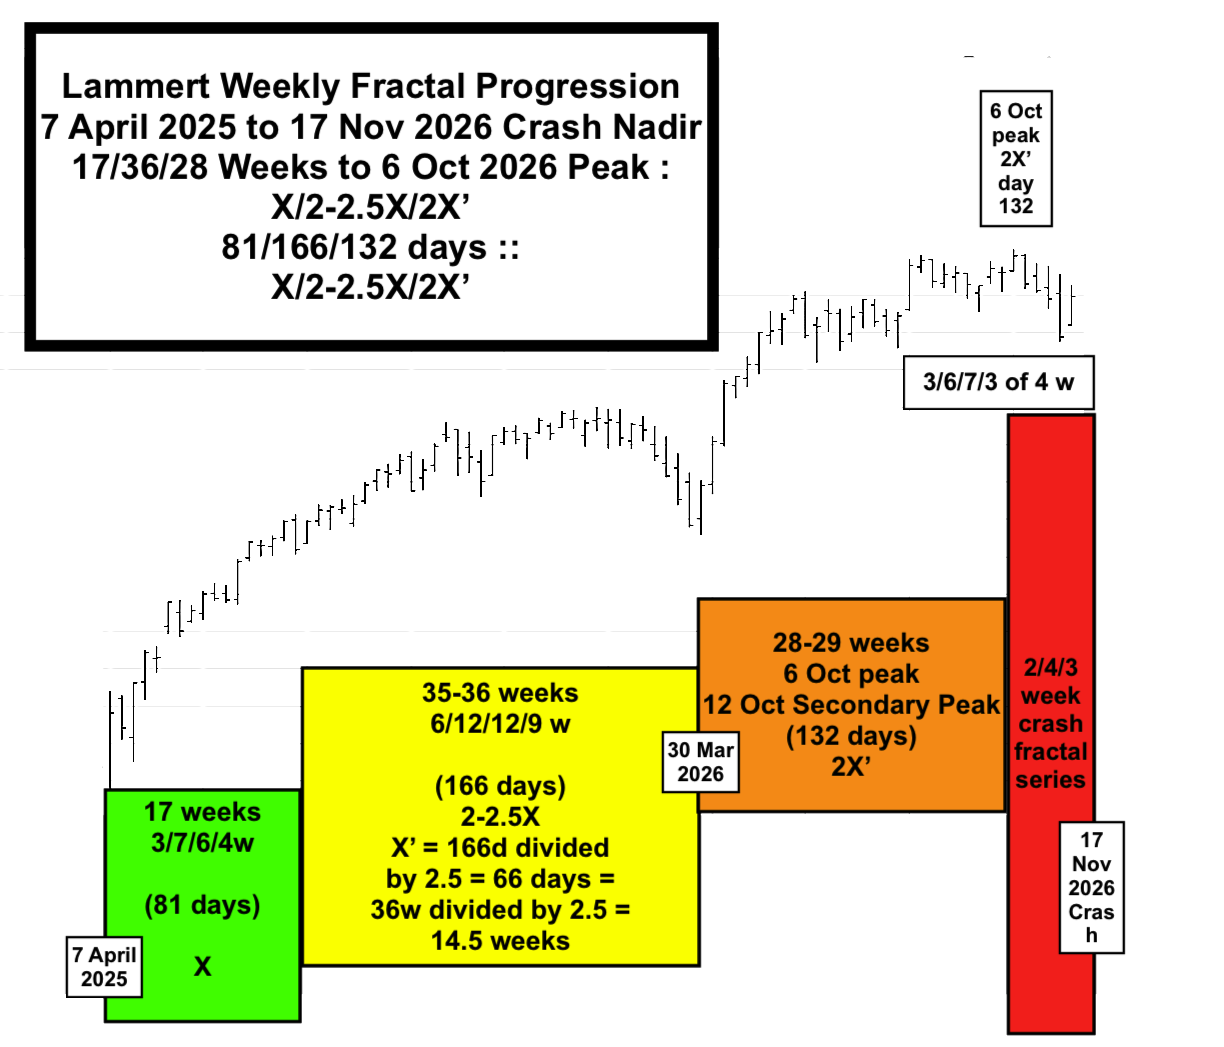
Below is the weekly (and daily) fractal progression from the 7 April 2025 nadir. X’ represents the retrospective ideal 1st fractal time length given the observed and measured time length of the 2nd fractal and is equal the measured amount divided by 2.5.
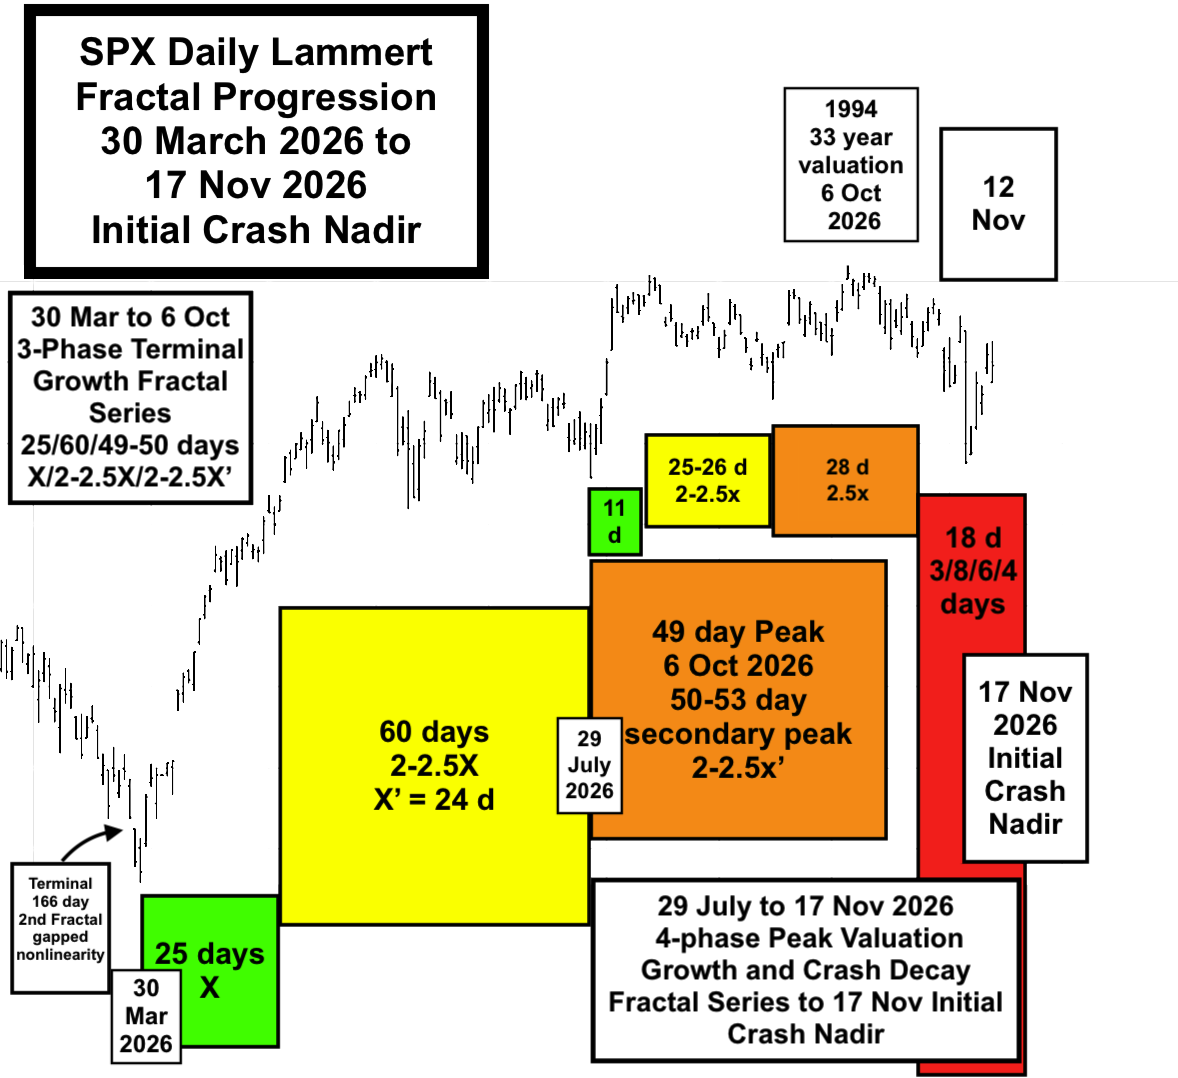
Below is the daily fractal series from the 30 March 2026 SPX nadir valuation. Notice the nonlinear low in the terminal portion of the 186 day second fractal.
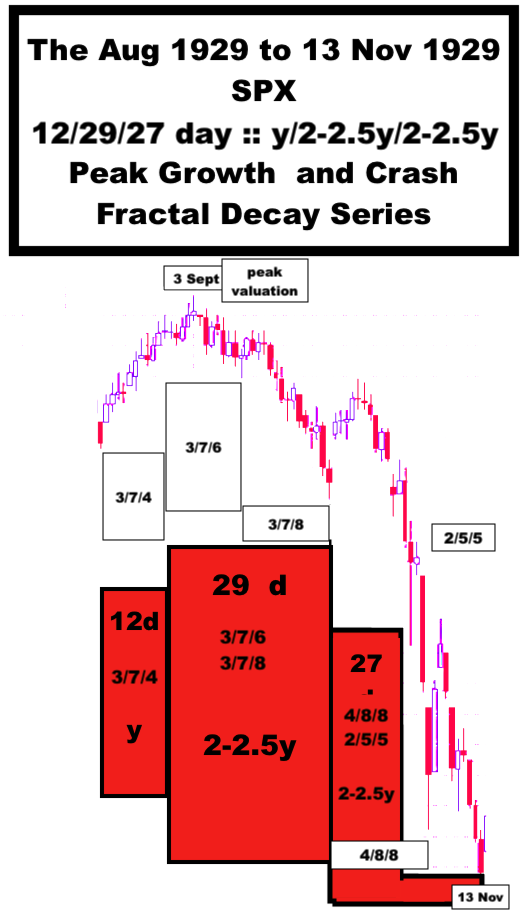
Below is the current SPX initial fractal decay model from the 33 year 2nd fractal 6 October 2026 peak valuation consisting of two sequential Lammert fractal decay series, a 3-phase fractal series and a 4-phase fractal series.
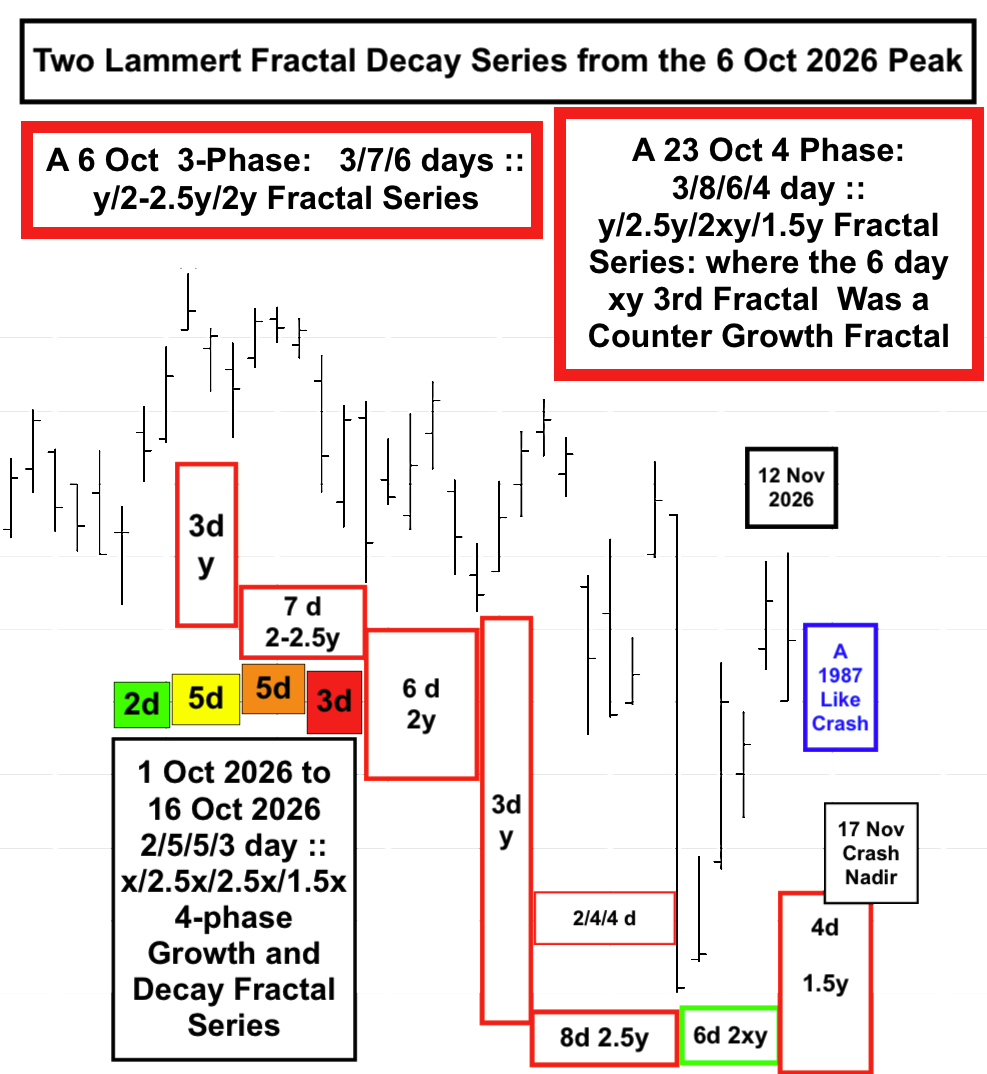
The first fractal decay series is a 3-phase 3/7/6 day :: y/2-2.5y/2y series where the underlying trend line is curvilinear with decreasing negativity ending on 23 Oct 2026. The 2nd fractal series starting 23 October is a 4-phase y/2.5y/xy/1.5y :: 3/8/6/1 of 4 day fractal series where the 3rd fractal of 6 days is a counter growth series. Nonlinearity on 16 and 17 November 2026 will very likely exceed that of 16, 19 Oct 1987.
Yearly, quarterly, monthly, weekly and daily time unit fractal series have been presented to provide empirical evidence of the validity of a counterbalancing, elegantly simple, self-assembly, time-unit dependent, fractal asset-debt macroeconomic system.
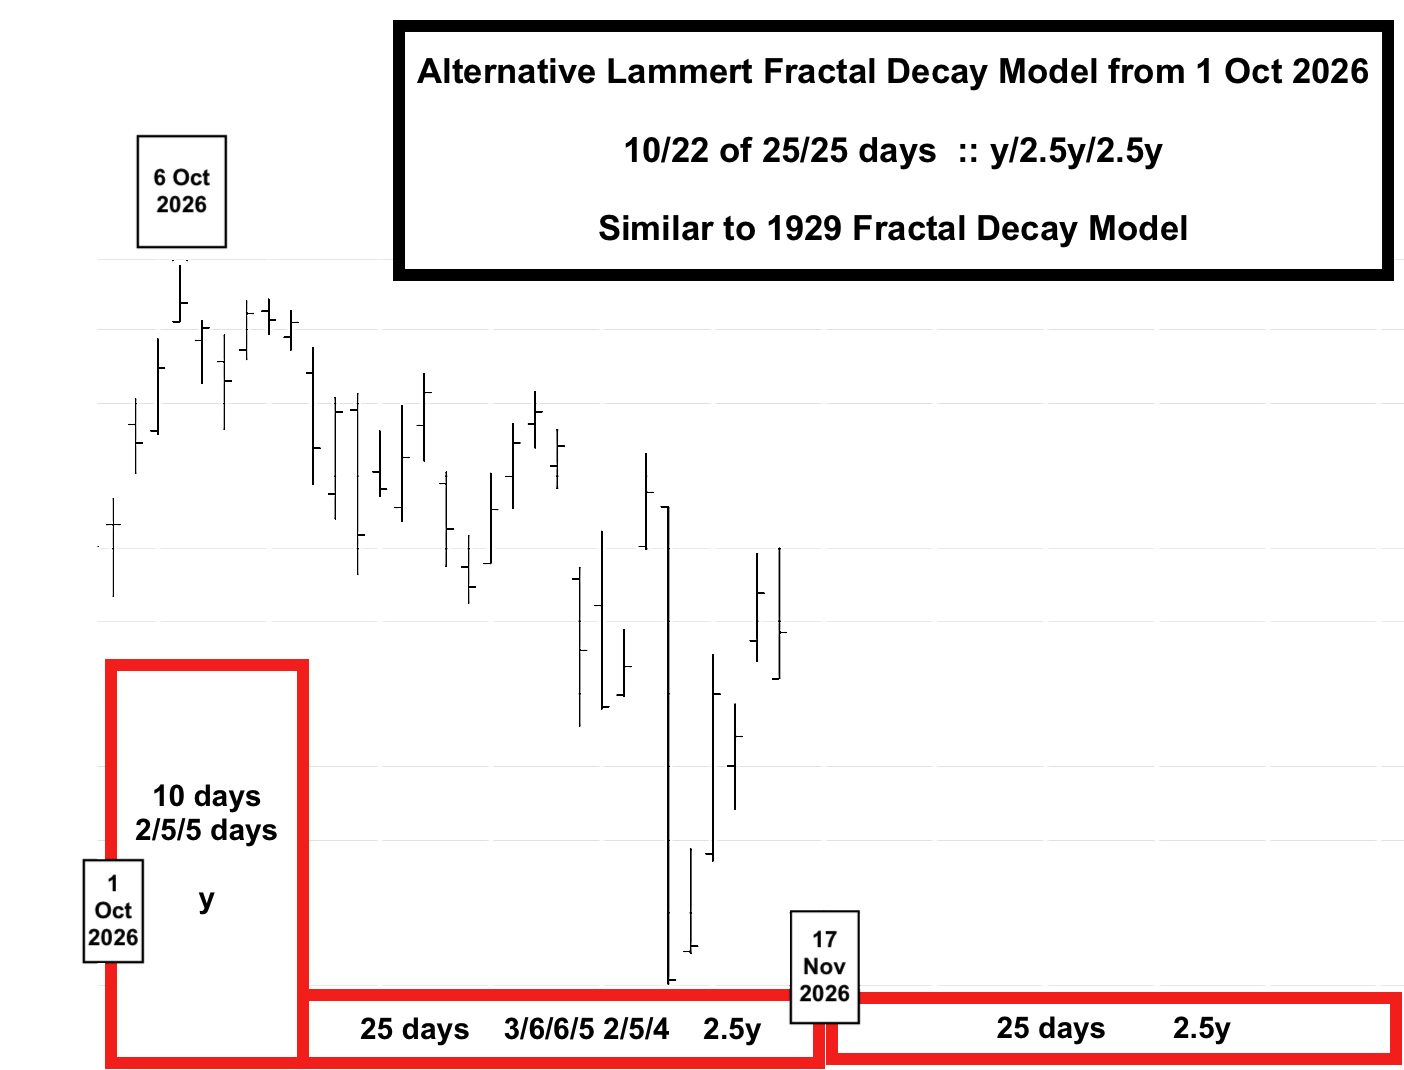
An alternative 3-phase Lammert Fractal Decay Model if less than a 20% crash on 17 Nov 2026: