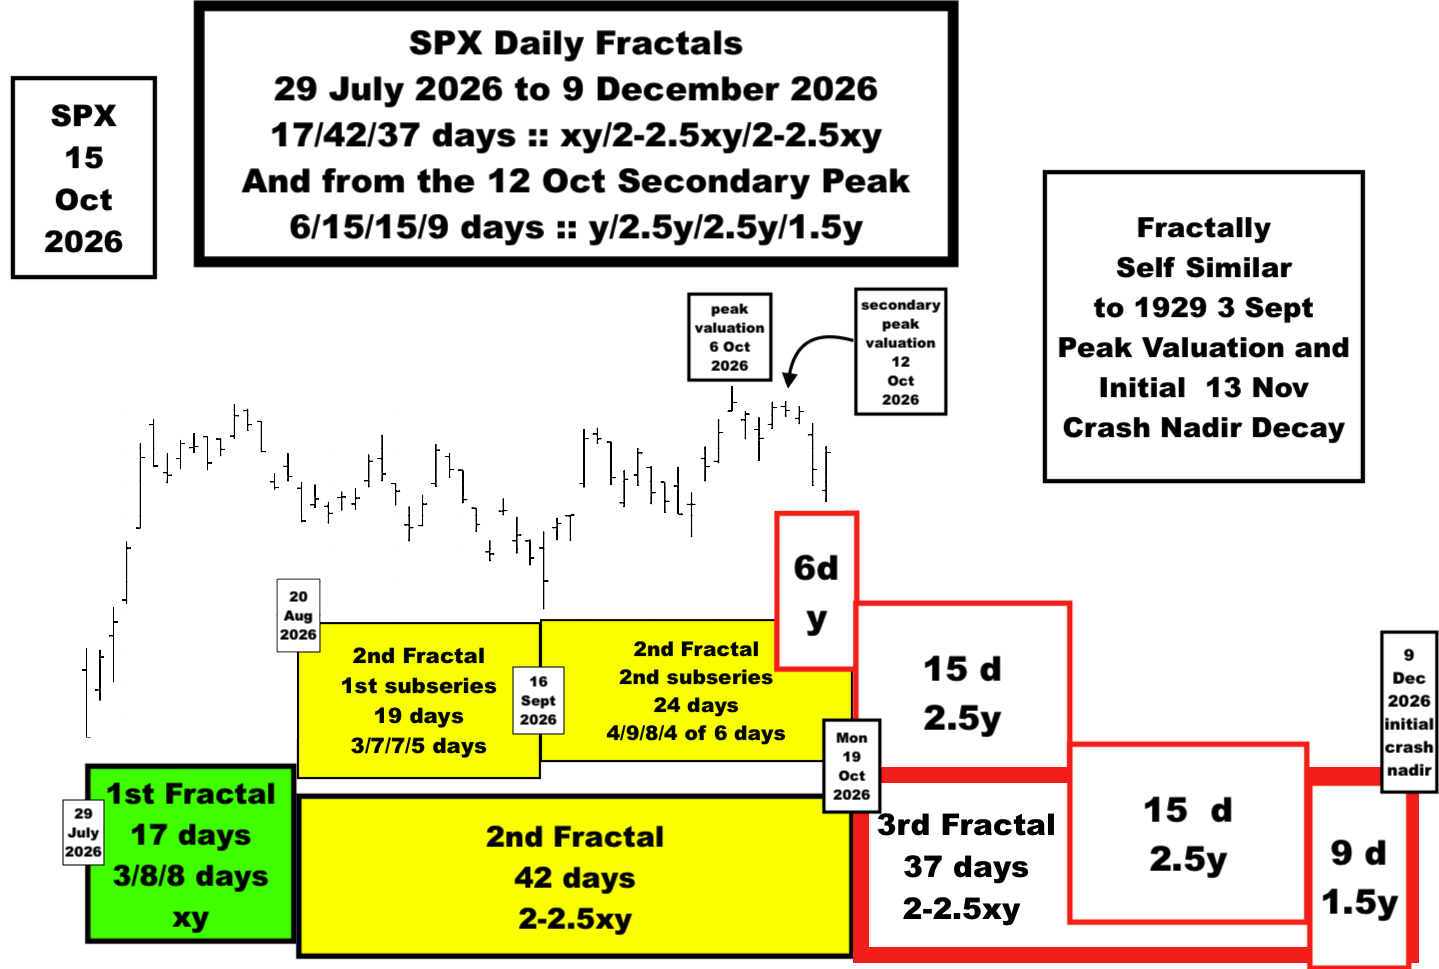
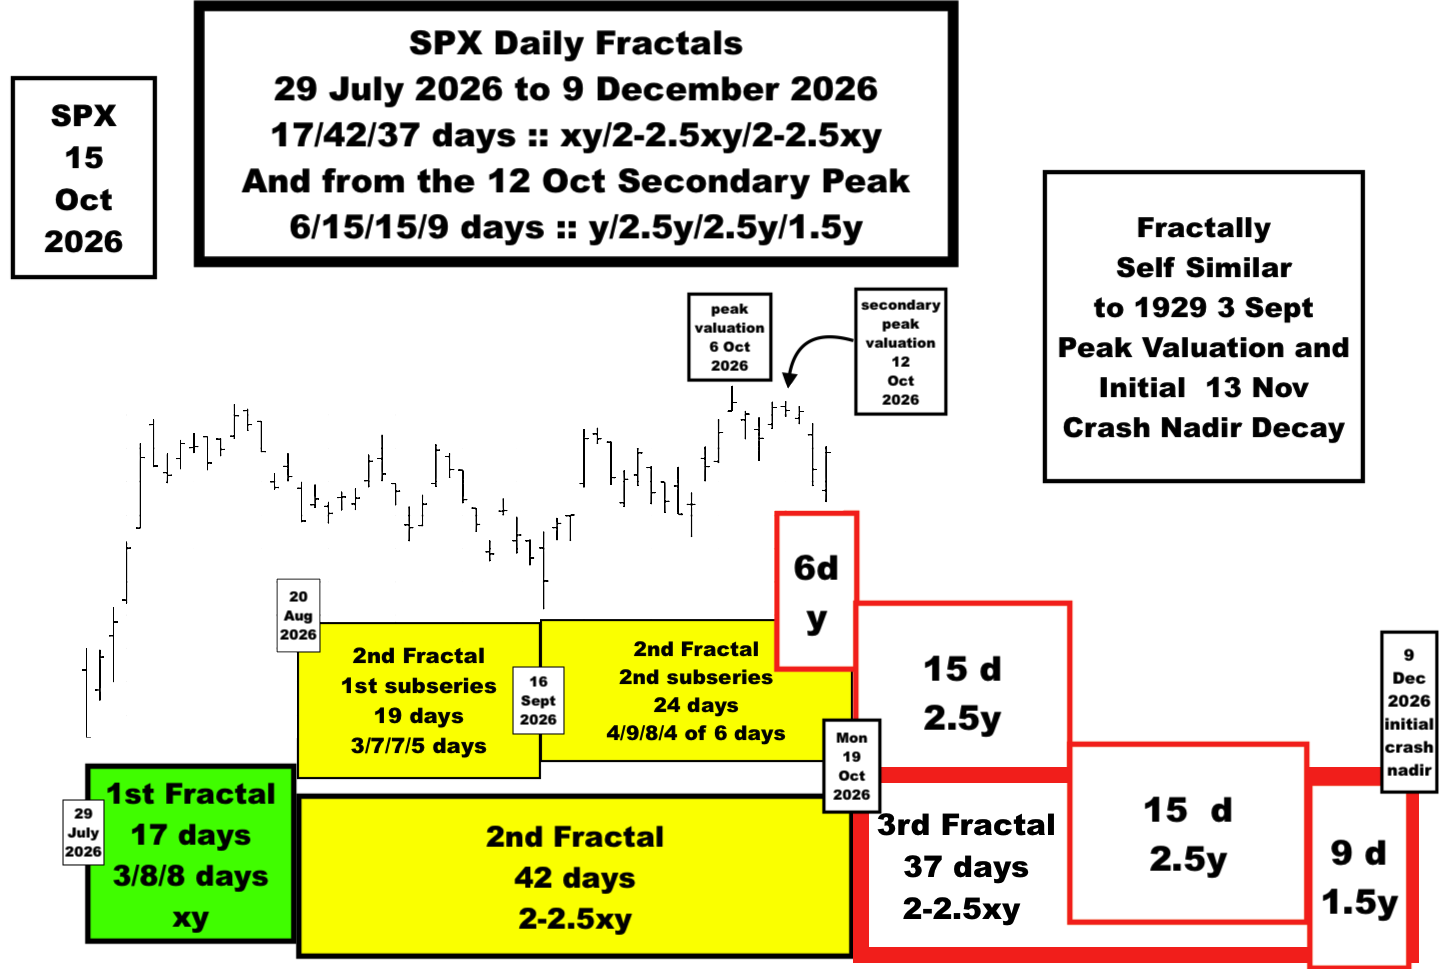
For the SPX composite a nonlinear lower low gap is expected between Friday 16 October and Monday 19 October 2026. 19 October concludes the 42 day second fractal of a 29 July 2026 to 9 December 2026 17/42/37 day :: xy/2-2.5xy/2-2.5xy (of a SPX 1982 13/33-4 year :: x/2.5x 1st and 2nd fracal series) terminal 3-phase peak valuation growth and initial crash decay Lammert fractal series. Interpolated within this series is a (secondary SPX lower high peak valuation occurring on) 12 October 2026: 6/15/15/9 day :: y/2.5y/2.5y/1.5y, a 4-phase Lammert fractal decay series ending on 9 December 2026. This is fractally self similar to the 1929 3 September 1929 peak valuation and initial 13 November 1929 crash decay as described in the previous post.
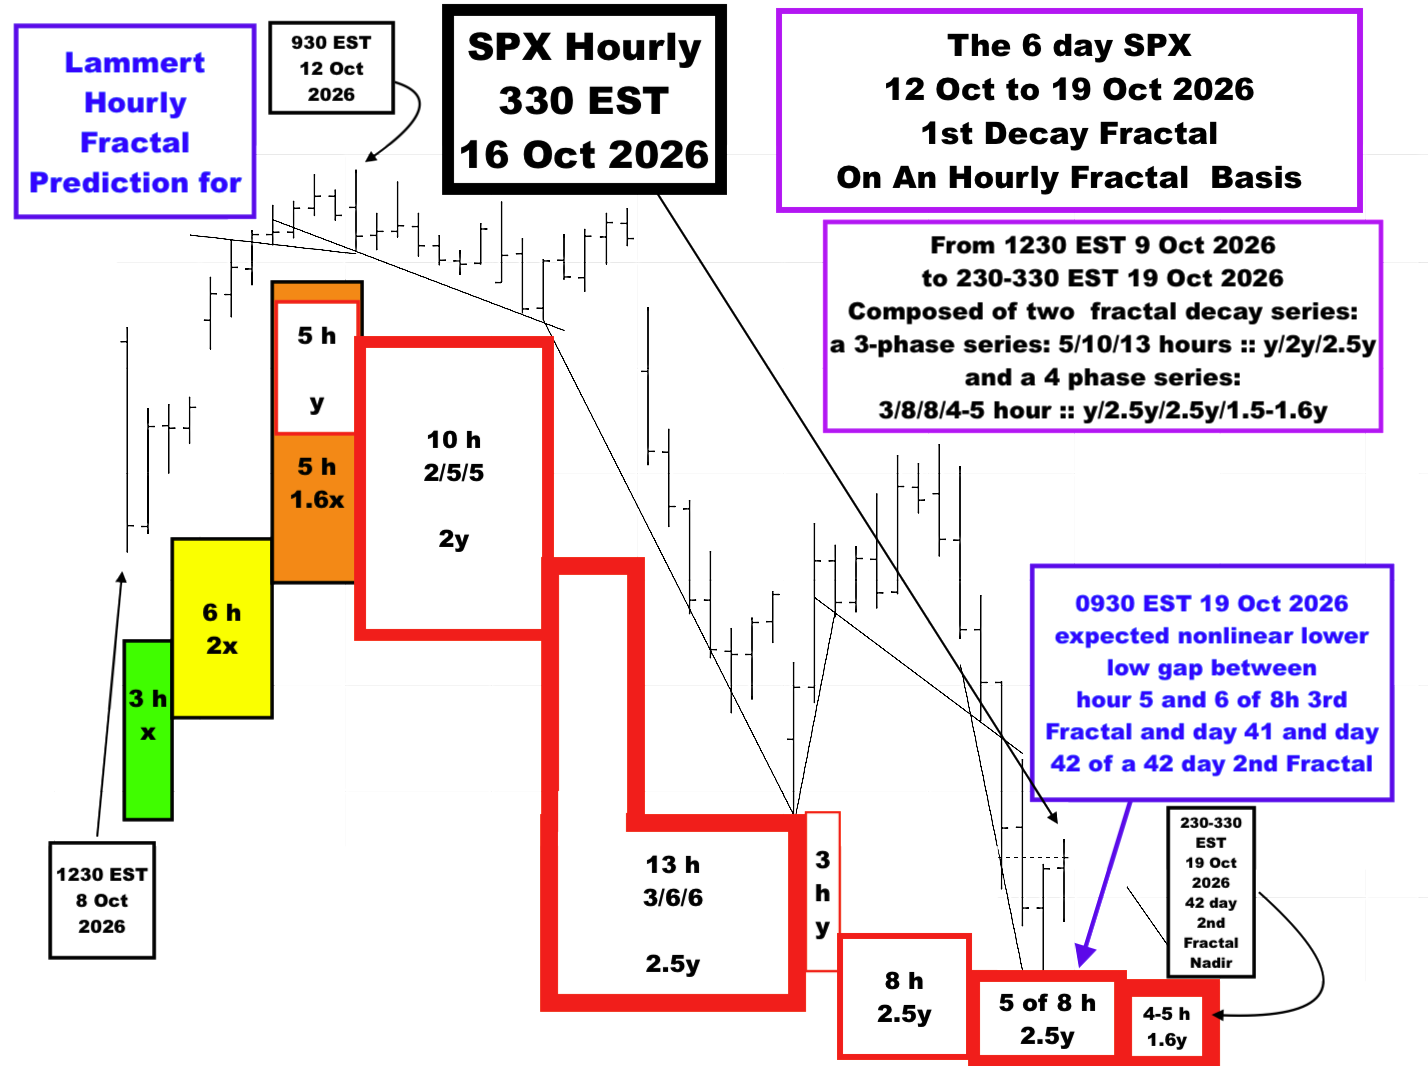
The Lammert hourly fractal pattern predicted for 19 October 2026 is depicted above. Two hourly decay fractal series are shown above: a completed 5/10/13 hour :: y/2y/2.5y 3-phase fractal decay series with a 5 hour 1st fractal starting on 1230 EST 9 Oct 2026 and ending 930 EST 12 October 2026 and the 13 hour 3rd fractal ending 930 EST 15 Oct 2026.
The 3/8/5 of 8/4-5 hour :: y/2.5y/2.5y/1.5-1.6 4-phase fractal decay series starts on 930 EST 15 Oct 2026 and ends on 230-330 EST 19 October 2026 with an expected nonlinear lower low gap between 330 EST 16 October and 930 EST 19 October and between day 41 and day 42 of the 2nd Fractal of the 29 July 2026 to 9 Dec 2026 17/42/37 day :: xy/2-2.5xy/2-2.5xy SPX Lammert 3-phase peak valuation and initial crash decay series.
From the 2005 main web page of the Economic Fractalist:
“… A sudden nonlinear drop in the last 0.5x time period of the 2.5X is the hallmark of a second cycle (fractal)and characterizes this most recognizable cycle(fractal)...
G. Lammert This page was last updated on 15-May-2005 01:21:59 PM .”
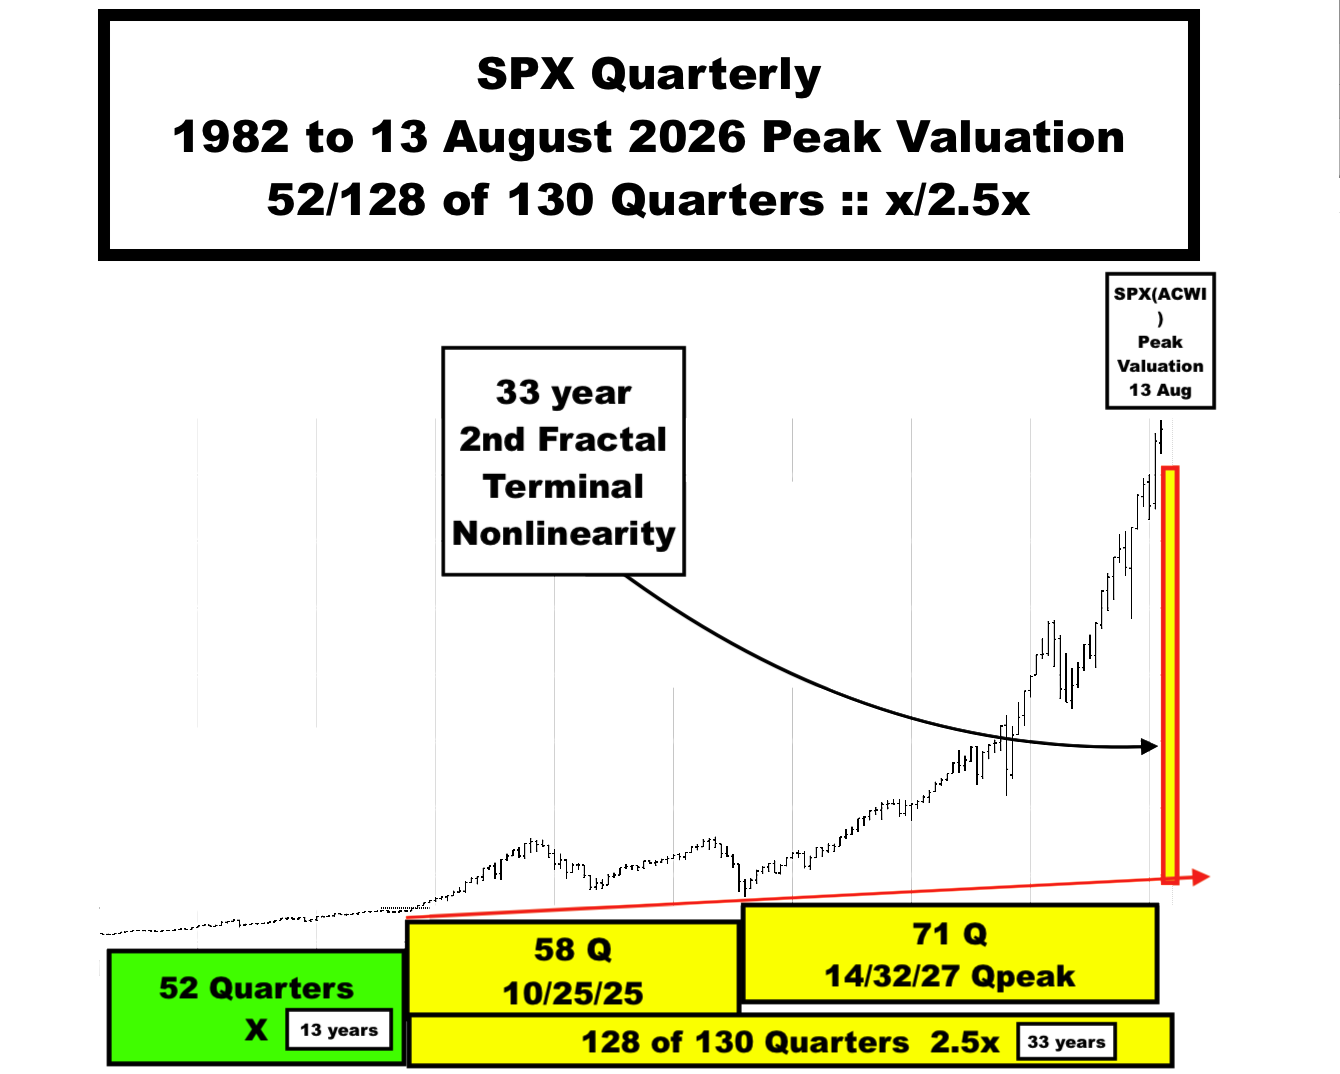
6 October 2026 concluded the SPX’s peak valuation growth in a 1982 to 2026 13/33-34 year :: x/2.5x 1st and 2nd fractal series, an interpolated series within a US hegemonic 1807 36/90/90/54-57 year :: x/2.5x/2.5x/1.5-1.6x 4-phase fractal series.
The SPX 1929 peak valuation on 3 Sept 1929 was near the end of a 1807 36/90 year :: x/2.5x 1st and 2nd fractal series which ended at year 90 (2.5x)in 1932.
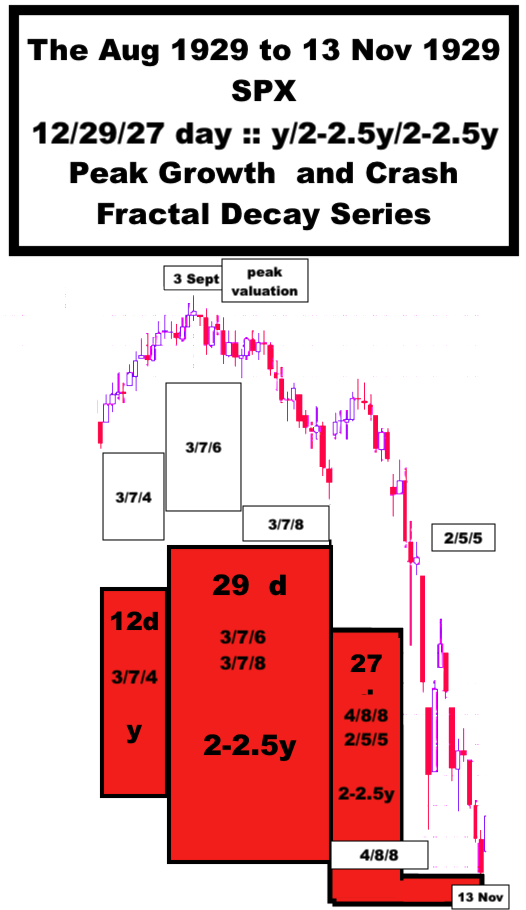
The above depicts the Aug to Nov 1929 12/29/27 day :: xy/2-2.5 xy/2-2.5xy 3-phase fractal series that contains the 1807 :: 36/87 x/2-2.5x 3 Sept 1929 peak valuation and initial 13 Nov 1929 crash nadir valuation decay.
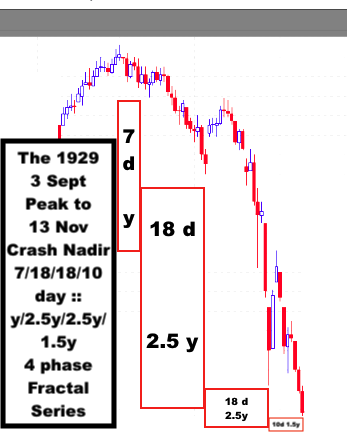
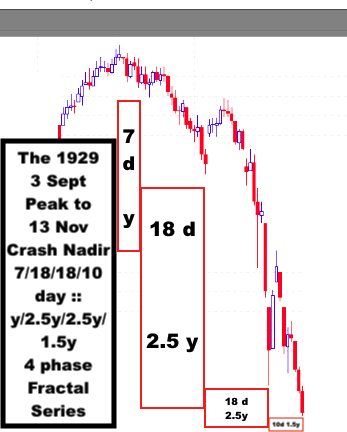
From the 3 Sept 1929 peak, a 7/18/18/10 day :: y/2.5y/2.5y/1.5y 4-phase fractal decay series ends at the initial crash nadir on 13 November 1929.
The above depicts the current fractal model of a 1929 self similar SPX 29 July 2026: 17/42/37 day :: xy/2-2.5xy/2-2.5xy with a 1982 13/33 year :: x/2.5x peak valuation on 6 Oct 2026, a secondary peak on 12 Oct 2026 and an initial crash nadir on 9 December 2026.
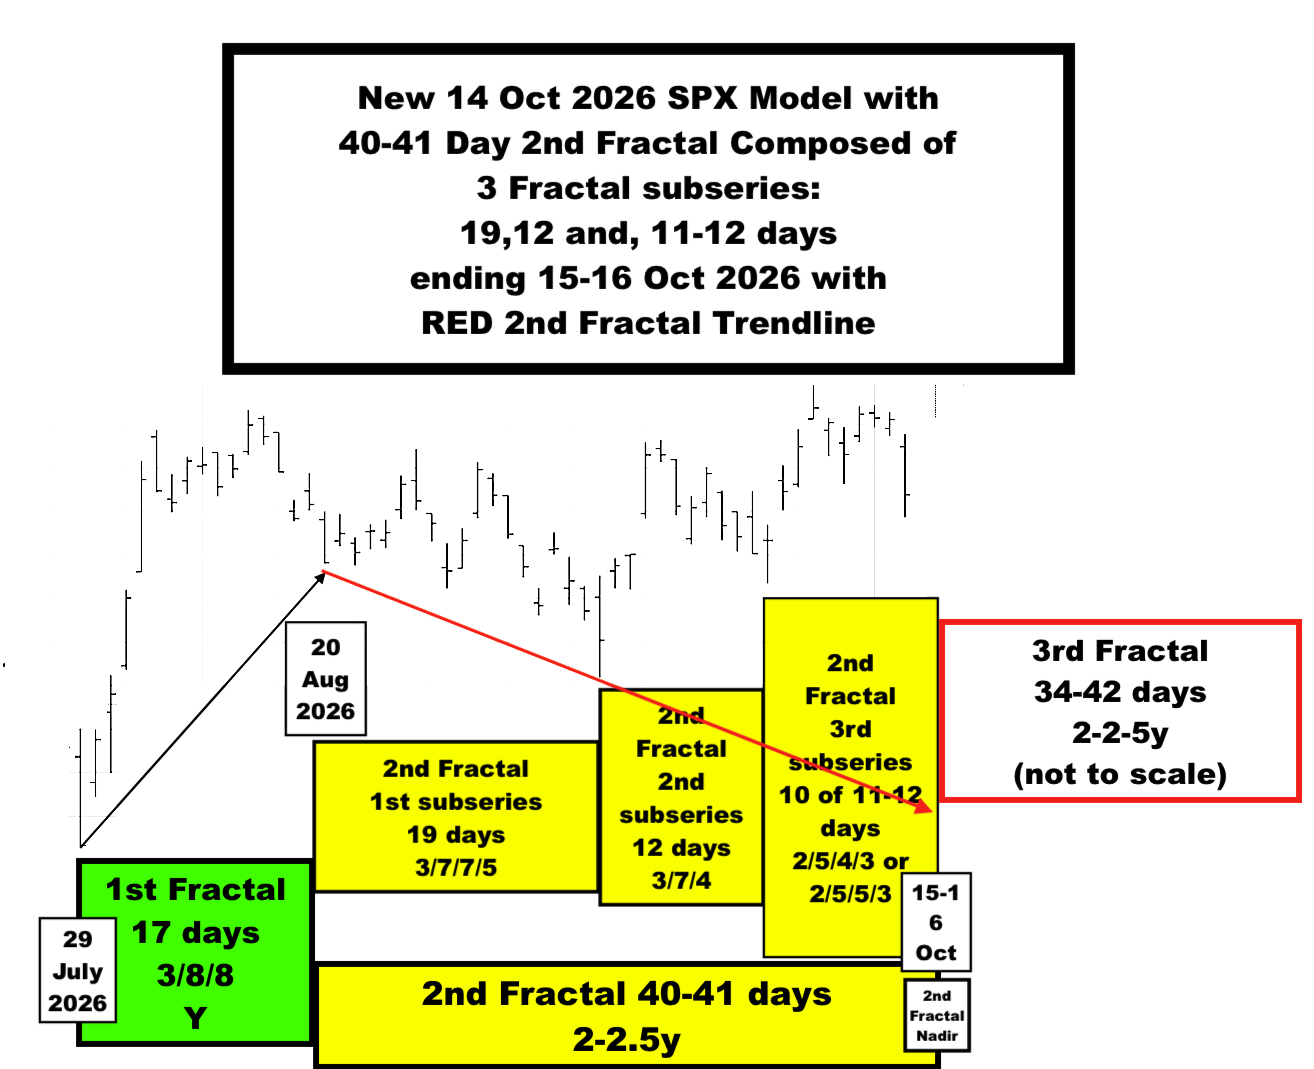
The 29 July to 20 Aug 2026 17 day 1st fractal is composed of a 3/8/8 day 3 phase fractal series. The 20 Aug 42 day 2nd fractal ending Monday 19 Oct 2026 is composed of two 4-phase fractal subseries: a 20 August 3/7/7/5 day series ending 16 Sept 2026 and a 16 Sept 4/9/8/6 day series ending Monday 19 Oct 2026.
From the SPX secondary peak on 12 Oct, day 8 of the 3rd 8 day fractal of a 1 Oct 4/9/8 day 3-phase growth fractal series, a 6 day 4th fractal ends on the 16 Oct 2026 42 day 2nd fractal nadir. A 4-phase y/2.5y/2.5y/1.5y : 6/15/15/9 day fractal series ends on the 9 December 2026 nadir.
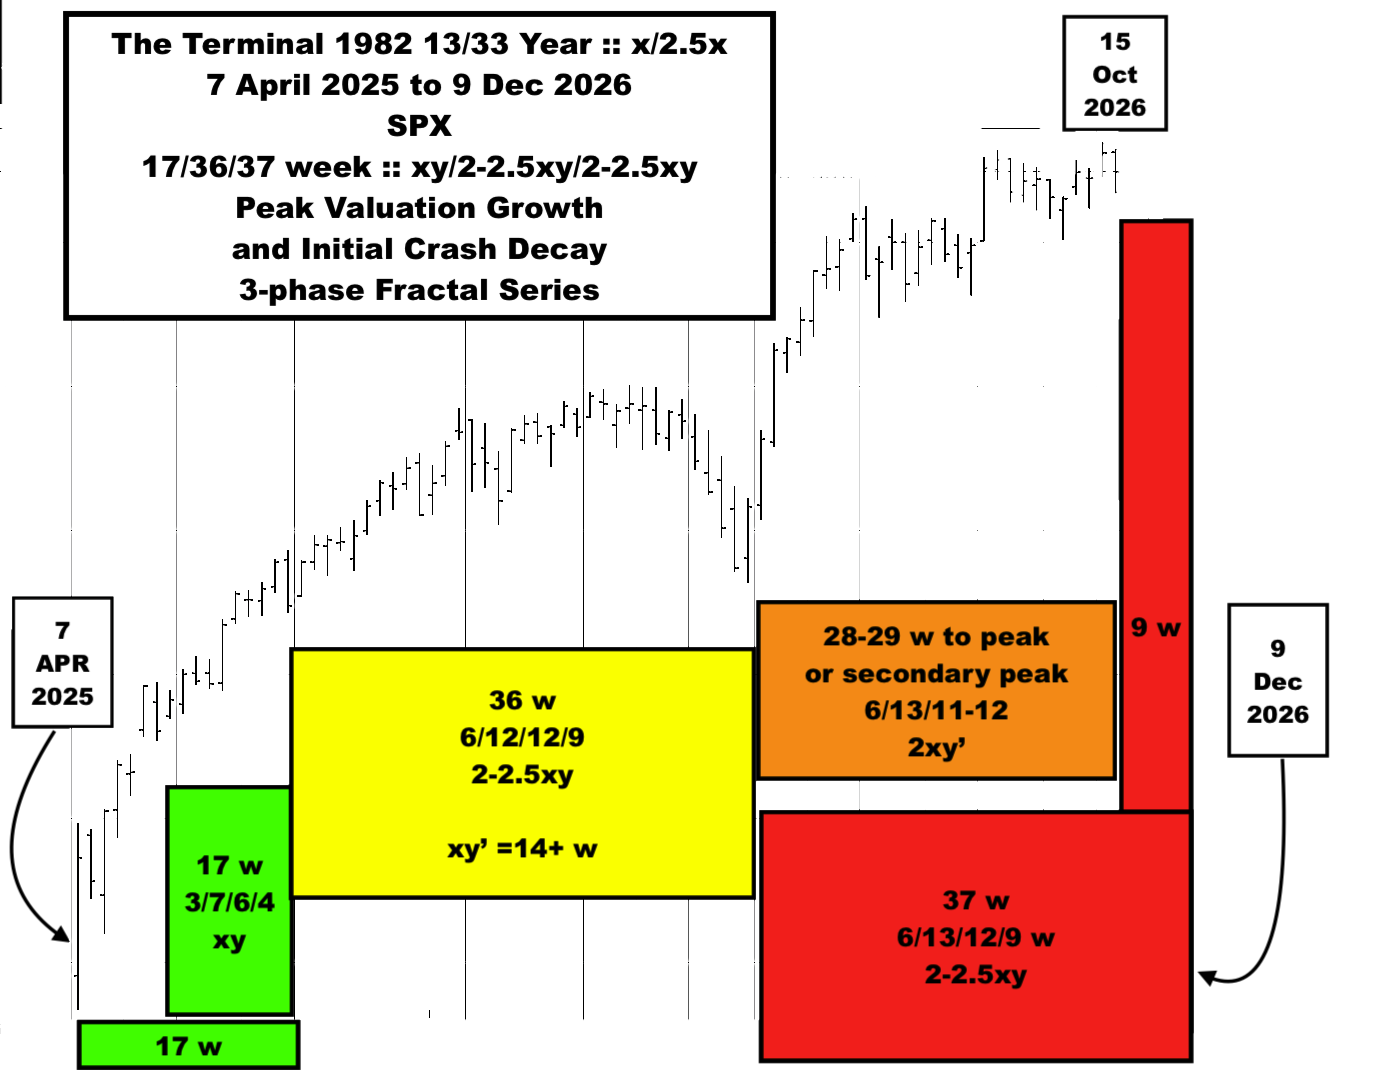
The above daily 29 July 2026 to 9 December 2026 fractal series completes a 7 April 2025 17/36/37 week :: xy/2-2.5xy/2-2.5xy fractal series. The 37 week 3rd fractal is composed of a 30 March 2026 6/13/12/9 week :: x/2-2.5x/2x/1.5x 4 phase fractal series corresponding to a 30 March 2026 25/60/57/37 day :; x/2-2.5x/2-2.5x/1.5x 4-phase fractal series. The 3-phase xy/2-2.5xy/2-2.5xy 29 July 2026 to 9 Dec 2026 daily peak valuation and initial crash to nadir value fractal series is fractally self-similar to the 7 April 2025 to 9 Dec 2026 weekly 3-phase xy/2-2.5xy/2-2.5xy peak valuation and initial crash to nadir valuation fractal series.
The Case for Quantitative Lammert Fractal Macroeconomics
(How much higher would the SPX have peaked without the concurrent energy prices and inflation secondary to the Ukraine war, Iran war, and ever mutable trade policies?)
The Asset Debt Macroeconomic System integrates good and excessive bad (unrepayable) private credit growth, asset overproduction, asset overvaluation, asset over-ownership and sets the time limits for peak asset valuation and subsequent valuation decay. Daily trade-able composite equity and commodity asset valuations are deterministically self-organized, self-assembled by the system into two easily-identifiable empirical repetitive time-based growth and decay fractal patterns denominated in fractal units of minutes, hours, days, weeks, months and years: a 3-phase fractal series: x/2-2.5x/1.5-2.5x and a 4 phase fractal series: x/2-2.5x/2-2.5x/1.5-1.6x
The 2-2.5x second fractals in the. above serie are characterized terminal nonlinearity in their final 2x-2.5x time frame
From 1807, the growing US hegemony is following a 4-phase 36/90/90/54-57 year fractal series :: x/2.5x/2.5x/1.5-1.6x ending in 2074-77.
The 90 year second fractal ending in 1932 with a SPX having a peak valuation and initial crash nadir in 1929 on 3 Sept and 13 Nov 1929 respectively. The peak and nadir were contained in a 3 phase x/2-2.5x/2-2.5x (or better xy/2-2.5xy/2-2.5xy denoting both peak growth and initial nonlinear decay) fractal series of 12/29/27 days.
The 1932 90 year 3rd fractal and subsequent 54-57 year 4th fractal are composed of two fractal series: a 1932 10-11/20-21/20-21 year 3-phase fractal series ending in 1982 and a 1982 13/33-34/30-33/20 year 4 phase fractal series ending in 2074-2077.
The system is at the end of peak valuation of the 33 year second fractal of the 1982 13/33-34 year :: x/2.5x fractal series with expected 33 year terminal second nonlinear valuation devolution.
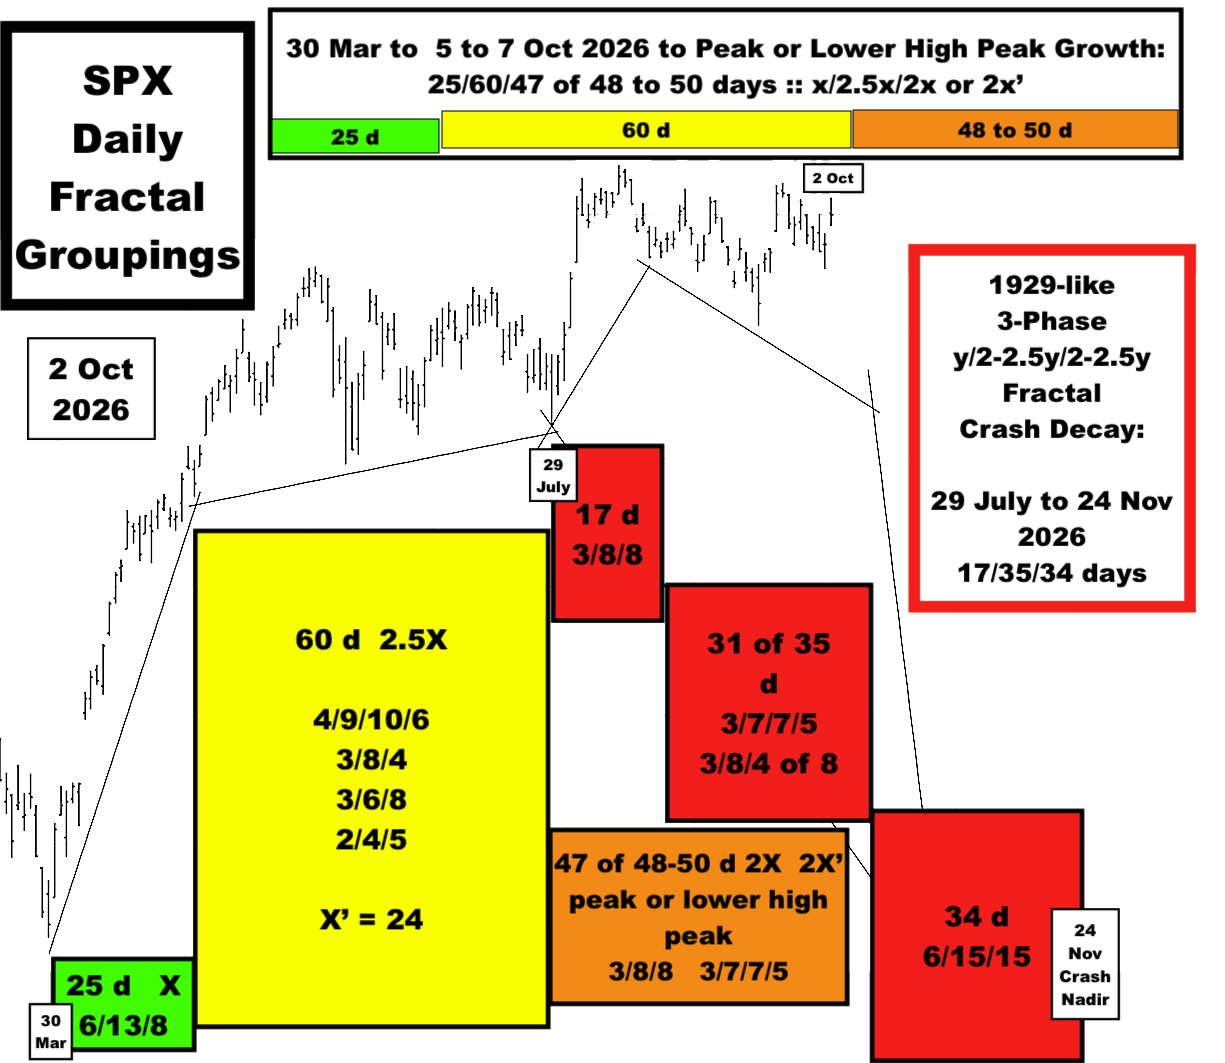
The 2026 peak and initial crash valuation is self-organized in a 29 July 2026 to 24 November 2026 3 phase fractal series of 17/35/34 days :: x/2x/2x. (‘y’ has been used denote a devaluation, but ‘xy’ is again perhaps more appropriate for both 1929 and 2026 in that the 3-phase fractal series contains both peak valuation growth and initial nonlinear crash decay)
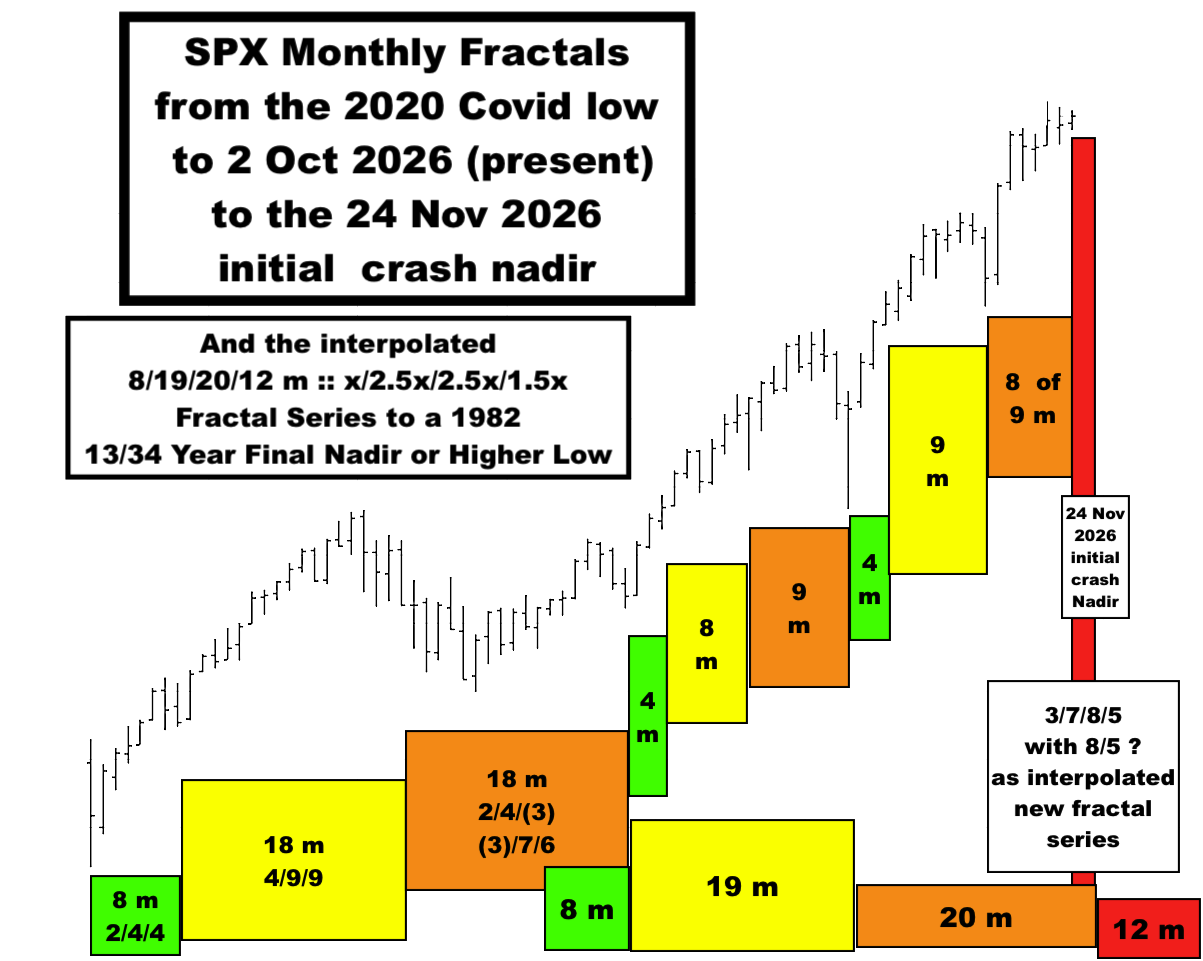
From the Covid March 2020 low, the SPX, boosted by governmental checks directly to private citizens followed a 8/18/18 month :: x/2-2.5x/2-2.x fractal growth patterns with an interpolated 8/19/19 of 20 month pattern (as of 2 Oct 2026) as shown above.
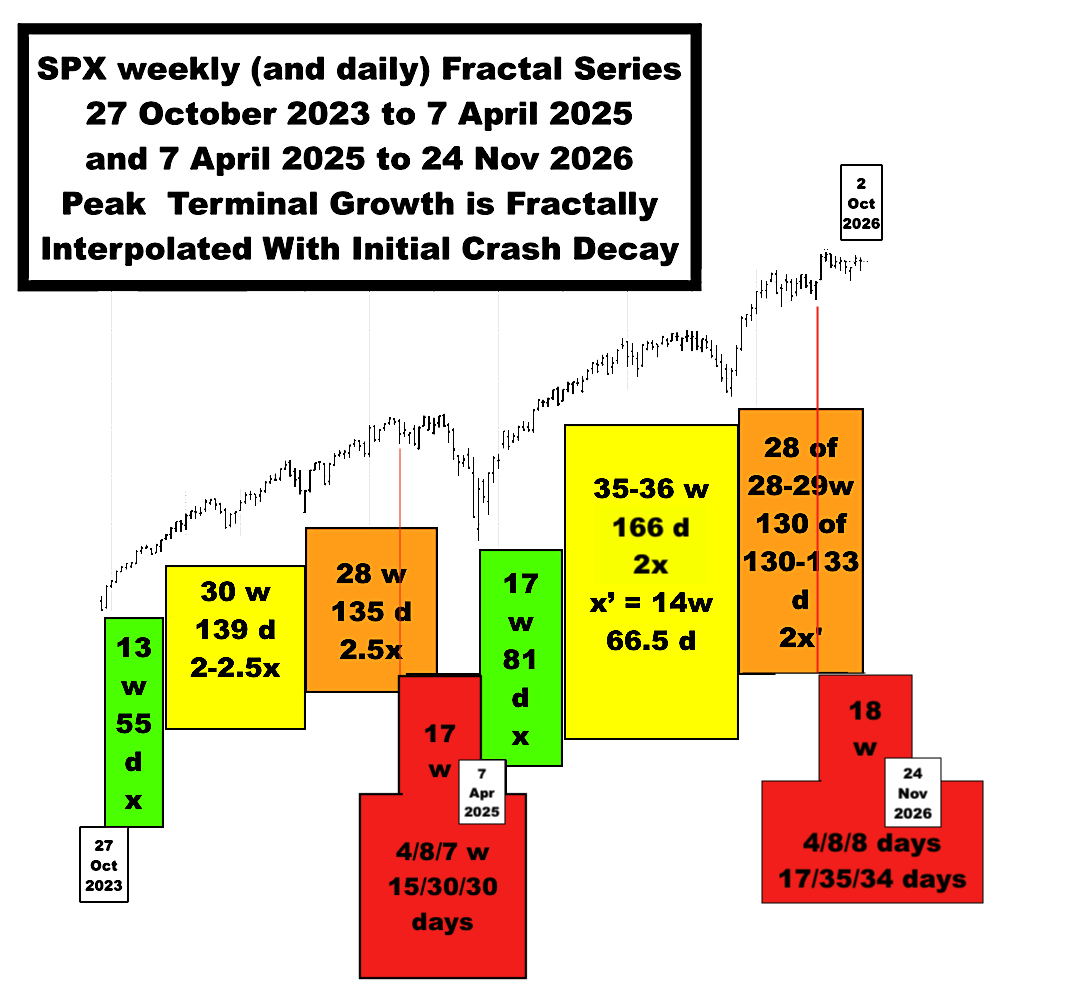
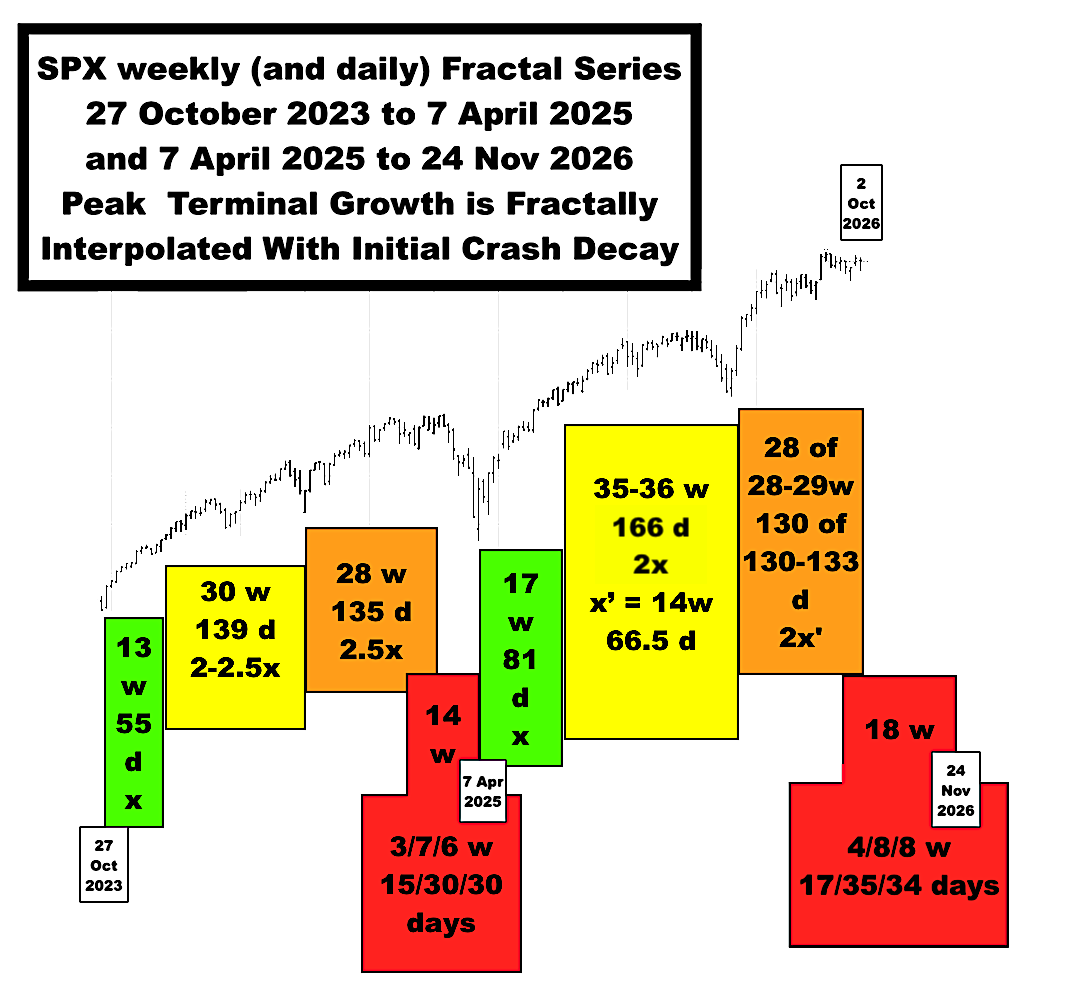
Above: the SPX weekly (and daily) fractal growth patterns of the 27 Oct 2023 to 7 April 2025 19 month second fractal and the 7 April 2025 to currently 2 Oct 2026 3rd 19 month fractal (to the interpolated 8 month first fractal) are shown above.
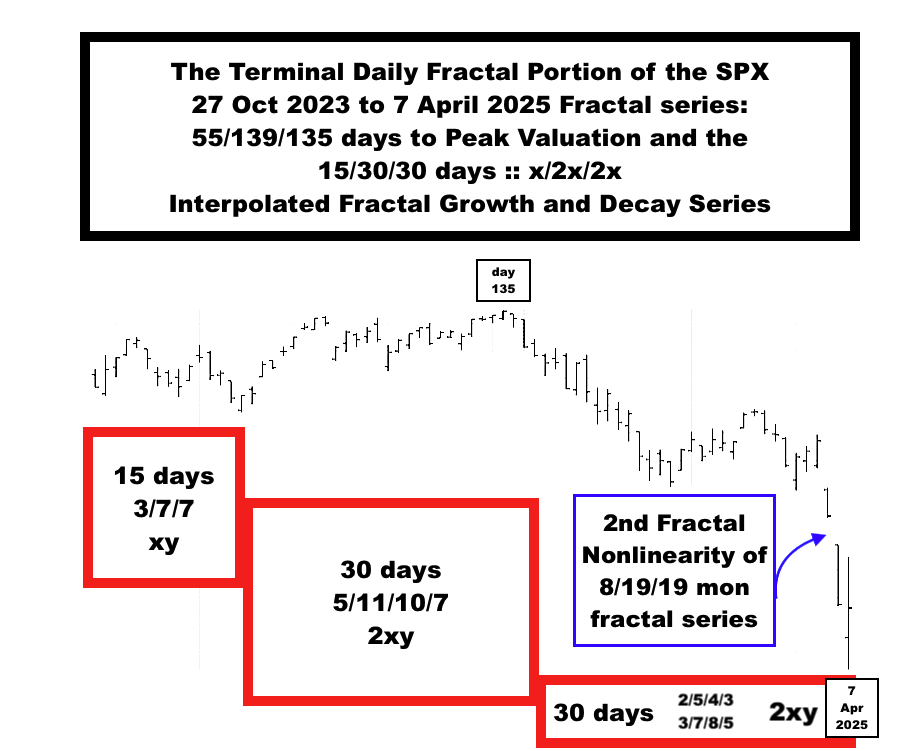
The SPX terminal 15/30/30 day :: xy/2xy/2xy 3 phase fractal series (fractally similar to 1929) resulting in the 7 April 2025 nadir is shown above.
The 14 week fractal series (15/30/30 days) is interpolated and conjoined with the 27 Oct 2023 55/139/135 day :: x/2.5x/2.5x peak valuation 3 phase growth series. The 7 April 2025 to 24 November 2026 3rd fractal series is self similar to the 27 October 2023 to 7 April 2025 fractal series: a 17/35-36/28-29 week :: 81/166/130day of 130 -133 day : x/2x/2x’ growth series takes the SPX to a final peak or lower high peak valuation.
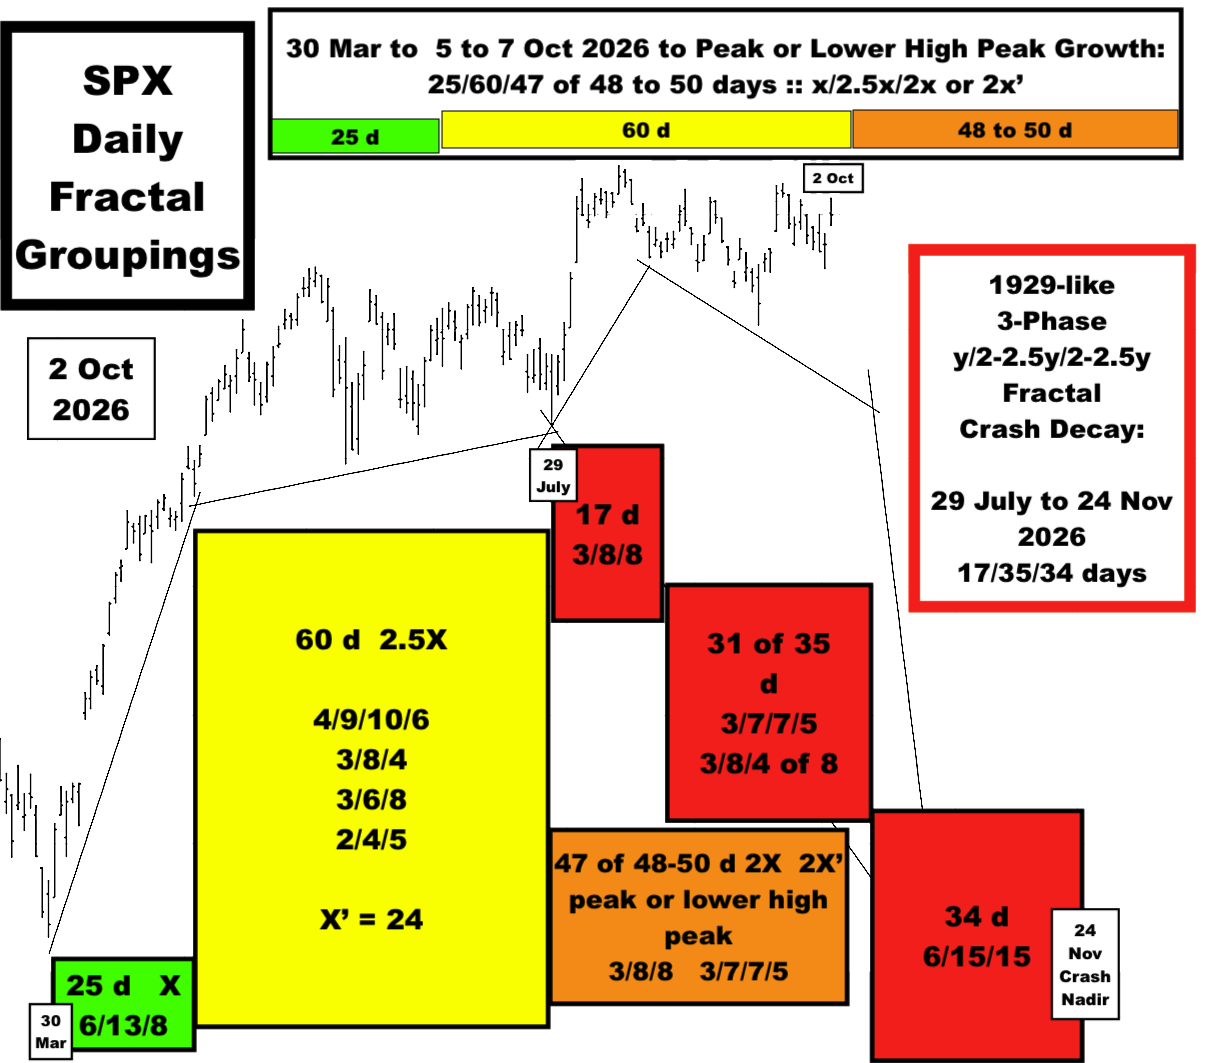
A 29 July to 24 Nov 2026 4/8/8 week :: 17/35/35 day :: x/2xy/2xy 3- phase (1929 -like) fractal growth and decay series contains the 1982 13/33 year :: x/2.5x peak valuation and ends in the initial 24 Nov 2026 crash nadir. Because this represents a 33 year second fractal nonlinearity (and the amount of margin, leverage, overvaluation, et.al.) the devaluation will be substantial.
6 Oct 2026 Postscript:
Do global composite equity market valuation patterns predict crashes and incipient recessions better than traditional economic indicators?
Was 6 October 2026 the final SPX peak valuation for the Asset-Debt Macroeconomic System 1982 13/33 year :: x/2.5x 1st and 2nd Fractal Cycle?
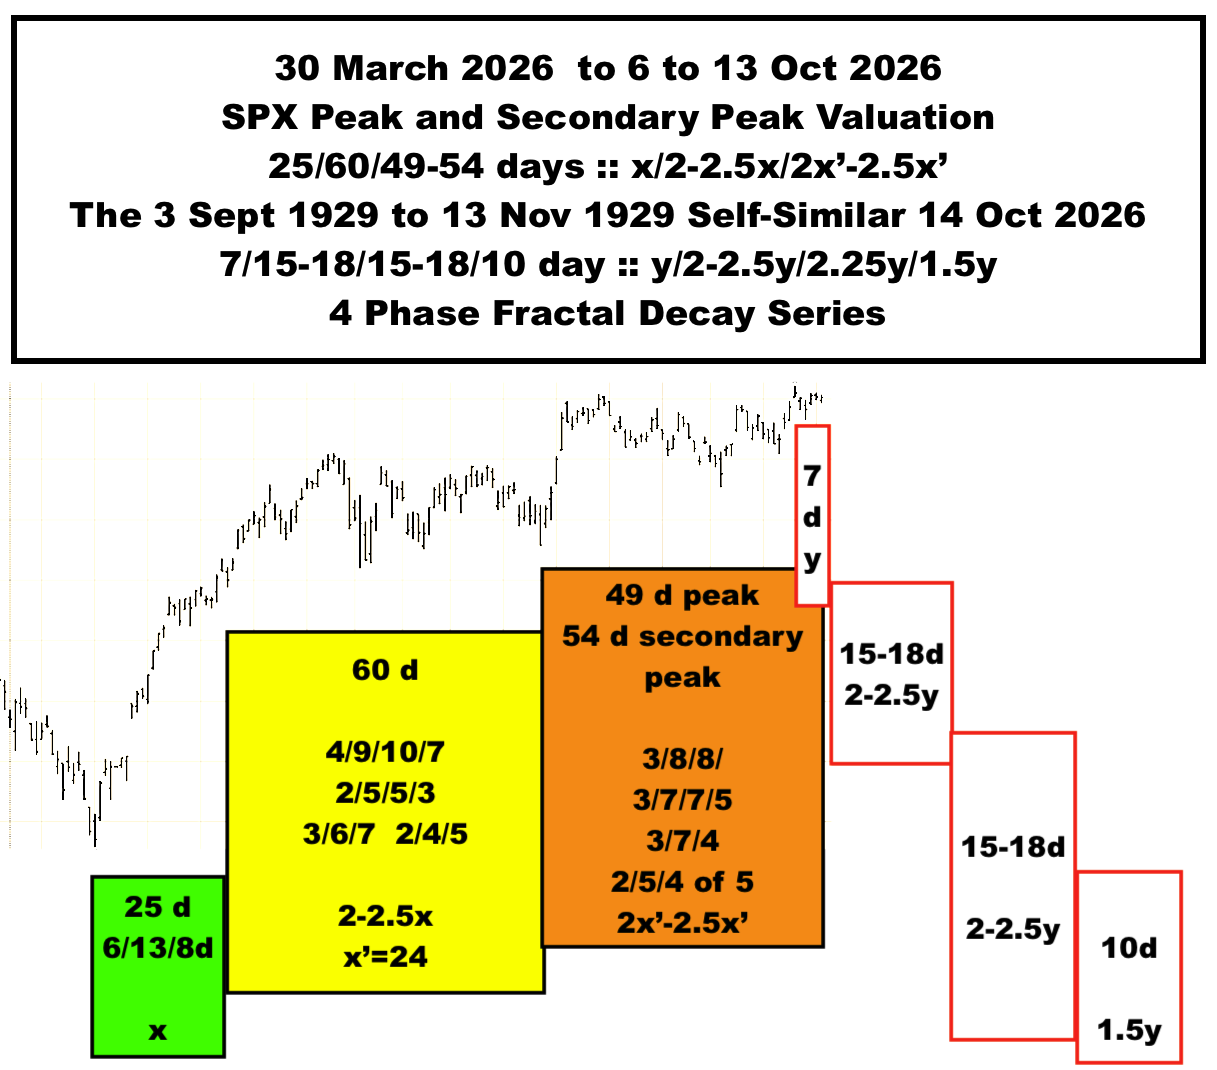
From the 30 March 2026 low: 25/60/49 of 49-50 days :: x/2.5x/2x-2x’ 3-phase growth fractal self-assembles to the 6 Oct 2026 all-time peak valuation. The 49 day 3rd fractal of this 3-phase fractal growth series starts on 29 July 2026.
An interpolated 29 July 2026 17/33 of 35/34 day :: xy/2-2.5xy/2-2.5xy terminal peak valuation growth and initial crash decay 3-phase fractal series with a peak valuation on day 33 (6 Oct 2026 ) of the 35 day 2nd fractal and an initial crash nadir on 24 Nov 2026, day 34 of the 3rd fractal decay is fractally self-similar to the 1929 12/29/27 day :: xy/2-2.5xy/2-2.5xy 3-phase peak valuation and decay fractal series with a peak on day 4, 3 Sept of the 29 day 2nd fractal and a crash nadir on 13 Nov 1929, day 27 of the 3rd fractal.
Like the terminal 29 days 3rd fractal in 1929 ending on 13 Nov 1929 (and near the end of a 1807 36/90 year :: x/2.5x ending in 1932), there should be a very obvious nonlinear lower low gap in the terminal portion of the 34 day 3rd fractal ending on 24 November 2026.
A 30 March 2026 25/60/49/36 day :: x/2.5x’/2-2.5x’/1.5x’ 4-phase fractal series would end on 24 Nov 2026 and fit the description of the 4-phase fractal series described over 20 years ago in the 2005 main web page of ‘The Economic Fractalist’:
“The ideal growth fractal time sequence is X, 2.5X, 2X and 1.5-1.6X. The first two cycles include a saturation transitional point and decay process in the terminal portion of the cycles. A sudden nonlinear drop in the last 0.5x time period of the 2.5X is the hallmark of a second cycle and characterizes this most recognizable cycle. After the nonlinear gap drop, the third cycle begins. This means that the second cycle can last anywhere in length from 2x to 2.5x. The third cycle 2X is primarily a growth cycle with a lower saturation point and decay process followed by a higher saturation point. The last 1.5-1.6X cycle is primarily a decay cycle interrupted with a mid area growth period. Near ideal fractal cycles can be seen in the trading valuations of many commodities and individual stocks. Most of the cycles are caricatures of the ideal and conform to Gompertz mathematical type saturation and decay curves.
G. Lammert
This page was last updated on 15-May-2005 01:21:59 PM .”
This terminal peak valuation growth and initial crash decay model 4-phase fractal model appears to be correct.
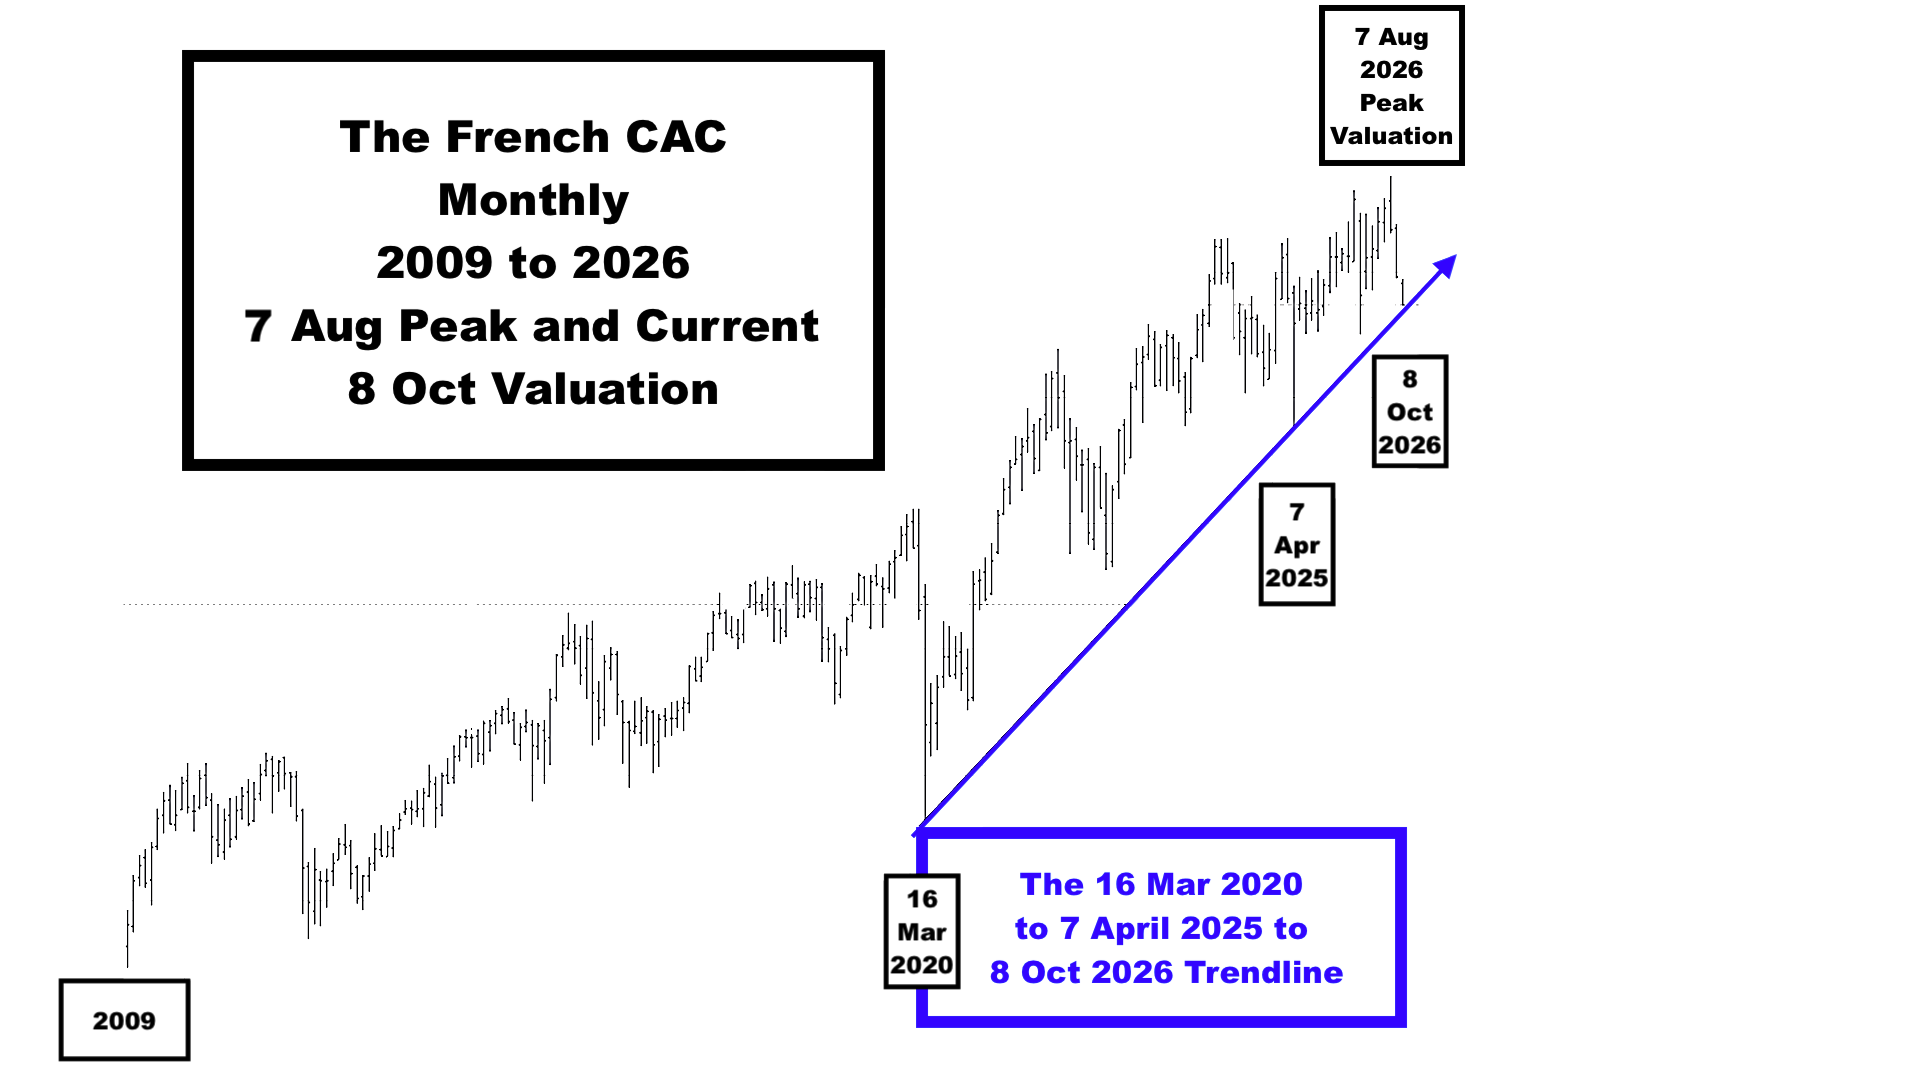
8 Oct 2026 Update: The French CAC:
The globally underperforming French CAC has lost over 10% from its 7 August 2026 all-high and today (8 Oct) touched on (and broke thru) its 16 March 2020 to 7 April 2025 trendline.
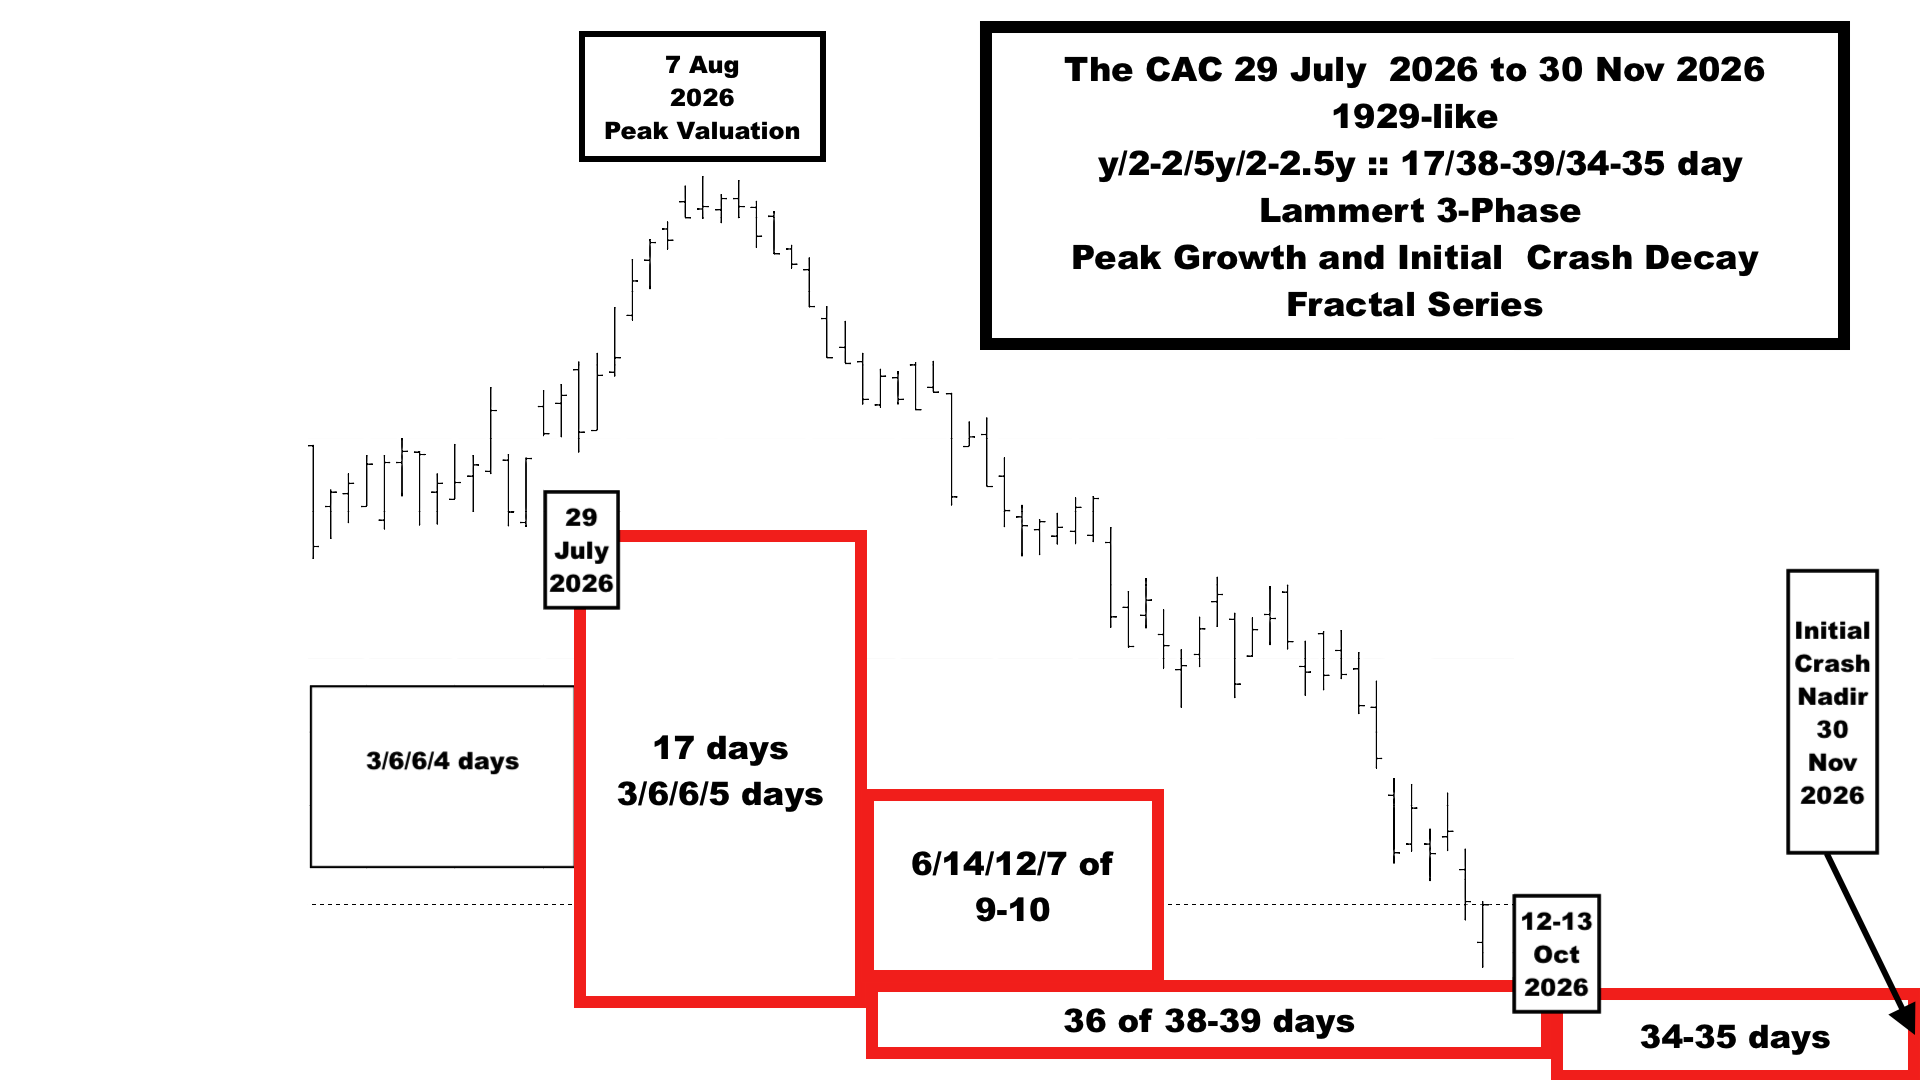
The CAC will break that 6 and 1/2 year trendline during the next 2 to 3 days: 9, 12 to 13 Oct 2026 completing a 38-39 day 6/14/12/7 of 9 -10 day y/2-2.5y/2y/1.5-1.6y 4-phase fractal series, the 2nd fractal of a 29 July 2026 17/38-39/34-35 day series : y/2-2.5y/2-2.5y 3-phase crash decay series with a global equity initial crash low on about 30 November 2026(vice 24 Nov) akin to the initial 13 Nov 1929 crash nadir. (The SPX’s 2nd decay fractal (with its 17 July 17 day 1st fractal) will also end Monday or Tuesday 12-13 Oct.)
Updated: 13 Oct 2026 (SPX trading closed)
The French CAC appears to be following a 20 Aug 2026 40 day second fractal of 6/14/13/9 of 10 days : y/2-2.5y/2-2.5y/1.6y ending 14 Oct 2026.
Tomorrow, 14 Oct 2026 is the 7th day of a 6 Oct to 14 Oct 2026 SPX peak valuation to an initial 7 day 1st Fractal nadir.
The 1929 SPX/DJIA peak valuation to initial crash nadir occurred from 3 Sept to 13 Nov 1929 and followed a 7/18/18/10 day :: y/2.5y/2.5y/1.5y 4-phase peak valuation to initial crash nadir fractal decay series. (In 1929, stocks traded 6 days a week , ie, on Saturdays)
The 2026 SPX current model is a 6 Oct peak valuation to initial crash decay nadir 7/15-18/14-18/10 day 4 -phase fractal decay series. This is a peak valuation to initial crash decay fractal replica of the 3 Sept to 13 Nov 1929 4-phase fractal crash decay series. The 2026 crash nadir is predicted between 3 December and 15 December 2026.
14 Oct 2026 Update: New 20 Aug to 15-16 Oct 2026 40-41day 2nd Fractal Model with 3 fractal subseries composing the 40-41 day 2nd Fractal
This model has a 40-41 day 2nd Fractal in yellow composed of 3 subfractals of 19/12 and 11-12 days sequentially. A 3rd Fractal of 34-42 days would take the SPX to its initial crash low. completing a 3-phase 17/40-41/34-42 day :: xy/2-2.5xy/2-2.5xy peak valuation growth to initial valuation crash nadir Lammert fractal series.