Does the US and global asset-debt macro-economy deterministically self order, self-assemble its asset valuations in precise growth patterns to governmental-and-private-debt dependent asset peak valuations and thereafter collapse in a highly predictable manner following two elegantly simple, time-based fractal patterns?
The world is coming to a 19 Oct 1987-like nonlinear crash event. By the current Lammert fractal model, that nonlinear gapped lower low valuation crash will come on 3 Nov 2026, election day, held to a 20% loss for the day by trading halts. The 3 November 2026 SPX nonlinear gapped lower low valuation will represent the most characterizing portion of a terminal 2nd fractal occurrence at the extreme end of a 33 year 2nd Fractal of a 13/33 year : : x/2.5x 1st and 2nd Fractal Series starting in 1982 and peaking 6 October 2026. A nonlinear 2nd Fractal Crash could have occurred anywhere in the 2x to 2.5x :: 26-33 year terminal portion of the 33 year 2nd fractal. With unprecedented peacetime US governmental deficit to GDP annual spending of 5.8-14.9% from 2020 to 2026 and with recent massive private debt expansion for AI/chips/data-centers, the SPX peak on 6 October 2026 occurred near the maximum 26-33 year :: 2x-2.5x fractal growth time duration. Unlike 19 Oct 1987, which occurred in a long robust growth and credit expansion period, 3 Nov 2026 will occur under the umbrella of an ongoing enormous private bad-debt-dependent collapse.
64% of global currency debt is denominated in US dollars. Gold, bitcoin, US, and world equities will undergo an initial nonlinear valuation collapse on 3 Nov 2026, followed by further liquidation of assets in a market response to repay private dollar-denominated debt.
Silver, was down about 6% today on Friday 30 Oct and 72 dollars from its 121 USD peak in late Jan 2026. That 58-59% loss provides qualitative bell weather guidance to the ongoing direction of asset valuations – with the notable exception of US sovereign debt whose purchase at 5.3-5.7% in early October (near the SPX 6 Oct 2026 peak) will be realized as a most prudent investment.
1929
The SPX initial 4-phase crash decay fractal series from the 3 Sept 1929 peak was a 7/18/18/10 day :: y/2.5y/2.5y/1.5y Lammert 4-phase crash fractal decay series ending with a nadir on 13 Nov 1929. (Stocks traded on Saturdays in 1929).
3 Nov 2026: A Replay of 19 Oct 1987 ‘Current Lammert Fractal Model‘
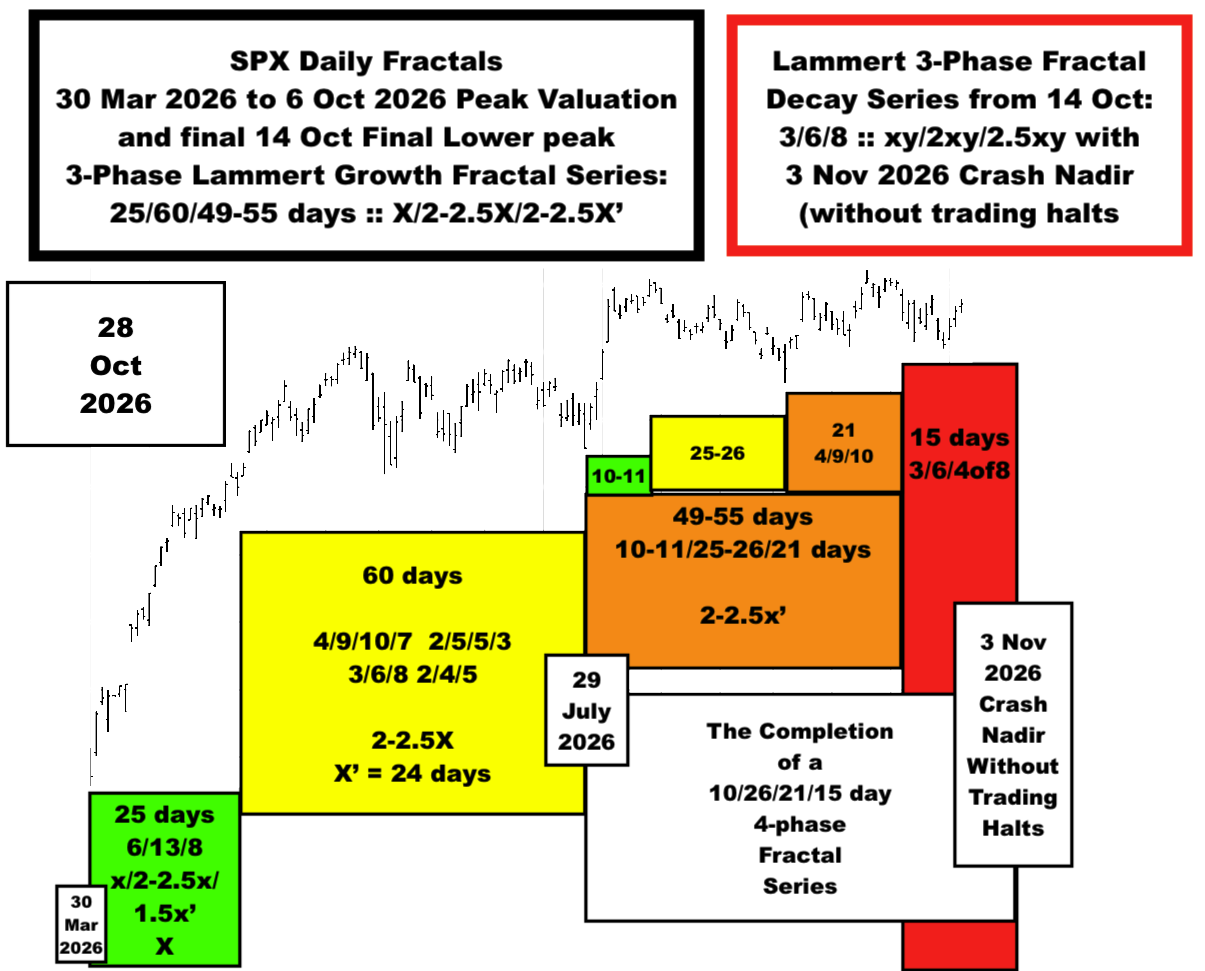
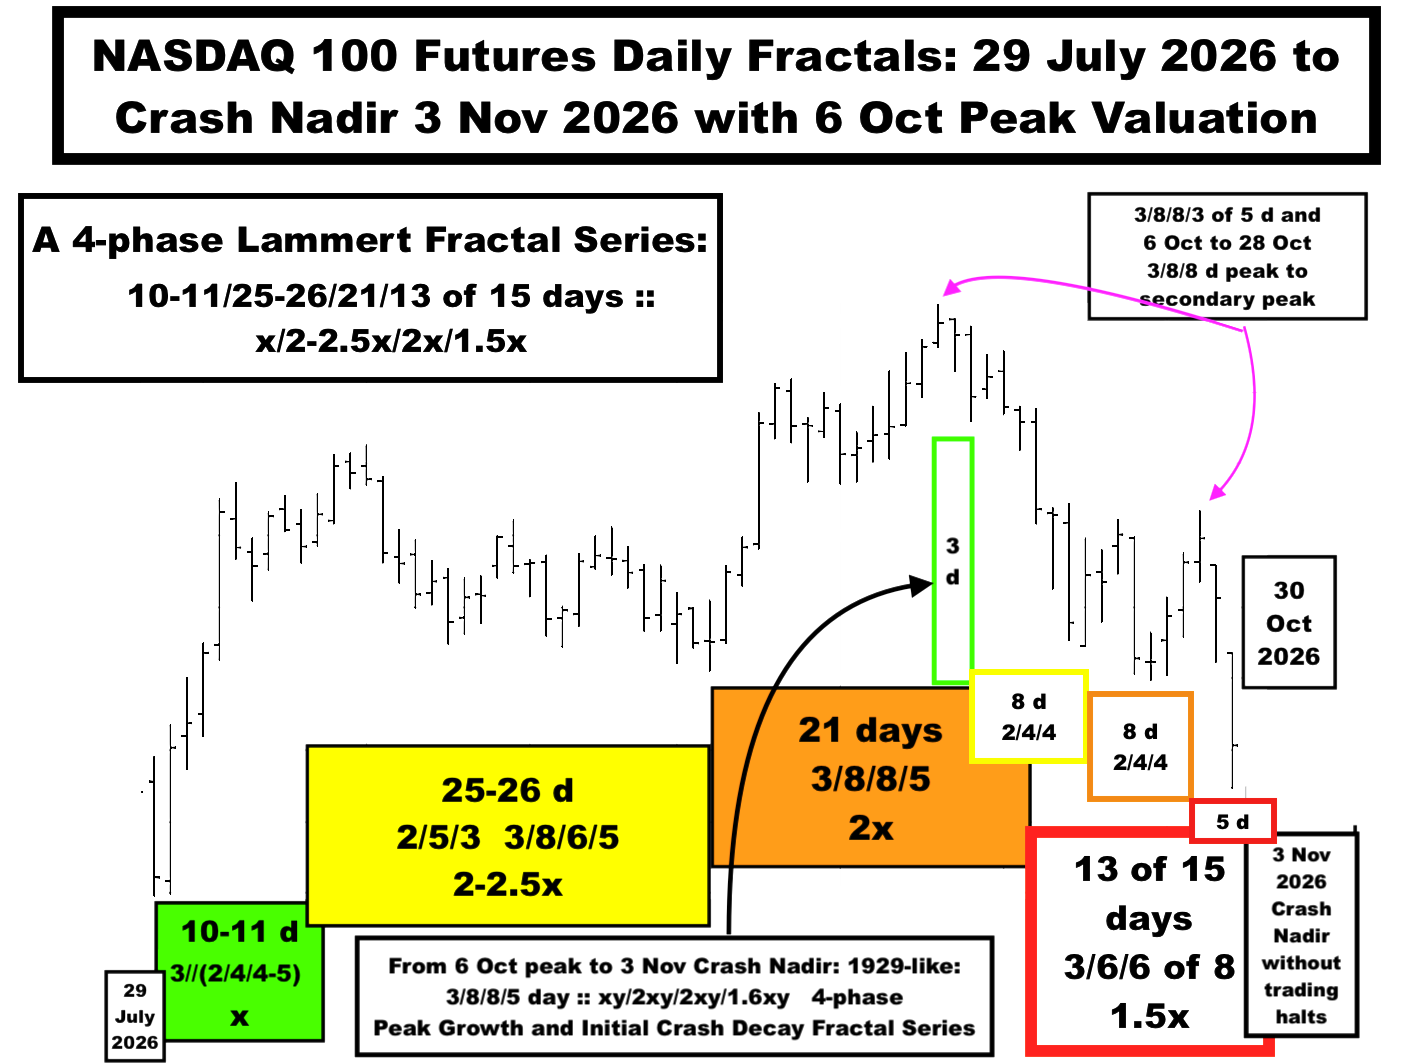
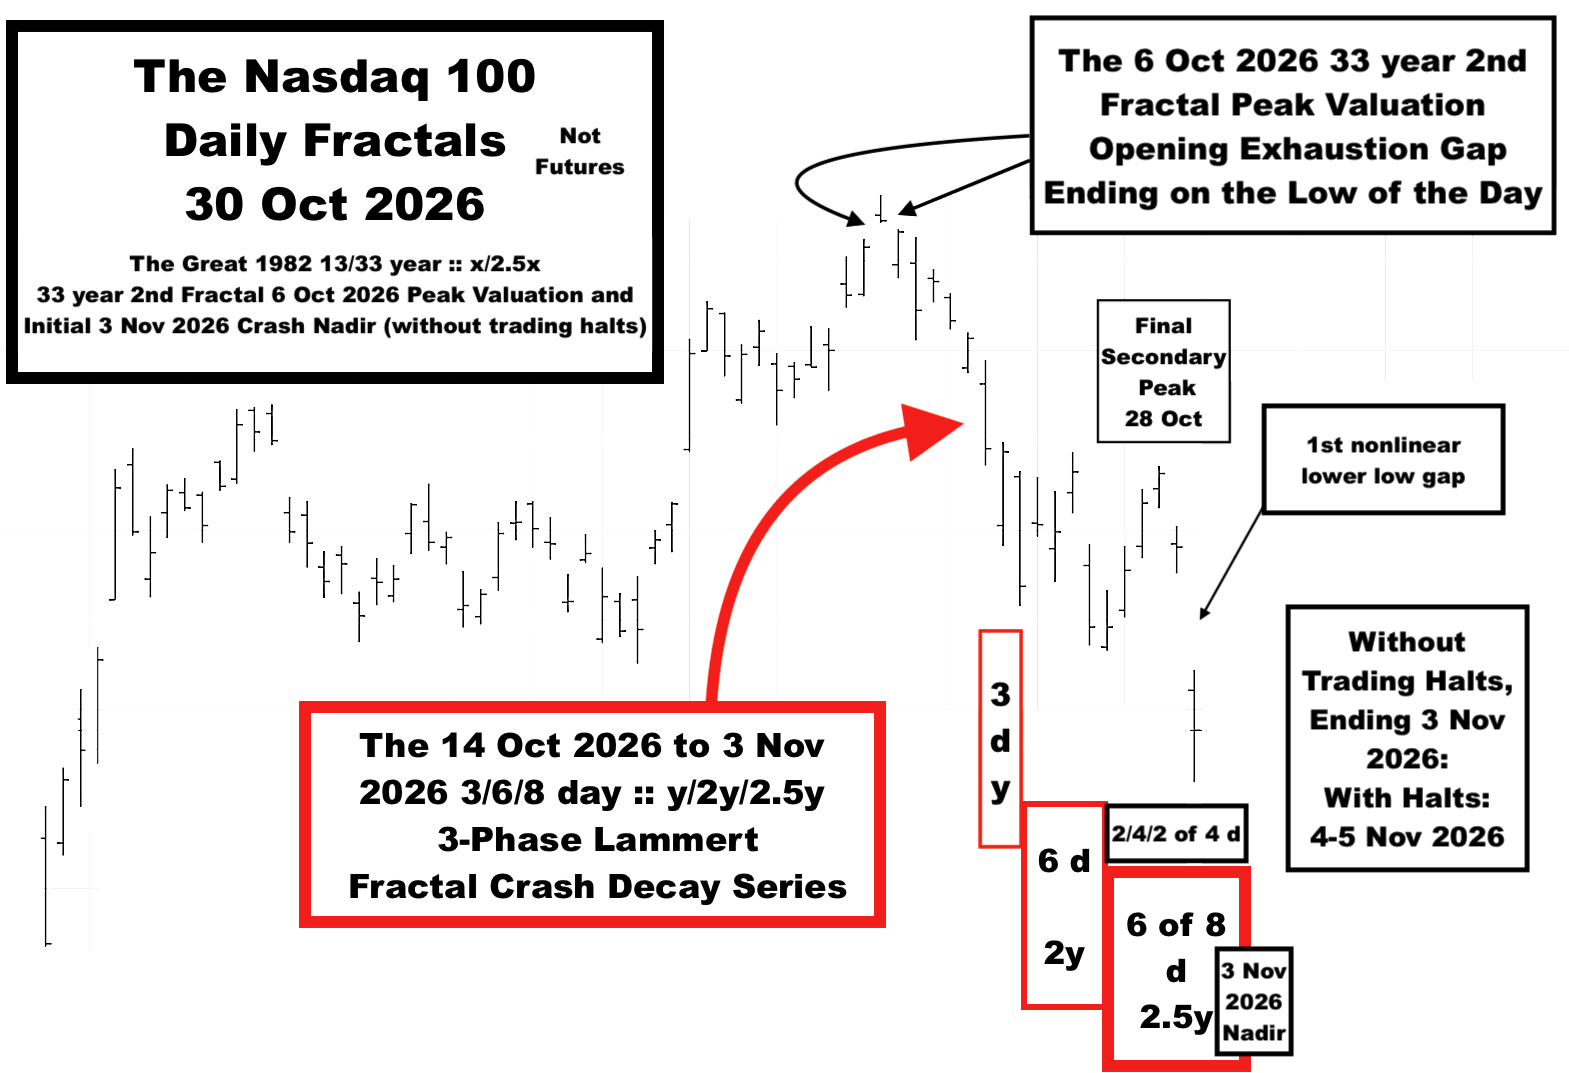
The SPX terminal fractal growth from the 30 March 2026 low was a 25/60/49 day :: x/2-2.5x/2-2.5x’ series with a peak valuation on 6 October. The Nasdaq containing over-invested over-valued AI-related stocks showed an opening gapped blow-off on 6 Oct 2026, higher than all previous 33 year valuations and ending on the low of the day, technically very characteristic of a conclusive peak valuation. The SPX final lower lower high occurred on 14 October extending the 30 Mar 2026 terminal 3-phase fractal growth series to 25/60/54 days :: x/2-2.5x/2-2.5x followed by a curvilinear 3/6/4-5 day :: x/2x/1.5x fractal series reaching a final lower lower high on 28-29 Oct 2026 day 4-5 of the 3/6/5 day series. A nonlinear lower low gap occurred between 29 October’s close and 30 October’s opening demarcating terminal lower high valuation from an imminent crash decay.
A 14 October 2026 3-phase 3/6/8 day :: xy/2xy/2.5xy :: 3 day decay/ 6 day slower decay/ terminal 4-5 day lower lower high growth, and a terminal day 6, 7,and 8 crash decay series would result in a crash nadir on 3 November 2026. If US equity trading is halted at 20%; the final nadir will be on 4 or 5 November 2026, but the 7 1/2 hours per the 3 November trading day distributed over those 2-3 halted trading days would likely be conserved.
SPX 33 Year 2nd Fractal Lower Low Gapped Nonlinearity on Monthly Charts
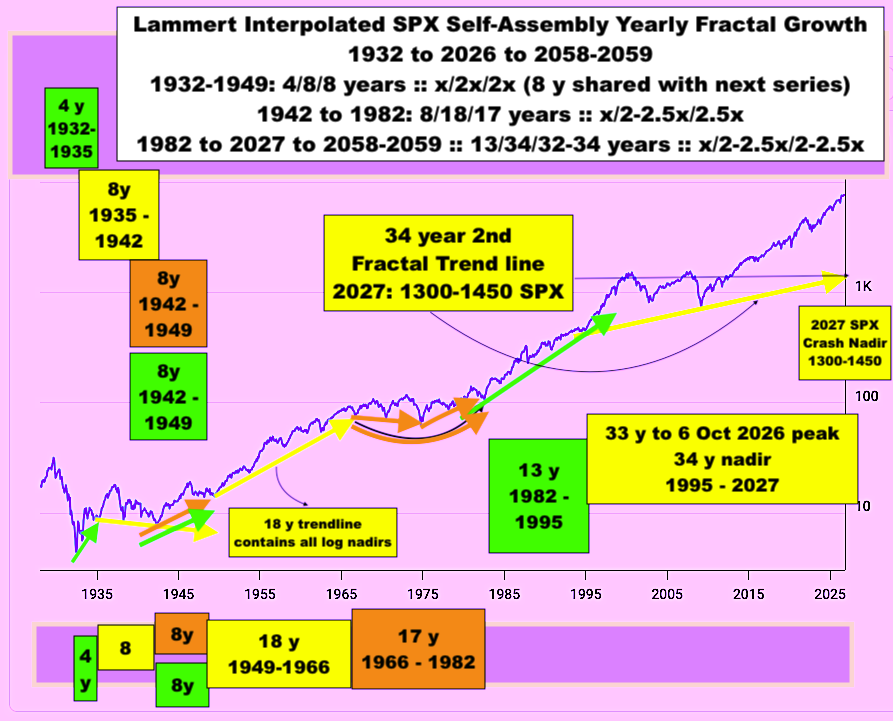
The 33 year SPX 2nd fractal nonlinearity of the 1982 13/33 year :: x/2.5x 1st and 2nd fractal series with a 2nd fractal characteristic gapped lower low on 3 November 2026 will likely be apparent, retrospectively, on SPX monthly charts.
1929 and 2026 Peak to Nadir Valuations.
The SPX 3 Sept 1929 peak to the 8 July 1932 nadir valuation terminated an 1807 36/90 year :: x/2.5x 1st and 2nd fractal series and occurred over about 33 months. The SPX 6 Oct 2026 peak valuation to its final nadir valuation concluding a 1982 13/33-34 year :: x/2.5x 1st and 2nd Fractal series will occur over a much shorter tome frame.
The Big Picture
The US is operating under a 1807 36/90/90/54-57 year :: x/2.5x/2.5x/1.5-1.6x 4-phase Lammert fractal series with the 1982 13/33-34 year :: x/2.5x fractal series representing an interpolated fractal series within the larger 1807 fractal series. A 1807 36/90/90 year :: x/2.5x/2.5x interpolated 90 year 3rd Fractal peak occurred in Nov 2021. SPX valuation was propelled higher to reach a peak on 6 Oct 2026 by historically large US governmental deficit to GDP annual spending and recently enormous private debt credit expansion for AI/ chips/LLM/data centers.