The December2018 Expected SPX Weekly Nonlinear Collapse:
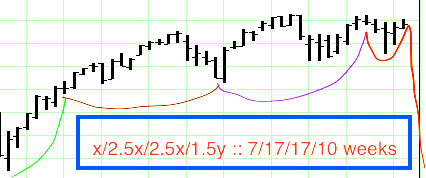
This December 2018 x/2.5x/2.5x/1.5y weekly fractal pattern of 7/17/17/(5 of)10 weeks mirrors the 1807 US Hegemonic 36/90/90/54 year pattern expected to end in about 2073.
The December 2018 daily fractal pattern is 32/79/avg 74-75/48 days :: x/2.5x/2.5x/1.5y.
With an initiating fractal series of 18 years, the US Hegemonic Great Fractal series started in 1807 and is composed of three decades-long sub fractals: 36/90-91/88 years :: x/2.5x/2.5x. The maximal debt dependent peak equity growth saturation valuation of the third 88 year year sub fractal occurred on 26 July 2019.
Coming is a breathtaking US hegemonic 88-89 year 3rd fractal collapse. The 2019 third fractal collapse with its more acute and shorter dv/dt negative valuation nonlinearity will pale the slower descent of the 32 month peak-to-nadir 1929-1932 :: 88-91 year US hegemonic 2nd fractal collapse.
Retrospectively, in the terminal portions of expected monthly decay fractal subunits both in 2003 after the dot.com debt and fraud expanded bubble and in 2009 after the greater housing debt and fraud expanded bubble, global central bank and sovereign interventions made measurable and observable differences in the natural fractal progression of expected composite equity valuation decay, bending negative devaluations to the positive side within the terminal two subunit series of the final fractal decline – but still self assembled in the deterministic self organized fractal valuation quantum subunit units that characterize the Asset Debt Macroeconomic System.
As well, the equities market is a zero sum game. Those taking profits at peak valuations will reenter the market at lower valuation areas which likewise accounts for the bending of the expected terminal sub fractal unit nadir lows.
For the SPX, representing the plurality global equity proxy, this subunit bending occurred in 2002-3 and again in 2008-2009 where the last two subunits of a y/2-2.5y/2-2.5y/1.5y naturally occurring 4 phase fractal decay progression, instead of occurring in a negative dv/dt rate, (v = valuation, t =time) occurred in a positive dv/dt trend or y/2-2.5y/2.5x/1.5 x while the self organization of the (monthly) fractal quantum fractal pattern remained intact.
Quantitative easing and cash for clunkers did jump start the system’s equities to a positive dv/dt , bending the last two subunits of the expected naturally occurring y/2-2.5y/2-2.5y/1.5y four phase fractal progression to a positive valuation or y/2-2.5y/2.5x/1.5x.
The base fractal sequence from the SPX 2002 low was 3/6/6/4 or 16 months. Central banks lowered interest rates and facilitated debt growth through lower interest rates, derivative manipulations, overinflated credit scores, and manipulated engineered financial instruments to allow initiation of positive SPX valuation growth in late 2002. Politicians urged the base population of the macroeconomic pyramid to shop and spend(acquire more debt).
The resultant three phase fractal series of x/2-2.5x/2-5xy in 2002 for the SPX was 16/33-34/33-39 months with the peak equity valuation of the final 2-2.5 x/y 39 month fractal occurring on 11 October 2007. The last 39 month fractal was 9/20/12 months with a low on the 33-34 month which mirrors the final 1982 9/20/12 projected yearly fractal low although central banks will attempt to intervene again, likely bending the monthly nadir low in 2020 from its ideal low . On the other hand, with European banks currently at negative interest rates and the potential fragmentation of the European Union, the ideal nadir point may be reached.
The final 12 year fractal starting on Sept 2 2009 ( vice in March 2009) is composed of an expected 26(21 ideal)/53/53 month :: x/2.5x/2.5xy complex fractal with a peak at x/2.5x/2x :: 21/53/42 months in July 2019. The 21 month base fractal ideal (vice 26 month actual) is based on a 53 month second fractal. Note that the 26 month base fractal starting in September 2009 is composed of a 2/5/4/3 month 4 phase growth and decay fractal series followed by a 3/7/8 month 3 phase :: x/2-2.5x/2-2.5xy fractal series.
The third sub fractal 42 month peak sex composite valuation occurred on 26 July 2019 and was composed of a 9/19/16 month fractal series (note that the ideal 2x third fractal peak for a 19 month second fractal with an ideal base of 8 months is 16 months.) The final lower secondary high on 19 September 2019 at 9/19/18 months.
There is an elegance in the simplicity of the fractal valuation progression of this macroeconomic asset debt system akin to the elegant simple math of non black hole macro and quantum-mechanic physics. The earthly asset debt macroeconomic saturation fractal mathematical termination of a x/2.5x/2x :: 21 ideal/53/42 month fractal growth sequence contained in the larger x/2.5x/2.5y :: 21/53/53 month decay sequence is … simply … the most efficiently elegant mathematical pathway to capture terminal growth in a slightly longer debt-liquidation dependent asset-overvaluation depreciation dependent decay sequence where the base economy of real citizens are caught in the terminal nonlinear decline of the saturated macroeconomic system.
The expected mathematical low for the SPX is June 2020.
The baseline fractal series from the November 2019 low is expected to be y/2-2.5y/2-2.5xy/1.5xy and likely 3/6/7-8/4 months. This would place the low in June 2019 with a terminal equities valuation rise for about 11 months before the next determinant base fractal series evolves.
If central banks and sovereigns are unsuccessful, the final low could at the final subunits’ nadir lows. Again the equities market is a zero sum game. Those taking profits near peak valuations will reenter the market which likewise accounts for the positive bending of the terminal nadir fractal nodal lows.
In 2019 will there be a 1987 type of nonlinear devaluation?
Could the December 2018 SPX x/2.5x/2.5x/1.5x :: 7/17/17/10 week fractal series devolution be a x/2.5x/2x/1.5x :: 7/17/14/10 week devolution?
As 1987 has shown, nonlinearity in market equity valuations at peak valuation saturation levels can be dramatically sudden.