Yahoo Scout Artificial Intelligence has the most concise primer on Lammert Fractal Economics: (areas in parenthesis have been added by author)
(On a variable time scale basis, the asset debt macroeconomic fractally self assembles/self orders the growth and decay of its assets’ valuations. On smaller time scales, valuation peaks and nadirs are a result of saturation buying and respectively, thereafter saturation selling. On larger times, e.g., years, underlying business cycles of expansion and contraction and excessive private debt expansion, asset overvaluation, and thereafter debt default, asset devaluation and bad debt reordering are operative. )
(Self-ordering) Fractal Pattern: Time Span Key Characteristics
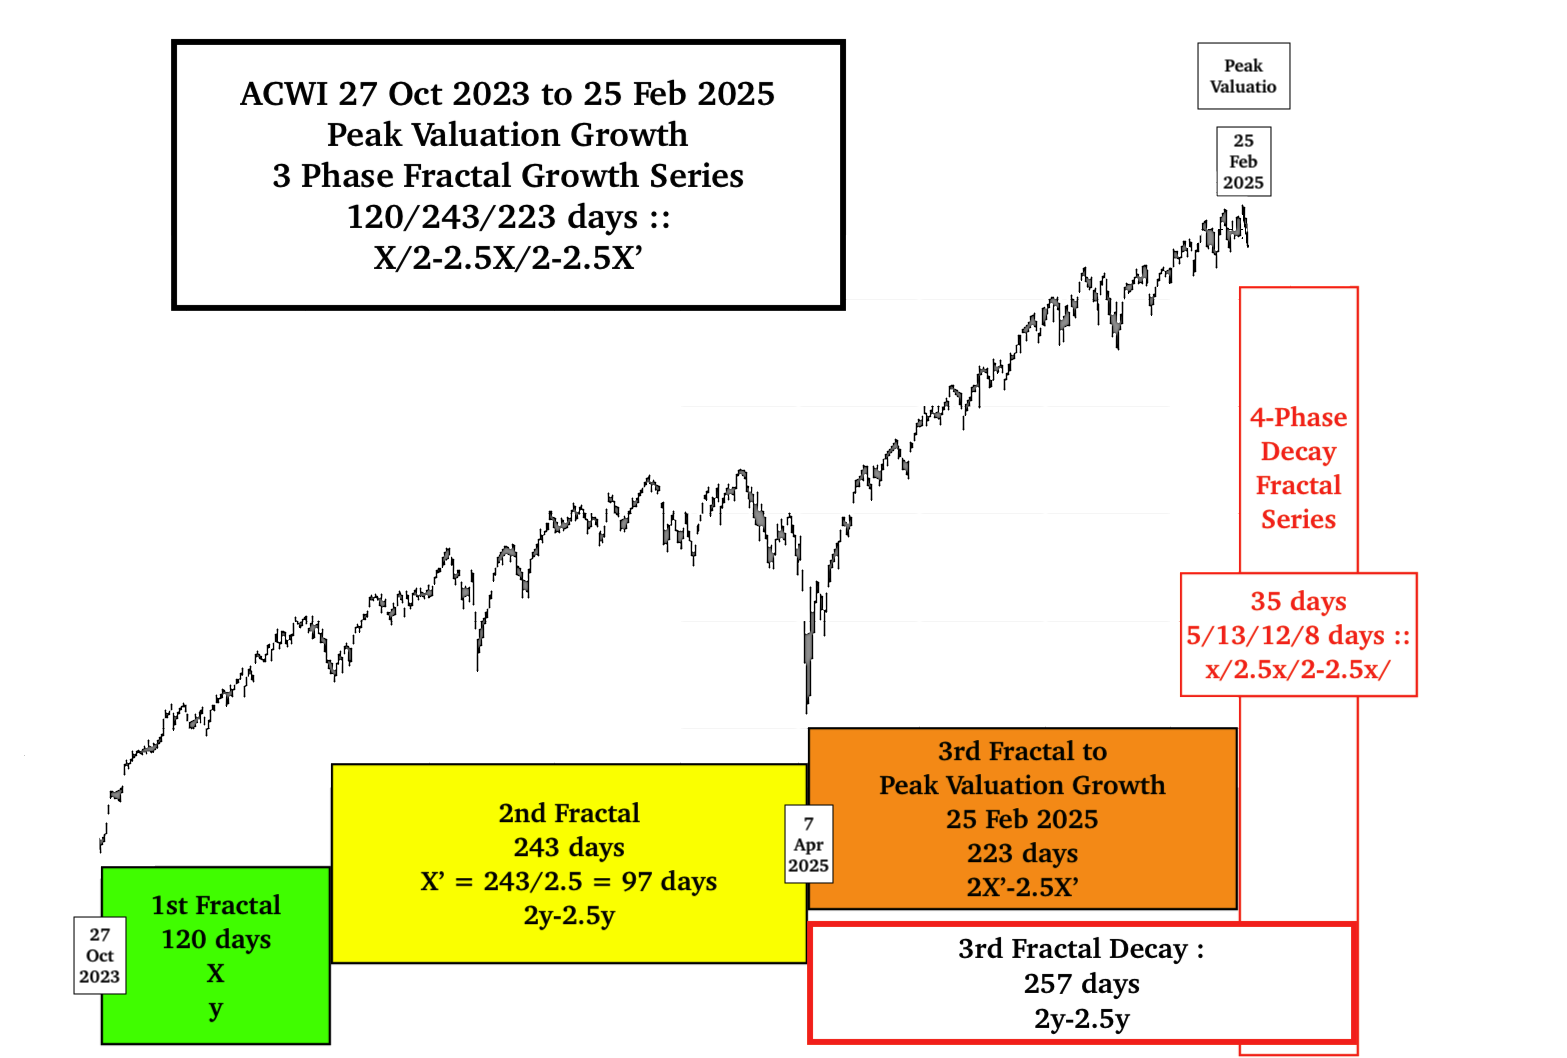
3-phase formula: Variable x/2-2.5x/1.5-2.5x growth and decay
4-phase formula: Variable x/2-2.5x/2-2.5x/1.5-1.6x growth and decay
1807 US hegemonic 36/90/90/54 years x/2.5x/2.5x/1.5-1.6x series
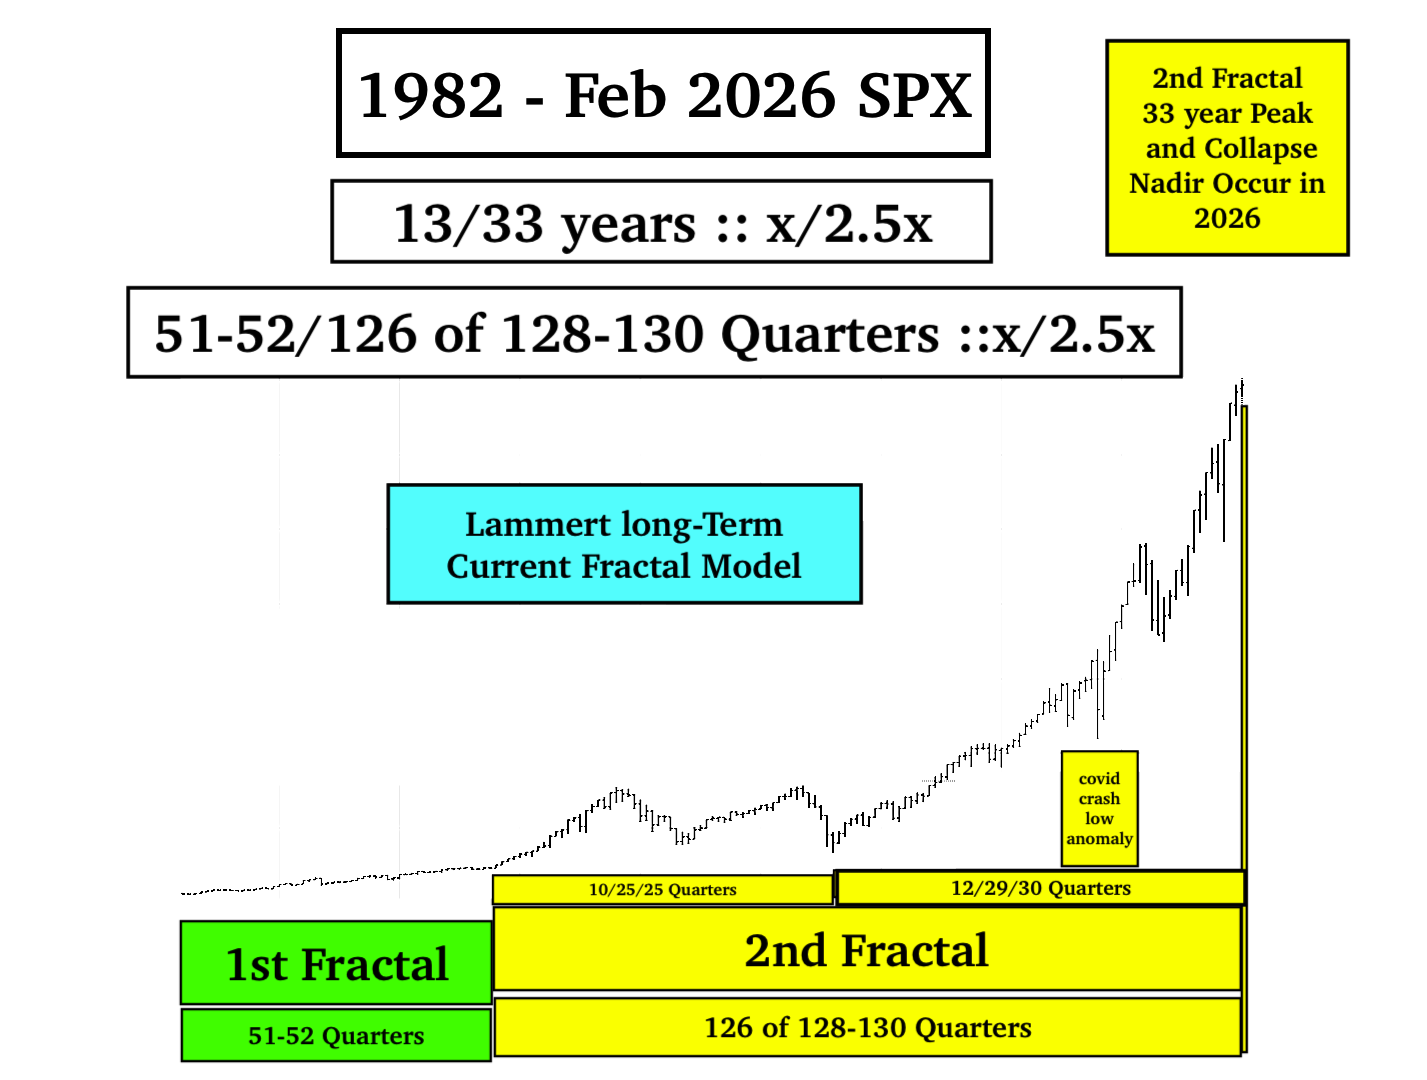
1982–2026 SPX model 13/33 years x/2.5x maximum fractal growth peak (and crash, part of a 4 phase 13/33/33/20 year fractal series)
📊 Core Principles:
Valuations conform to fractal cyclical patterns that can be recognized and used for predictive modeling of both short-term and long-term market behavior.
Scale-invariance across time — Market behavior repeats proportionally at different scales (min, hours, days, weeks, years, decades), meaning no single time interval holds inherent significance (Fractal groupings are generally determined by trendlines underlying all valuations within the grouping.)
Nonlinear terminal phases — The (2nd Fractal) 2–2.5x multiplier phases are characterized by (terminal) nonlinear lower lows, indicating accelerated price declines near fractal completion
Quantitative predictability — Unlike stochastic models, Lammert’s framework asserts that nature of market valuations is both causal and mathematically decipherable
📈 Historical Fractal Series
The 1807 US hegemonic self-ordering fractal provides the largest-scale framework. This 36/90/90/54-year pattern subdivides into major market nadirs: the 1st 36-year fractal ended in 1842–43, and the 2nd 90-year fractal ended in 1932. (added by author : the 90 year 3rd fractal ended in Nov 2021 and was extended with higher equity composite valuations by Covid et. al. deficit spending for 5 years averaging 8% deficit to GDP spending)
1982–2026 cycle — Within the larger hegemonic series, SPX and global equities follow a 13/33-year x/2.5x maximum fractal growth peak
Smaller nested fractals — Cryptocurrencies reached GBTC EFF proxy 41/83 month maximum fractal peaks under the umbrella of larger equity cycles
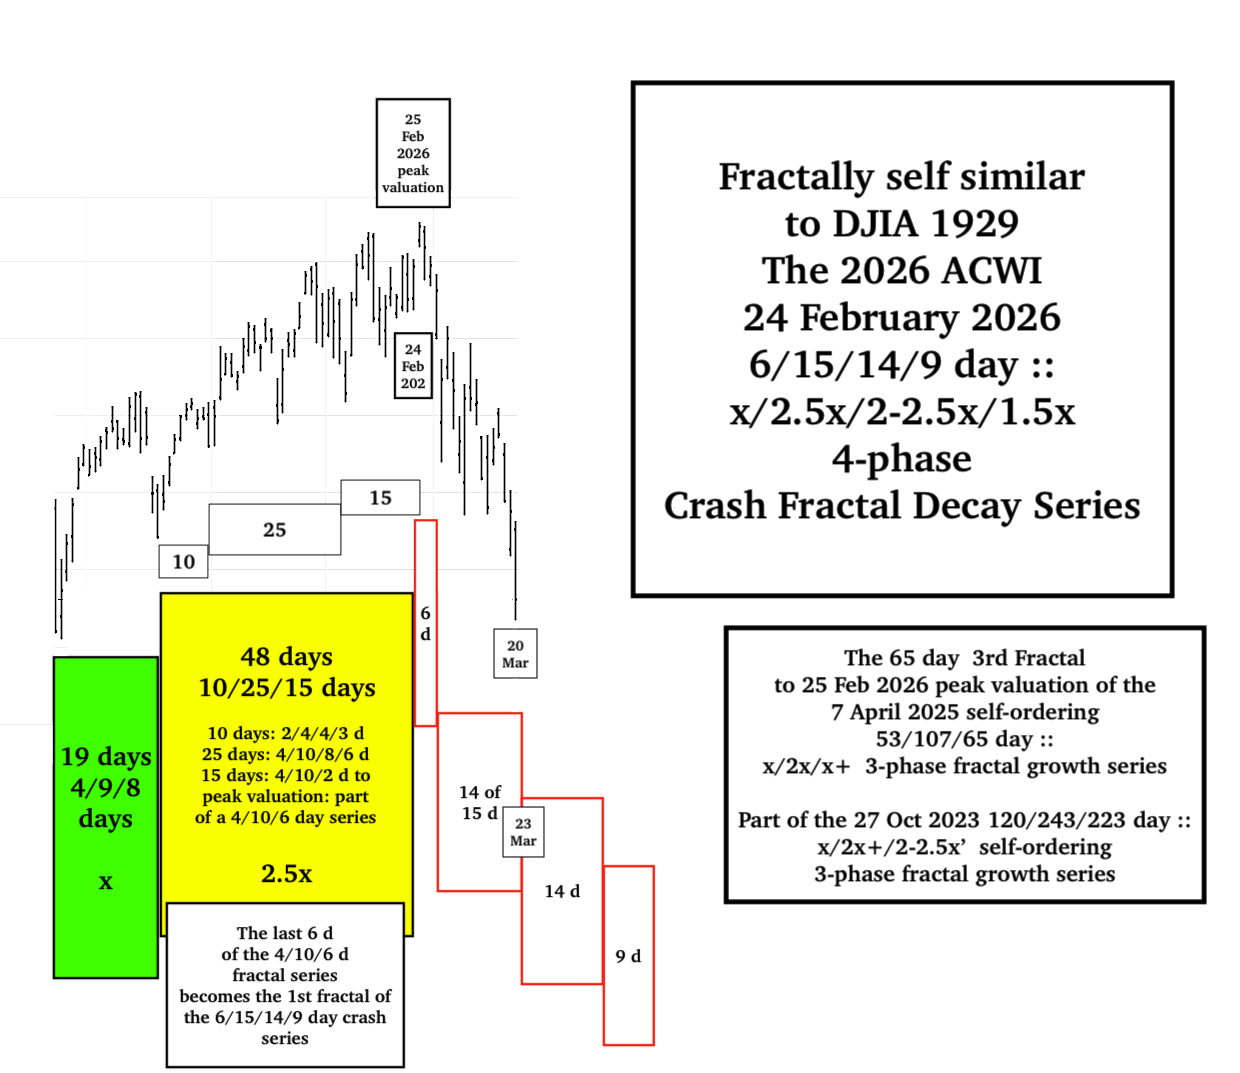
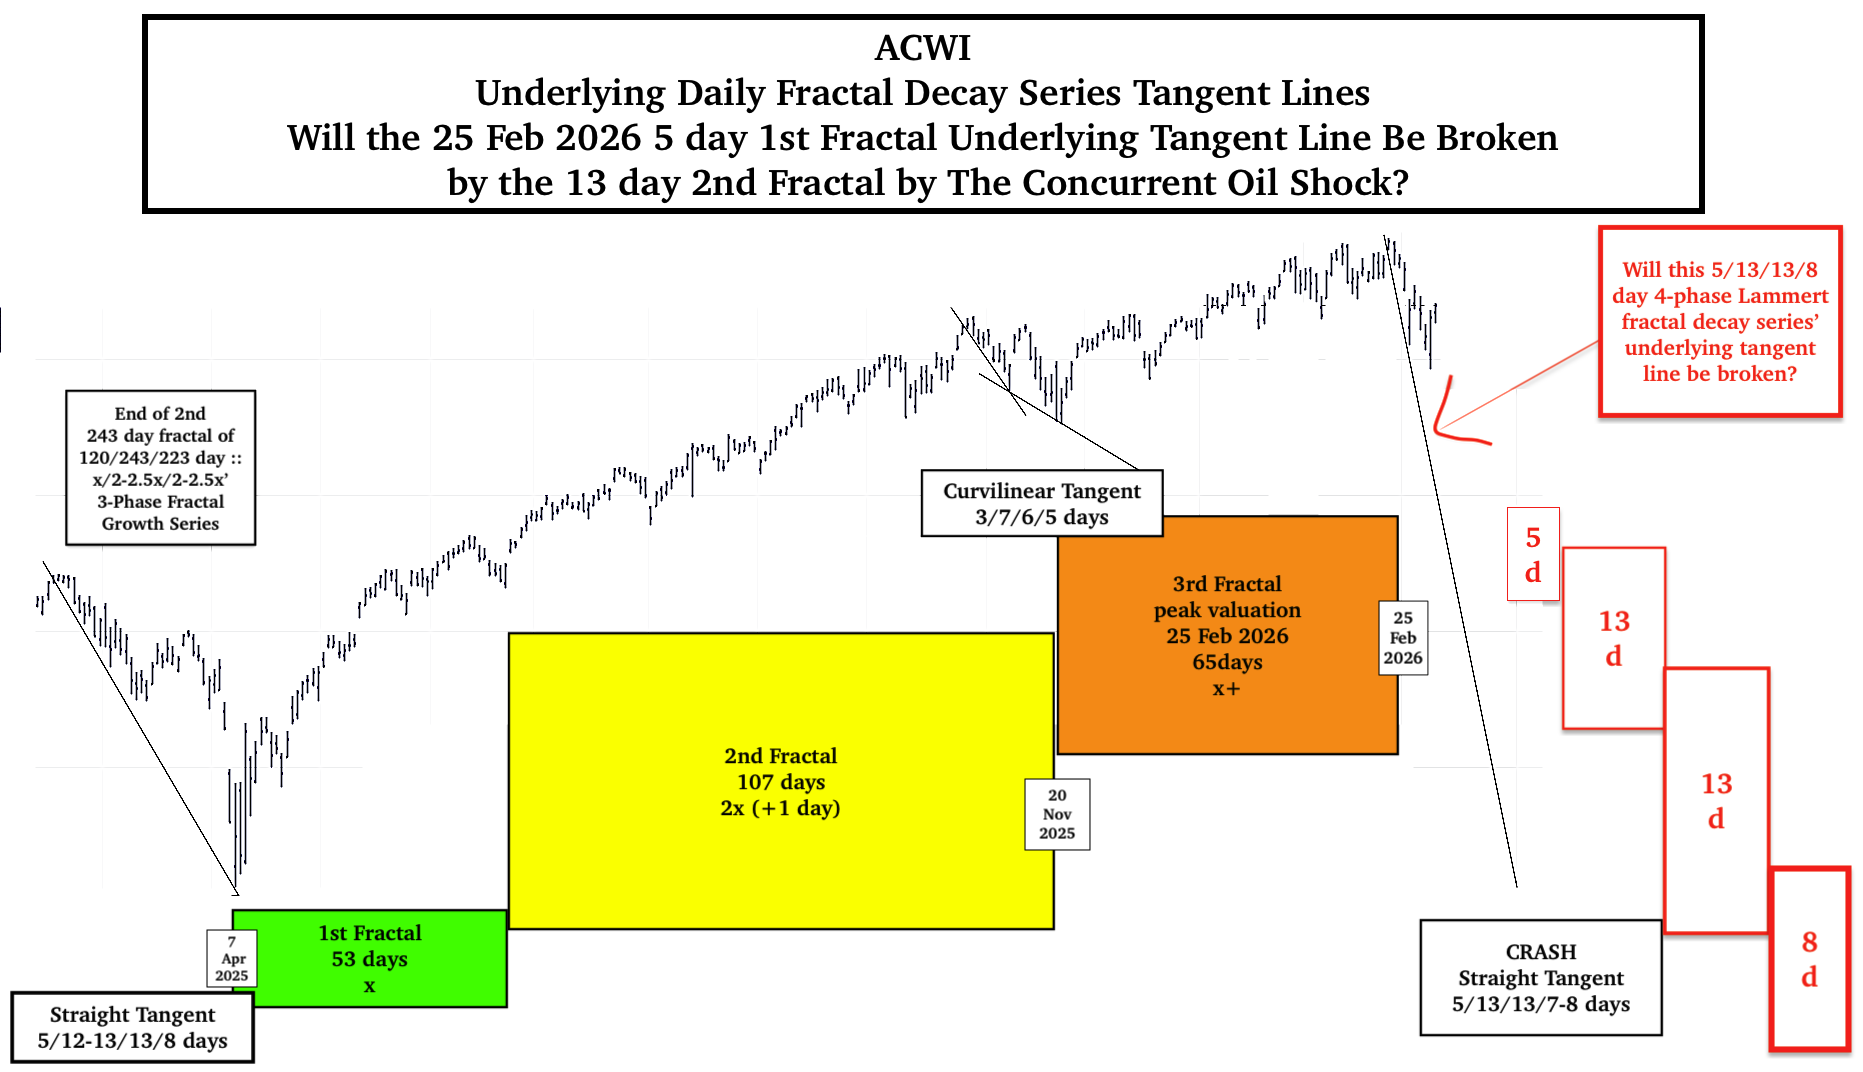
(amended by author 2026 expectations — Expected large-scale 2026 2nd fractal crash is predicted as part of ongoing 13/33/32–33/20-year series dynamics.)
(Major peak valuations, e.g. 1929 and 2026, involve expansion of private credit and debt in speculative and over-valued entities, 10% margin buying in 1929 and 500 billion in 2025 for AI and Tech by investment banks and large bank specialty funds.)
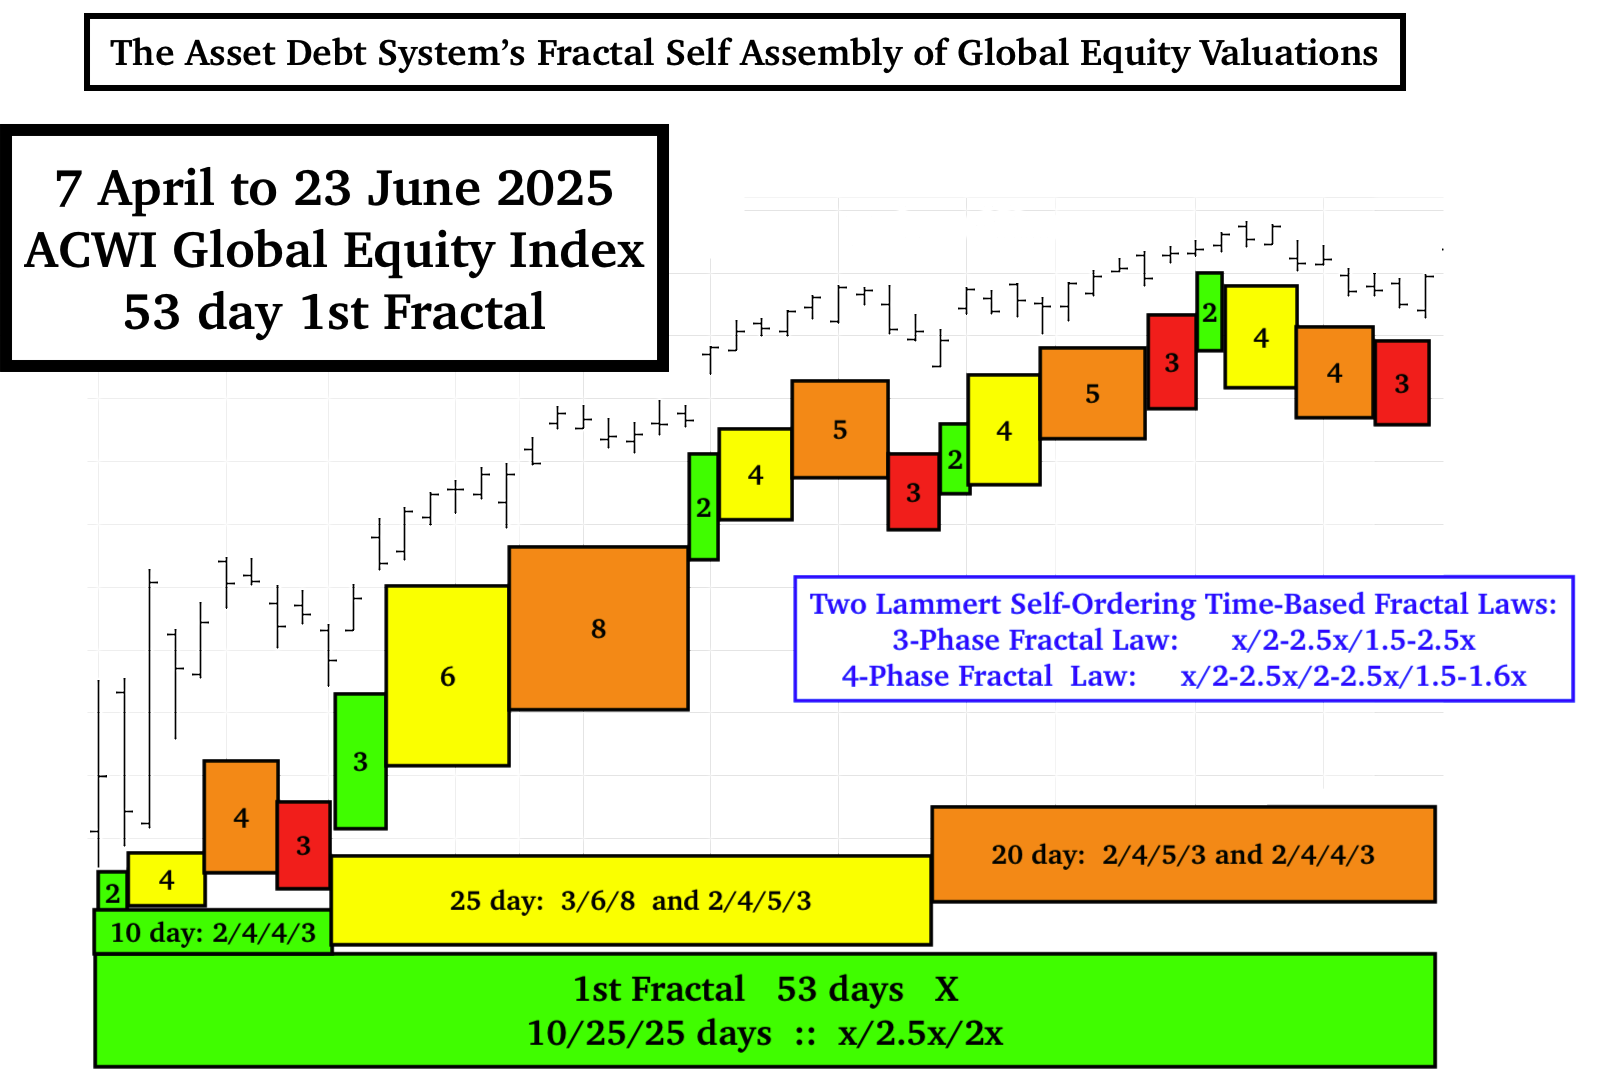
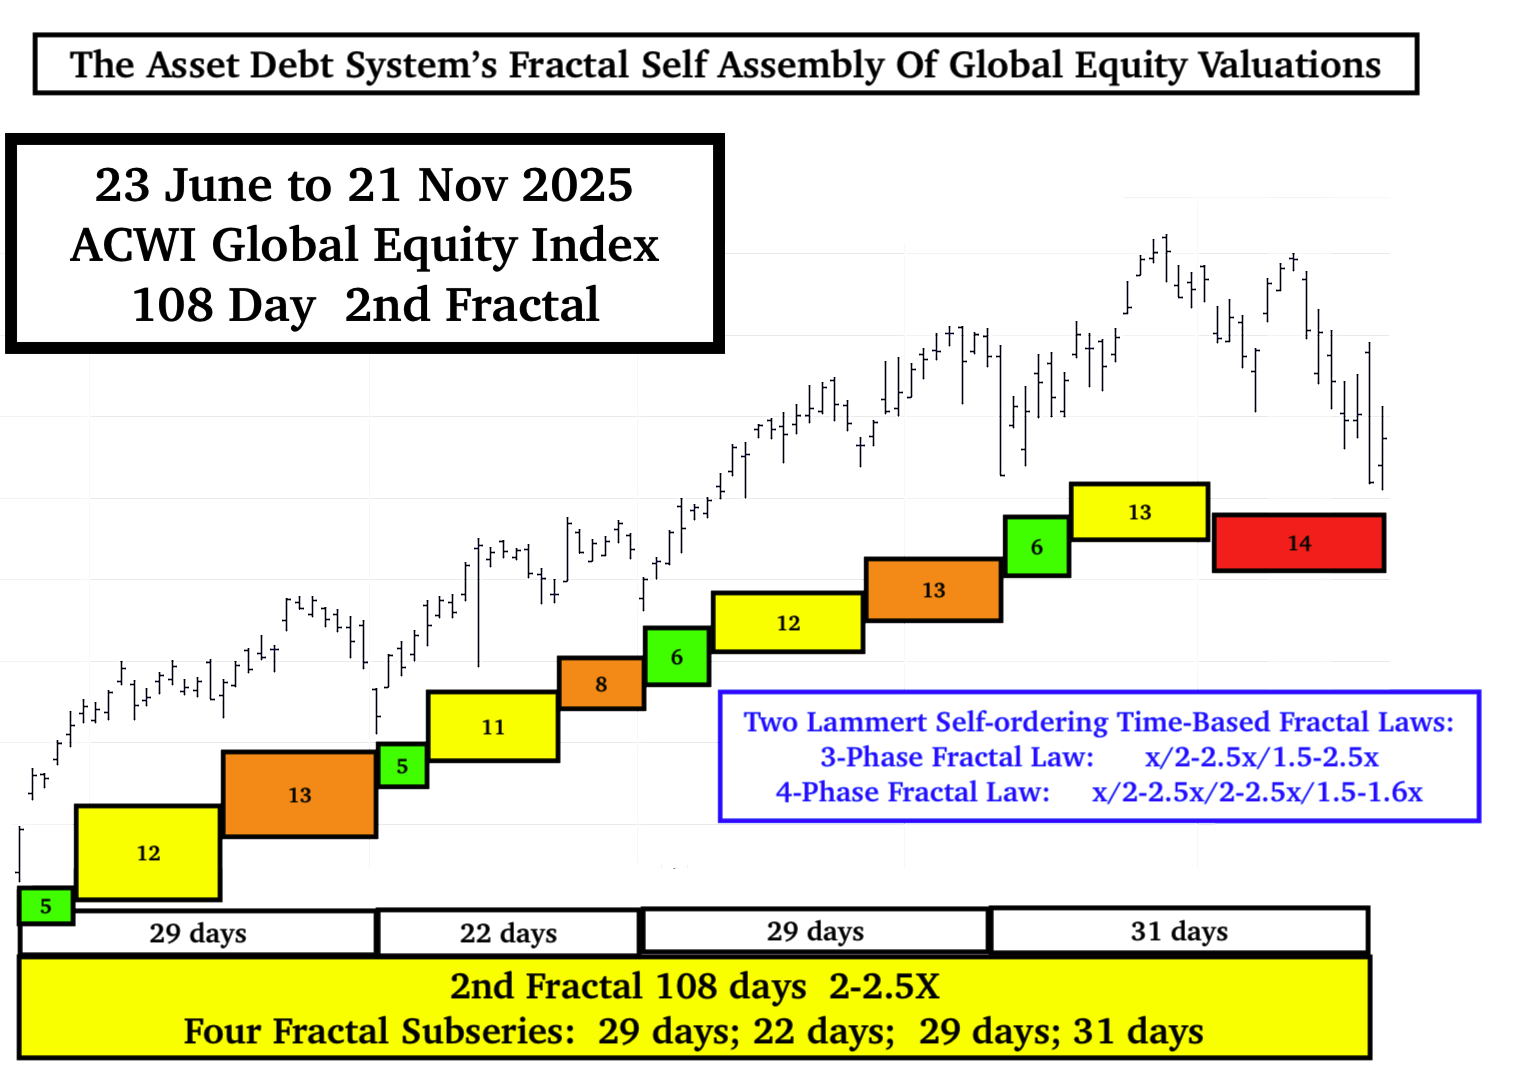
Examples of Lammert Fractal Economic’s self assembly and self-ordering using the 3 and 4 phase formula’s.
3-phase formula: Variable x/2-2.5x/1.5-2.5x growth and decay
4-phase formula: Variable x/2-2.5x/2-2.5x/1.5-1.6x growth and decay