The July 2023 Great Global Equity And Commodity Crash – US Debt Market Fractal Progression Since March 2020

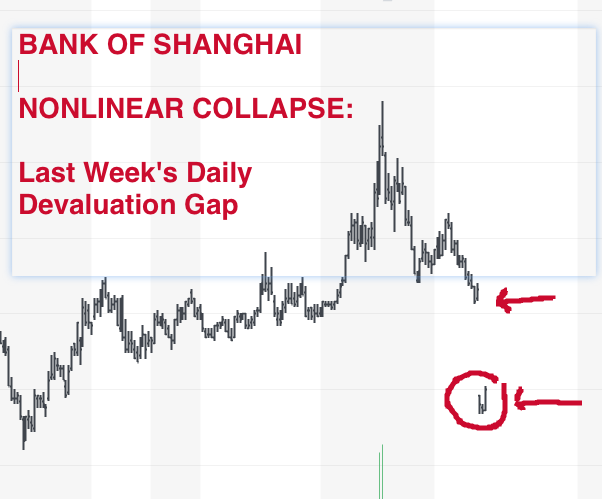
The Debt Market Side  of the Asset-Debt Macroeconomic System: Now 8 days to a Historical  1982 13/30 Year First and Second Fractal Equity and Commodity Asset Valuation  Nonlinear Low


The global central banks’ manipulable debt markets represent  both an accelerator and conversely  the boron rods of a potentially  exponential fissionable asset over production and price over valuation.Lowering and raising of interest rates represent boron rod withdrawal and insertion, respectively equating broadly to  QE and QT.. 


At persistently zero or  negative interest rates, there is no limit to asset over production and valuation. The result is hyperinflation and the resulting complete dissolution of  the socialcontract for  workers and pensioners, the stuff  that maintains the macroeconomic system’s equilibrium. At high borrowing rates, the boron rod effect collapses growth activity, resulting in decreased economic activityand unemployment. If extreme., these boron rods  can implode the system.  

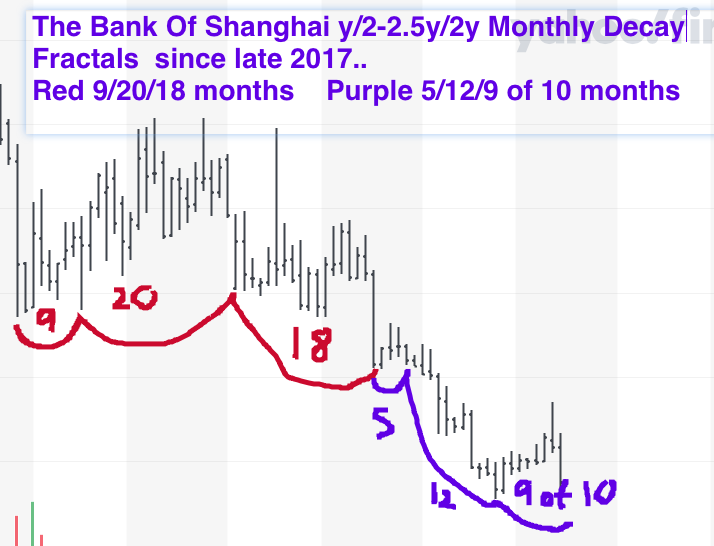
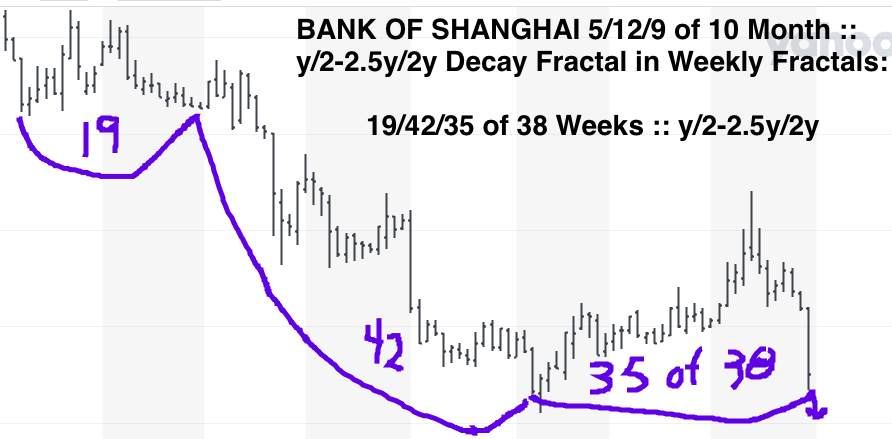
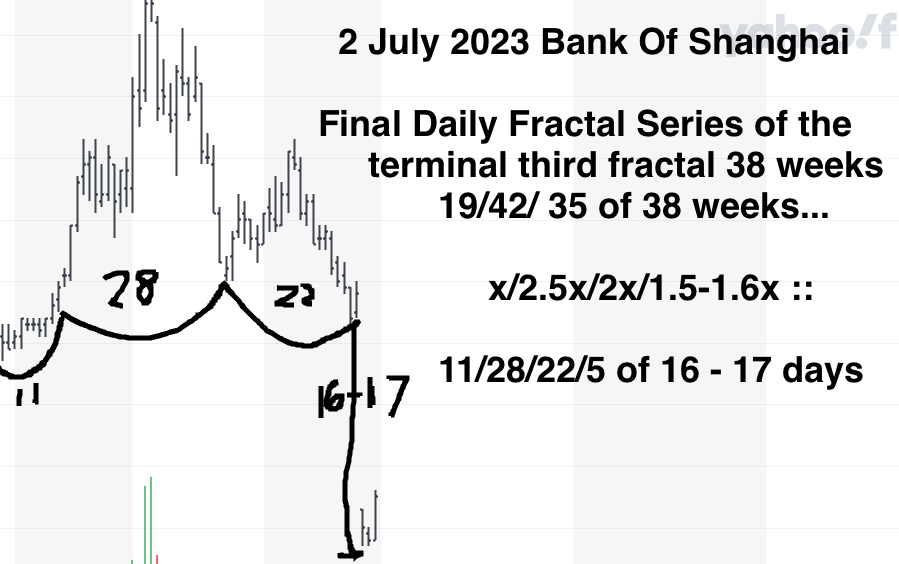
The March 2020 Ten Year Note weekly fractal sequence is 30/75/72 of 74 weeks. The 72 of 74 week third fractal is composed of a 4/10/10 week series followed by a 8/19/17/10 of 12 week series. The final 4th fractal 12 week series of the latter weekly series starts on 5/11/2023 and is composed of a 8/19/18/5 of 13 day sequence. The next 8 trading days could reasonably complete a 1981-82 13/30 year first and second fractal series, interpolated within the US hegemony 1807 36/90/90/54 year series with its 90 year third fractal (composite equity and crypto) asset valuation peak on 8 November 2021. Historical second fractal terminal 2x-2.5x area (26- 32 year) nonlinearity would result in both sudden and huge declines in equity and commodity valuation prices. 

Expect the unexpected. Over the next 8 trading days, money exiting commodities, equities, and crypto will flow into US debt instruments driving US debt interest rates much lower.

The Fed may  lower interest rates at the 25-26 July 2023 meeting simply to keep their policy in tune with US debt instrument actual market forces and a sudden drop in commodity and equity prices.

Sunday July 9 2023: The Great Global Asset-Debt Valuation Crash – 12 to 13 Trading Days to a Major Low

Global corporate, private, and governmental debt has never been this great percentage of global GDP.

With transient consumer inflation secondary to covid governmental QE stimulation, supply chain interruptions,  higher diesel and gas prices, avian flu poultry culling, Covid retiree surges,  7-8 % higher 2022 COLA’s to spend in the US service sector, and secondary transient labor shortages in the service sector to the 7-8% COLA increases,   QT measures and  interest hikes are smashing against recent European, Japanese, and US equity higher and lower high equity valuations.

Chinese equities and property valuations are at the cliff’s edge of precipitous falling, as Chinese workers over the last 5 months have received lower wages and defaulting  on mortgages, reinforcing lower property valuations and building sector corporate defaults. The previous 2014 Chinese real property valuation peak of 101 (relative to wages) was only exceeded in 2021 to 113 with current decreases to 105 in the 4th quarter of 2022. The last 6 months have been terrible have Chinese home owners.

Qualitatively. this is a global asset-debt system of highly leveraged debt-propelled over-produced, over-valued assets – a house of cards synergistically collapsing.

The Asset-Debt  Macroeconomic System integrates all of the system’s internal parameters – total debt, asset production numbers, asset ownership pool, asset valuations, ongoing interest rates, QE and QT programs, et. al. – and generates, in a self-assembly manner, the most efficient asset valuation growth and  decay progression, in a highly-ordered, elegantly-simple time-based patterned fractal manner. 

https://www.youtube.com/watch?v=s9YhX6rqDb4

For the Bank of Shanghai the final fractal series is a 28 March 2023 11/28/22-27/4 of 16-17 days.

The Hang Seng Index is the premiere proxy index of the Global asset-debt system. From the March 2020 low 33/72/70 of 73 weeks. It’s final 73 weeks is composed of a reflexive – x. maximal decay 2.5x, maximal growth 2.5x, decay 1.6x – :: 10/25/25/16 week fractal series.

(Updated 10 July 2023: The HSI final daily terminal sequence is an 11 April 2023 reflexive 10/25/25/4 of 16 day :: fractal series, identical to its terminal weekly fractal series.

The Bank of Shanghai: the Canary Asset in the Global Asset-Debt Macroeconomic Fractal System’s Coal Mine 

China corporate debt was  29 trillion in the first quarter 2023, nearly equaling total US federal debt. 

Chinese corporate debt  supplied by the CCP and its banking system has powered the greatest ever GDP/dt  expansion in the world’s history.  But, now it is over,  straining since late 2017.

China is collapsing, not unlike the US collapsed in 1929 as wages are being decreased, service sector and manufacturing unemployment is growing, Chinese real estate, the asset ownership of choice,  is undergoing devaluation, and mortgages are undergoing default in a systematic domino exponential collapse. The Chinese financial industry has had wage reductions of up to 40 percent over the 3-9 months.

The global asset-debt system is interlocking. The collapse of the Chinese banking and real estate interlinked systems will parallel an  interlocking nonlinear collapse in global asset commodity and stock prices. Last week’s nonlinear daily  gapped lower valuation of the Bank of Shanghai is the early telltale death canary in the global system’s asset-debt coal mine. 

Since late 2017, the Chinese banking system and near  peak real estate valuation have been undergoing quantitative  fractal decline leading to a precipitous nonlinear devaluation over the next 3 weeks. The monthly fractal declines  for the Bank of Shanghai are following a very classic repetitive y/2-2.5y/2y decay fractal series.

 From November 2017 a 9/20/18 months decay series is followed by a like 5/12/9 of 10 month decay series ending in July 2023 with an expected lower low in about 10 months.

The y/2-2.5y/2y :: 5/12/9 of 10 month decay series equates to a y/2-2.5y/2y :: 19/42/35 of 38 week decay series.

The terminal portion of the 35 of 38 week series is a 3/28/2023  11/28/22/4 of 16-18 days. (The below graph incorrectly annotates day 5 of 16-17) Already, a large nonlinear lower  gap can be observed between day 1  and 2 (6/26 and 6/27/2023) of the final 17 day series. A 3/3 of 8/8 day decay series ::y/2.5y/2.5y  would complete the 17 day series.

Debt has been over expanded to power asset production and valuation growth in the US, China, Europe, and India. 

The global asset-debt system is currently near the time period of final valuation growth and abrupt  nonlinear deleveraging. An expected 10 additional months to a lower final low is expected in-spite of the federal reserve rapidly reversing course and introducing QE with again near zero long term interest rates.

For the US Wilshire the final daily  fractal series is a 17/36/26 of 37-38 day growth and decay fractal  series of xy/2xy/2xy, starting on 13 March 2023.

Tesla is following a 3 January 2023 24/56/46 of 57-58 day :: y/2-2.5y/2- 2.5y decay series, Observe the 56 day second fractal’s nonlinear gapped low between day 51 and 52, in the terminal 2-2.5x region, characterizing a second fractal. A secondary lower high peak valuation is expected near day 48 of the third fractal. The x/2-2.5x/2x :: 24/56/48 day growth fractal will then efficiently transform into a y/2-25y/2-2.5y decay fractal. An interpolated fractal from 5/16/2023 of 7/15/13-14/10-11 days will complete the 24/56/57-58 day Tesla decay fractal series.

Non-Stochastic Saturation Macroeconomics