In the asset debt macroeconomic system what is the worst bubble element – an asset overproduction and overvaluation bubble or an unsustainable debt overproduction bubble at the consumer base of the asset-debt economic pyramid? While the two elements are closely linked, each of two might be individually assessed for comparison at peak system valuation of commodities and equities at prior asset peak valuations :1637, 1720, 1929, 2000, 2007, and now in 2024.
Qualitatively of these climax years 2024 is arguably the worst of the extremes of both global overproduction and overvaluation of assets and overproduction of consumer unsustainable debt. China, the second leading economy, has a collapsing consumer owned housing market with awful inactive parameters of a declining population, falling prices and 50-100% unoccupied residentials. With the early 2020-2022 historically low US mortgage interest rates and MBS’s inflating US residential valuations by 14 trillion dollars, and later in 2023 and 2024 with mortgage interest rates at 20 year highs, the global leading economy has its consumer housing prices both at historical high valuations and representing 5-6 times annual median wages for new purchases. US consumer credit card, college, and mortgage debt are likewise at historically high percentages of median wages. Vehicle repossession rates, the litmus test of the fragility of the consumer based economy, are rapidly climbing as consumers cannot pay interest and principal on car loans.
And while sovereigns can print money to monetize their national debt, individual citizen consumers cannot.
In May (not April) 2024, gold in USD completed a year 2001 51/128/102 month :: x/2.5x/2x peak valuation growth fractal with gold peaking at 2454.20 dollars on 20 May 2024.
Gold’s monthly long term peak valuation in US dollars and the concurrent Wilshire valuation May 2024 peak suggests that May 2024 is a global valuation peak for the global asset-debt macroeconomic system.
From the May 2024 gold in USD and Wilshire peak valuations, valuations of global equities, commodities, and cryptocurrencies will significantly fall from the twin bubbles of global overproduction of assets and unsustainable consumer debt loads.
Sovereign debt instruments will appreciate as sovereign interest rates fall in a global recession.
Tulip, South Sea, Roaring Twenties, Internet, Housing, and ??? What name will be given to the US Peak Equity and Gold in USD May 2024 global asset valuation collapse?
The 2001 to April 2024 Gold in USD 51/127/102 Month :: x/2.5x/2x Peak Fractal Growth Valuation.
Since 2001 US asset prices have been pushed by debt expansion to what would currently appear to be a limit. The Federal Reserve inflated residential prices by over 14 trillion dollars with between March of 2020 and March 2022 with Federal Reserve MBS’s and 2.5-3.5 % inflation rates. Blue collar and US service workers have been priced out of the American dream.
Under the umbrella of US debt expansion, Chinese property overvaluation, and a US service sector based economy encumbered with debt, gold in US dollars has progressed in a x/2.5x/2x :: 51/127/102 monthly fractal fashion since 2001, peaking on the 102nd month of the 102 month third fractal in April 2024
1 May 2024: The March 2020 to April 2024 Global Equity 8/24/20 Month Fractal Growth Series; Why did the 24 Month Second Fractal Have An Extended Cycle Length beyond 2.5x ?; An Ongoing 1929-Like Three Phase Series Daily Fractal Collapse ?
1 May 2024: The March 2020 to April 2024 Global Equity 8/24/20 Month Fractal Growth Series; Why the 24 Month Second Fractal Had An Extended length: A 1929-like Three Phase Series Daily Fractal Collapse Ongoing and Ahead?
Historically large US annual percentage deficit federal spending /GDP ratios in 2020 and 2021 caused a prolonged 24 month second fractal in the March 2020 to April 2024 8/24/20 month three phase QE/QT three phase fractal growth series for global equities.
The annual new US debt/GDP deficit ratio in 1942 post Pearl Harbor was 13.88%. This was only exceeded in 1943-45 until President’s Trump’s last year in office in 2020 at 14.71%. In President Biden’s first year the ratio was 12.1 % with the last two years at 5.4% and 6.3%. In addition to the 2020 and 2021 large % GDP/deficit spending, March 2020 fed funds interest rates were rapidly lowered to near zero with 2.7-3.5 % mortgage rates. The Federal Reserve bought an additional March 2020 to June 2022 1.4 trillion dollars of MBS’s. This facilitation inflated real estate prices which created an additional wealth effect among homeowners and the owners of rental residentials, which contributed to the inflation of other asset classes. Offsetting the accelerated QT rate increases to combat this inflation and initiated in early 2022, was another smaller Federal Reserve QE program instituted in March 2023 to prop up the banking system after Silicon Valley Bank et. al. failures.
The massive US QE program and historic federal deficit spending in 2020 and 2021 (matched by Western and Eastern central banks) prolonged the 8 month March 2020 global composite equities’ second fractals, which started in October 2020 and ended in Sept 2022 with a duration of 24 months: 4/9/8/6 months :: x/2-2.5x/2x/1.5x or two combined fractal series: 2/5/4/3 months and 3/6/7 months :: a/2x/2.5x/1.5x and x/2x/2-2.5x, respectively. (see below) The current fractal series from March 2020 to April 2024 is 8/24/20 months with the 20 month April 2024 peak valuation occurring in a 5/10/7 month :: x/2x/1.5x fashion.
The March 2020 to April 2024 STOXX Europe 600 Index XX:SXPP and Nikkei monthly fractal series best exemplifies this 8-9/24/20 monthly three phase fractal growth pattern marked by nadir valuations between the first and second and the second and third fractals.


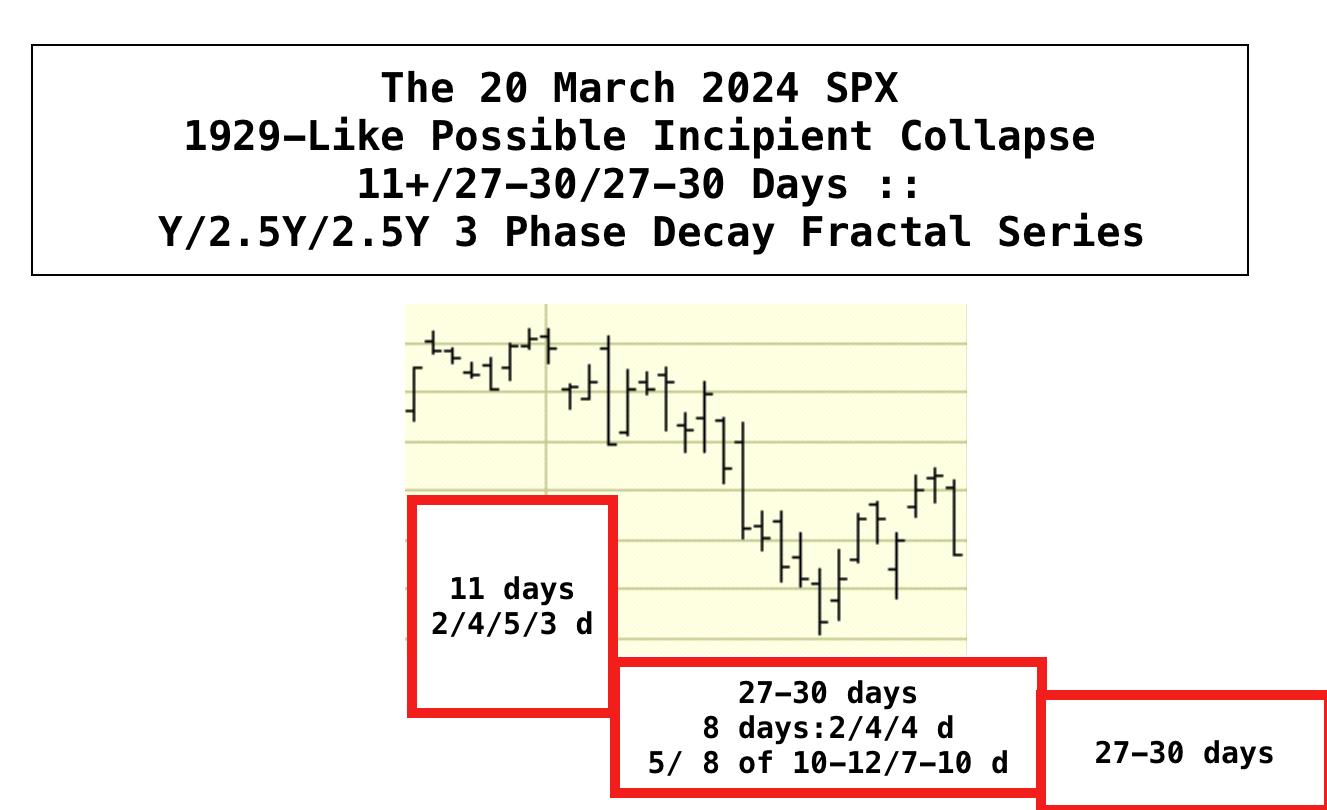
A potential 1929-like SPX primary daily decay fractal series of 11+/27-29/27-29 days is observable starting 20 March 2024. First fractal: 2/4/5/3 days (11 +days) ending 4 April. Second fractal (starting 4 April 2024)8 (2/4/4 days) //(5/8 of 10-12/7-8) (27-30 days) // and third fractal of 27-30 days. A significant drop in US global equity valuations could precipitate an expected fed funds rate cut. A lower high rebound might then extend beyond the US 2024 November elections.