It is hypothesis of this website that easily tradable assets, both nondebt and debt entities, grow and decay in an optimal and deterministic time-based self-assembly fractal manner; either in a three phase fashion: x/2-2.5x/1.5 to 2.5x or in a four phase fashion: x/2-2.5x/2-2.5x/1.5-1.6x.
Unraveling of the US hegemony started in the 1990’s by career US politicians, lobbied and supported by US corporations who favored greater profits with foreign-based manufacturing and inexpensive labor. The US hegemony is following a 4 phase 1807 36/90/90/54 year :: x/2.5x/2.5x/1.5x fractal series for equities and commodities after having an incipient 18 year fractal base from 1790 to 1807.
Since 1982 US equities are following an interpolated 13/32 of 32-33/32-33/20 year four phase fractal series ending about 2054 . In this four phase series expected is a great 32-33 year second fractal crash occurring in 2025-2026.
Since 2000 2-3 % average GDP annual growth has been sustained by an average of 5 % GDP-deficit spending with the US central bank, US citizens and institutions, and the world subsidizing US debt. Until 2020, low-labor cost imported manufactured goods exchanged for US farm goods, US energy, and US debt maintained a low inflationary environment. With the increasing cost of foreign labor – and more recently the US adopting an isolationist posture, the abrupt ice-cold alienation of former allies, and the threatened and real imposition of new tariffs – both support of US debt growth from other than the US sources and the expectation of a low inflationary environment will qua;itatively wither.
A March 2020 3-phase 8+/24/14 month :: x/2.5x/1.6x fractal growth series ended on 27 October 2023.
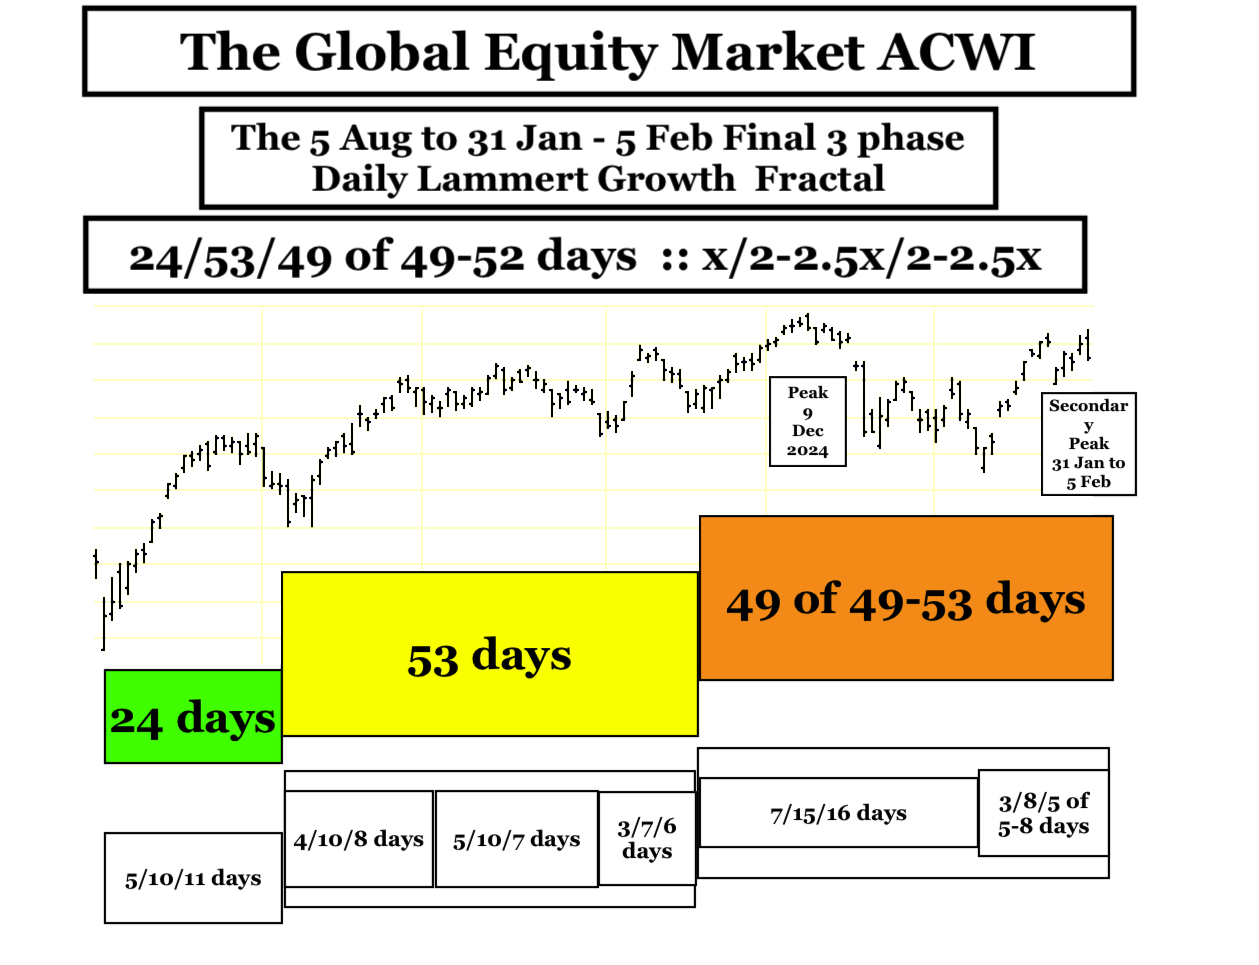
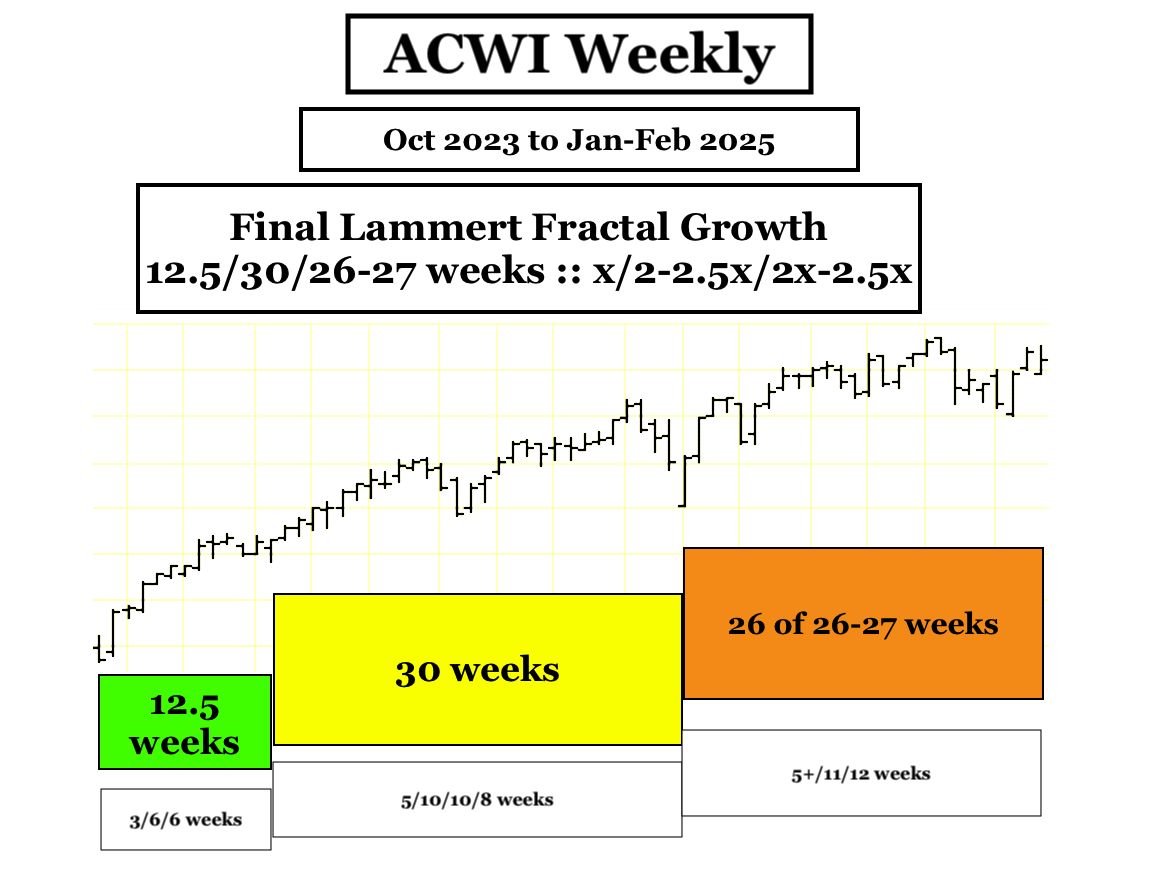
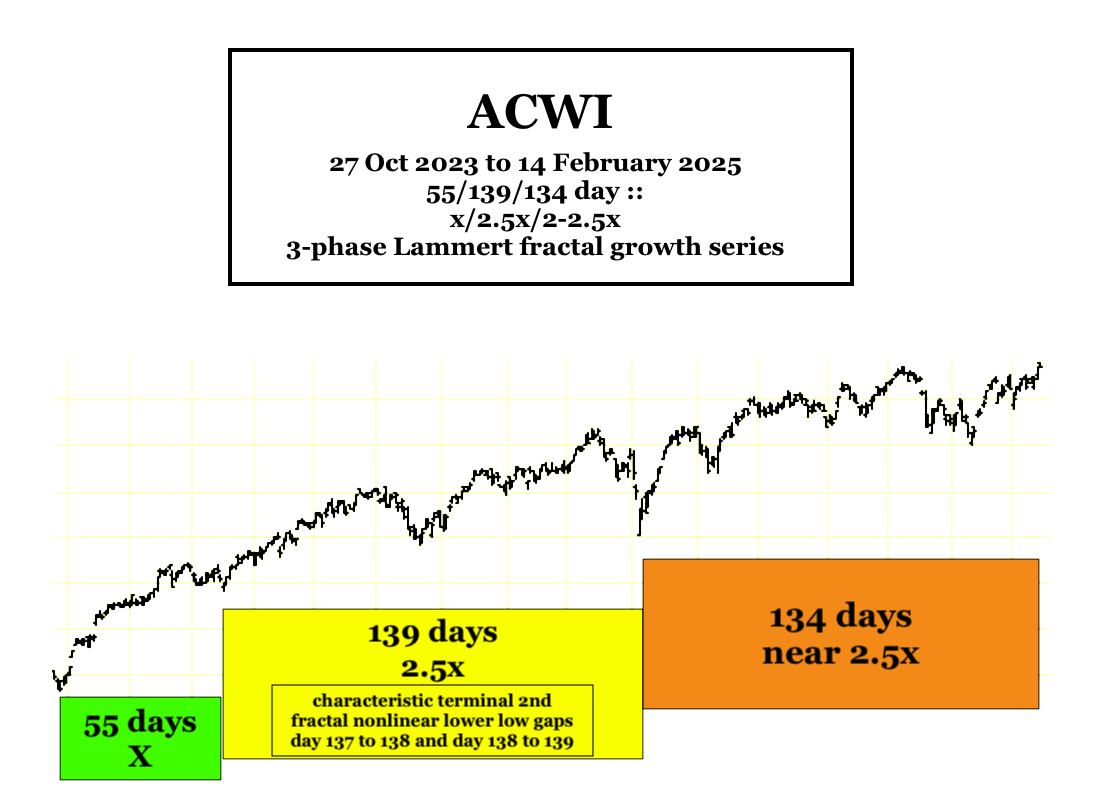
On February 14 2025 a new high for ACWI, the 115 trillion dollar ETF proxy, was observed with a tiny blow-off gap opening at the beginning of the trading day with an end trading valuation near the low of the day (see the ten day 15-minute unit ACWI chart at the bottom of the page.) : 14 February completed nested fractal growth series: an 8 December 2024 7/14/18/11 day :: x/2x/2.5x/1.5x inverse growth fractal series: a 5/11/10 day a/2-2.5x/2x growth fractal series: a 5 Aug 2024 24/53/59 day :: x/2-2.5x/2-2.5x growth fractal series: and a 27 Oct 2023 55/139/134 day :: x/2.5x/2-2.5x growth fractal series. See below.
(In the previous post, the 5 Aug 2024 3-phase fractal series had been identified errantly as a 24/52/54 or 128 day series vice the correct 24/53/59 day or 134 day series and the 27 October 2023 fractal series as 55/139/128 day series vice the correct 55/139/134 day series. )


TNX, the US Ten Year Note interest rate came within 0.2 % of its 23 week third fractal lower interest rate growth trendline. It is possible for TNX to touch the third fractal lower interest rate growth trendline on Tuesday or Wed, 18 or 19 February 2025 with a final 2/5/4-5 day growth fractal of ACWI completing a 5/11/11-12 day fractal series rather than the current 5/11/10 day series.

Within the global asset debt macroeconomic system, it appear obvious that deterministic equity self assembly growth to a maximum valuation within the frame work of the simple laws of Lammert fractal progression is both observable and operative.