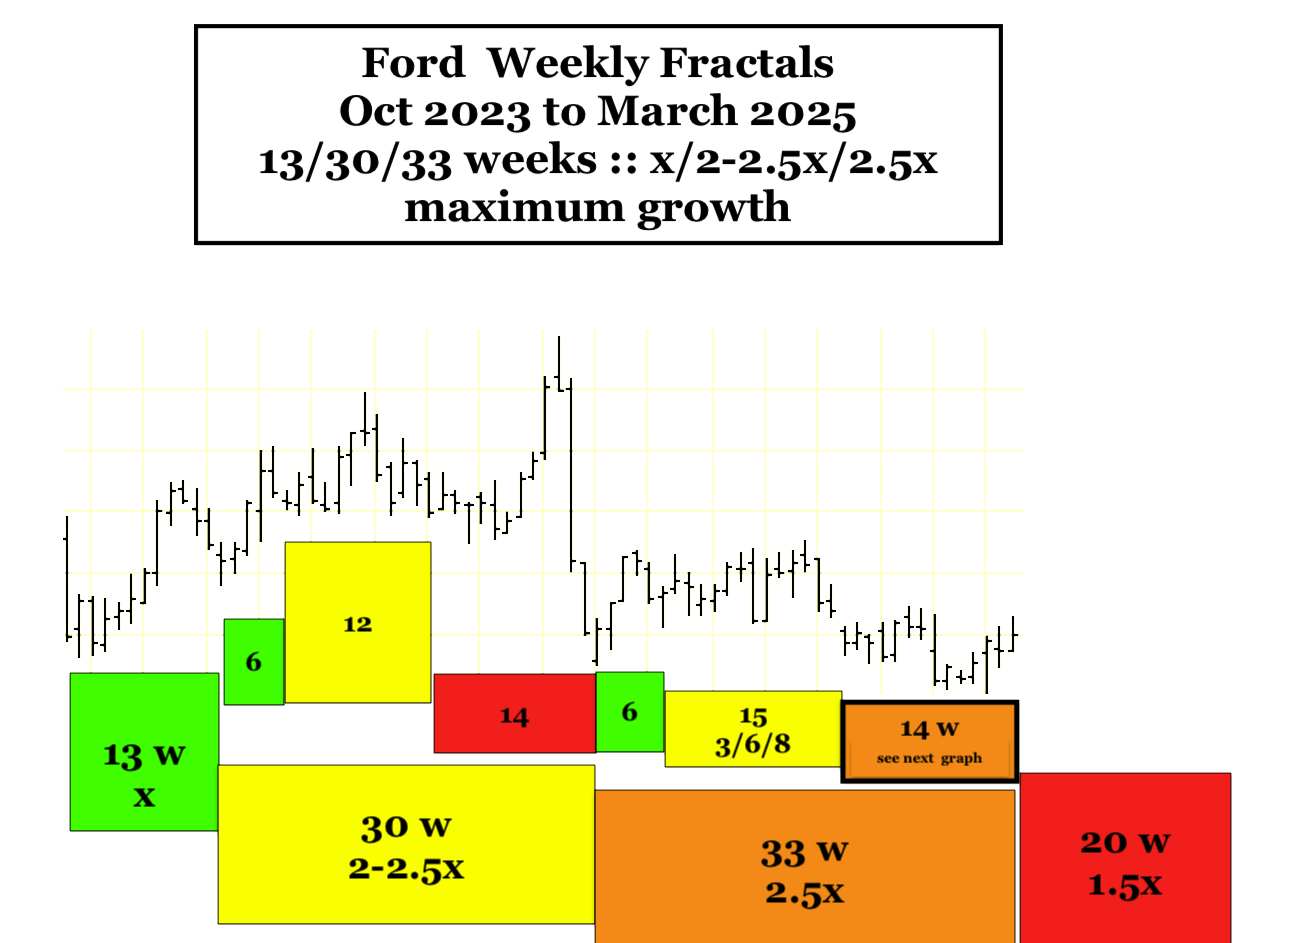
The SPX 12 February 2025 9/23/18-23 day CRASH 3-Phase y/2.5y/2-2.5y Fractal Decay Series model remains intact.
The 17 March 2025 post identified the above 3-phase incipient Lammert crash decay fractal series model (below) fractally similar to the incipient 1929 12/29/27 day :: y/2-2,5y/2-2.5y incipient 3-phase crash decay fractal series.
The 1929 incipient crash fractal series was in the terminal portion of a 1807 to 1932 36/90 year ::x/2.5x 1st and 2nd fractal series. The 12 February 2025 incipient 3-phase crash fractal series is in the terminal portion of an interpolated 1982 13/32-33 year :: x/2.5x 1st and 2nd fractal series.
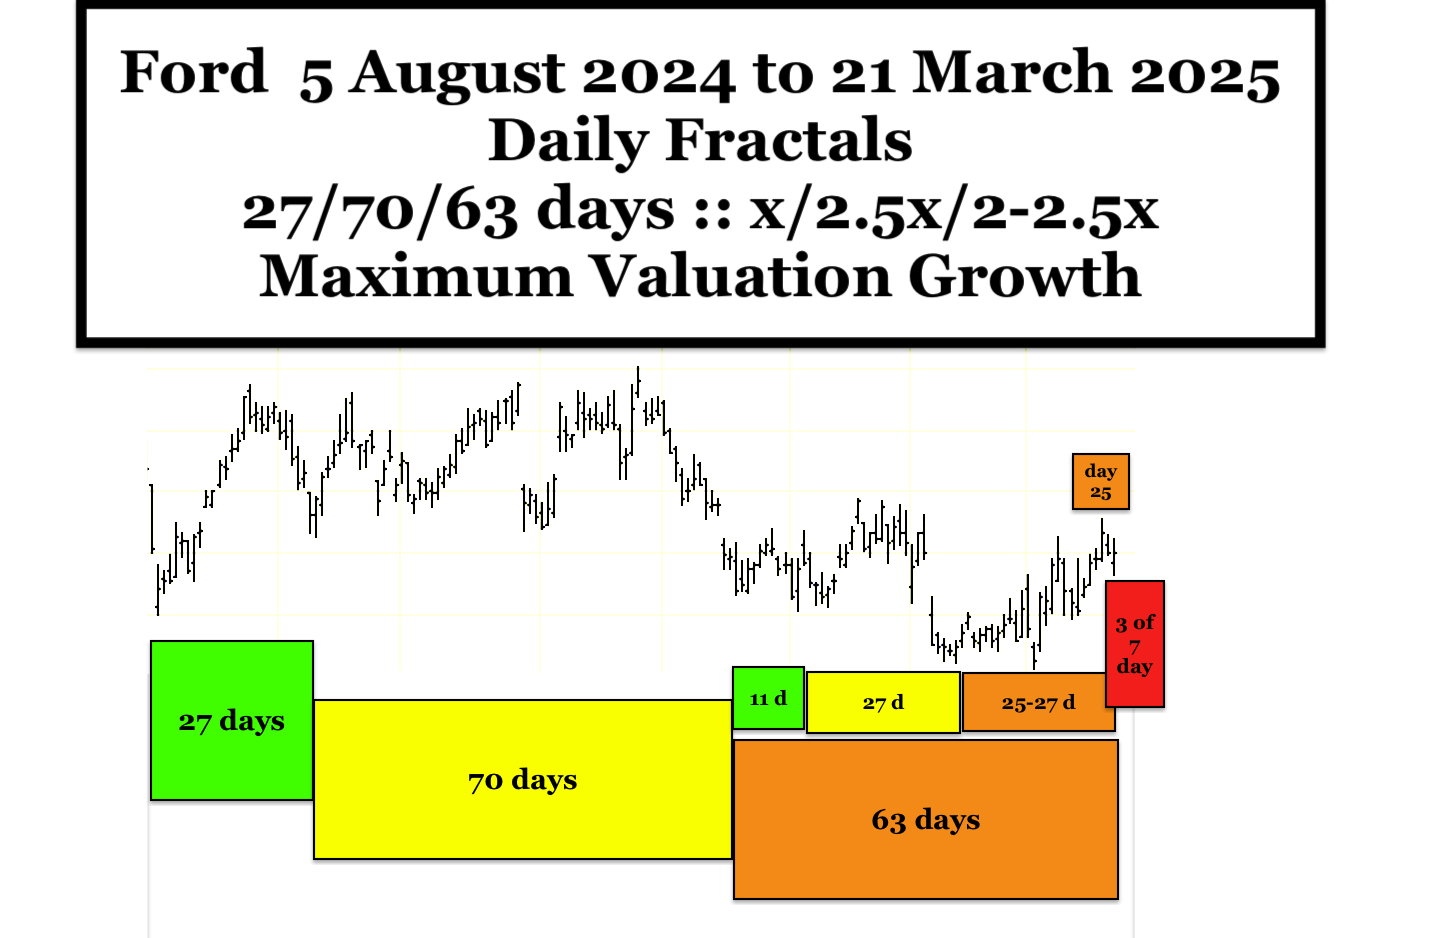
The new model, instead of a 3/6/6 day decay fractal subseries to complete the 23 day 2nd fractal has a 3/7/5 day growth and decay fractal subseries which on an hourly basis is a 15+/39/7 of 35-39 hour 3-phase growth and decay series:
Rebound growth from the 3 day 1st fractal subseries’ nadir to the 7 day 2nd fractal subseries’ peak was only about 4% showing extreme valuation growth weakness with an expected significant %-wise 5 day 3rd fractal subseries devaluation completing the 23 day 2nd fractal. Like 1929’s final 3rd fractal 27 day decline, the 2025 3rd fractal’s final 22-23 day decline is expected to have a much greater magnitude of valuation decline than the 23 day 2nd fractal (after an initial rebound valuation growth of about 3-6 days duration.)
The asset-debt system’s mathematical fractal self-ordering of composite equities predicts a significant 1982 13/32-33 year :: x/2.5x 1st and 2nd fractal series 32-33 year 2nd fractal nonlinear devaluation with a likelihood of reaching the 1982 to 1994 13 year trend line. Qualitatively the ongoing and accelerating collapse of the Chinese housing bubble and deteriorating Chinese export volume are expected to cause a very serious deflationary recession/depression in the Chinese macroeconomy with a tremendous oversupply of 2024/2025 produced EV’s to accompny the residential oversupply. US self-inflicted tariff-trade dislocations, associated policy unpredictability, the lost of federal jobs (and the anger directed against the former big 7 Tesla manufacturing giant), the alliance disruptions (whose nations hold about 7 trillion dollars of US debt), and the cancellation of US corporation military hardware and software contracts place the expected asset-debt macroeconomic system’s 32-33 year 2nd fractal’s 2nd terminal nonlinear decay under one of the worst possible imaginable simulations. The post hoc ergo propter hoc logic will dictate that the naturally occurring equity collapse will, per force, be attributed to the multitude and severity of US policy changes.
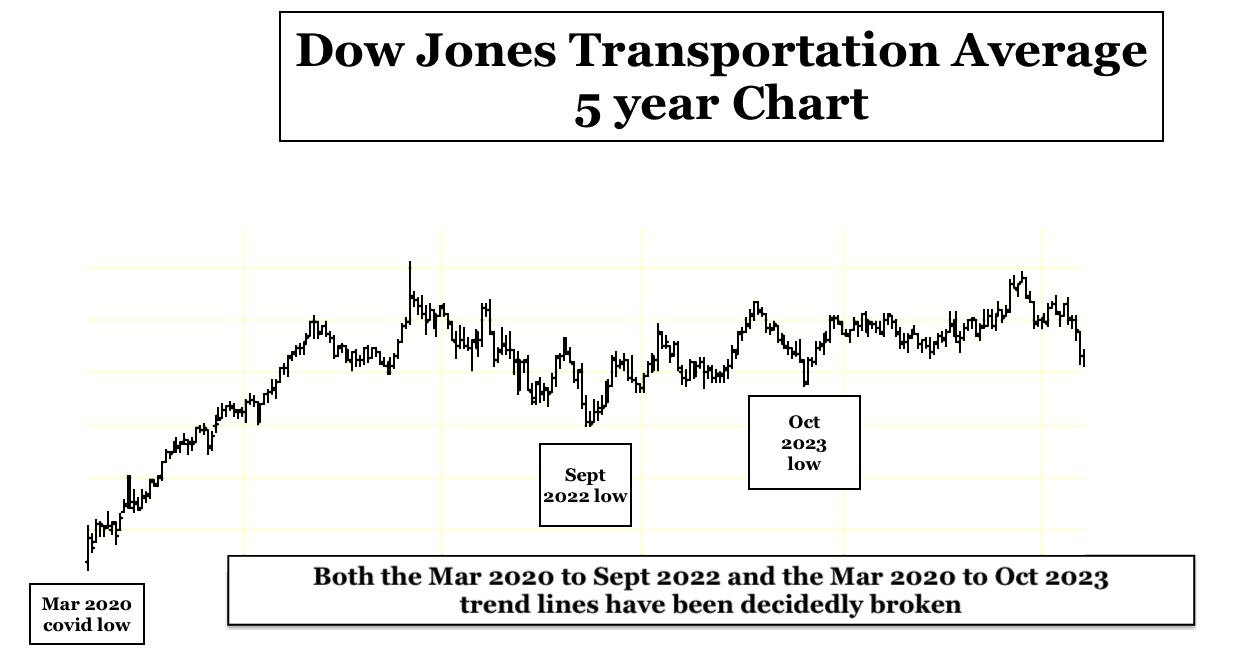
The Dow Jones Transportation Index(DJT) is the canary in the coal mine for the US economy (and US equities) in a globalized macroeconomy dependent on transoceanic transport of goods and US railroad and trucking distribution of those shipyard goods. This is likely a very good litmus test for future American consumer activity dependent on relatively stagnant wages relative to cost of living inflation, and increasing private citizen, corporate and local, state, and federal governmental debt load and interest payments.
The DJT 1994 to 2025- 2026 second fractal trend line is shown in red below:
On a 5 year chart, both the March 2020 to Sept 2022 and the March 2020 to October 2023 trend lines have been decidedly broken. (below)
The weakness of the Transports can be seen on a daily basis as compared to the SPX in the same time frame(see below and above)