What parameters concerning a field of study make that subject a science? Occam’s razor self-organizing patterns, unifying laws underlying those patterns and predictability based on that knowledge.
The big bang theory is primarily based on the red-shift of light as explained by an expanding universe. The theoretical painful contortions of non-quantum mechanics physics winding the system back to the 10-E43 second singularity starting point seem to be the analogously wacky equivalent to Greek mythology. What if the CMB at z1100 are merely photons 10E6 further away than the most distant JADES GS-z-14.0 galaxy observed by the JWST and light simply undergoes linear energy decay in the ensuing gravitational field, a field about 250 times greater than the field that exists for the ‘old’ light traveling to us from the z-14.0 galaxies detected by JWST’s 0.5 to 28 micron detectors. The CMB then becomes merely representative of an infinite universe’s average photon wavelength dispersion that keeps the universe at average toasty 2.7 degrees Kelvin. Occam’s Razor would eliminate the need for a singularity’s very strange story and stranger subatomic physics.
With the greatest investment advantages, the asset-debt system’s equity assets empirical grow to their maximum saturation trading or economic cyclic fractal length. i.e., x/2.5x/2.5x before undergoing decay.
This happened with the US hegemony 1807 36/90/90 year :: x/2.5x/2.5x Wilshire composite 90 year 3rd fractal peak valuation on 8 November 2021 with a DJIA 90 year 2nd fractal low on 8 July 1932.
Credit and debt and the money supply was aberrationally grossly expanded by government spending and central bank accommodation during the COVID crisis. The March 2020 SPX underwent (self-organized) a 3 phase x/2.5x/1.6x growth and decay series of 8+/24/14 months ending 27 October 2023.
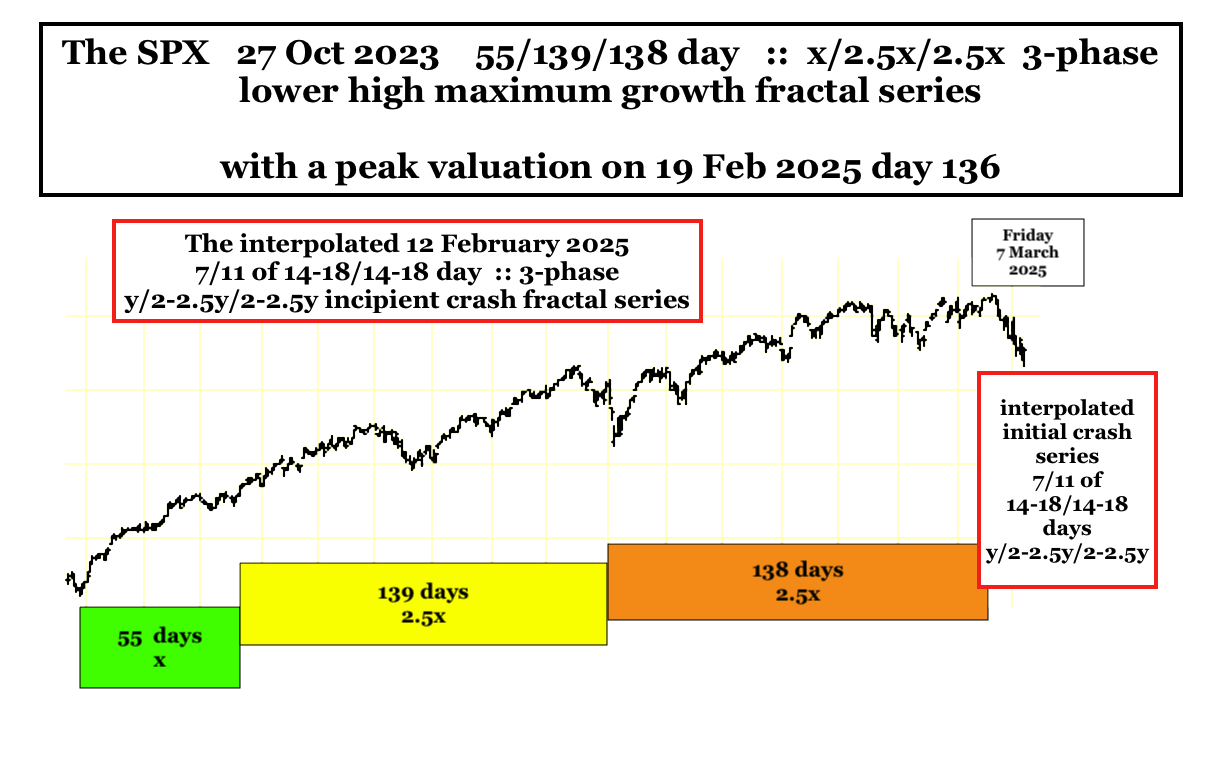
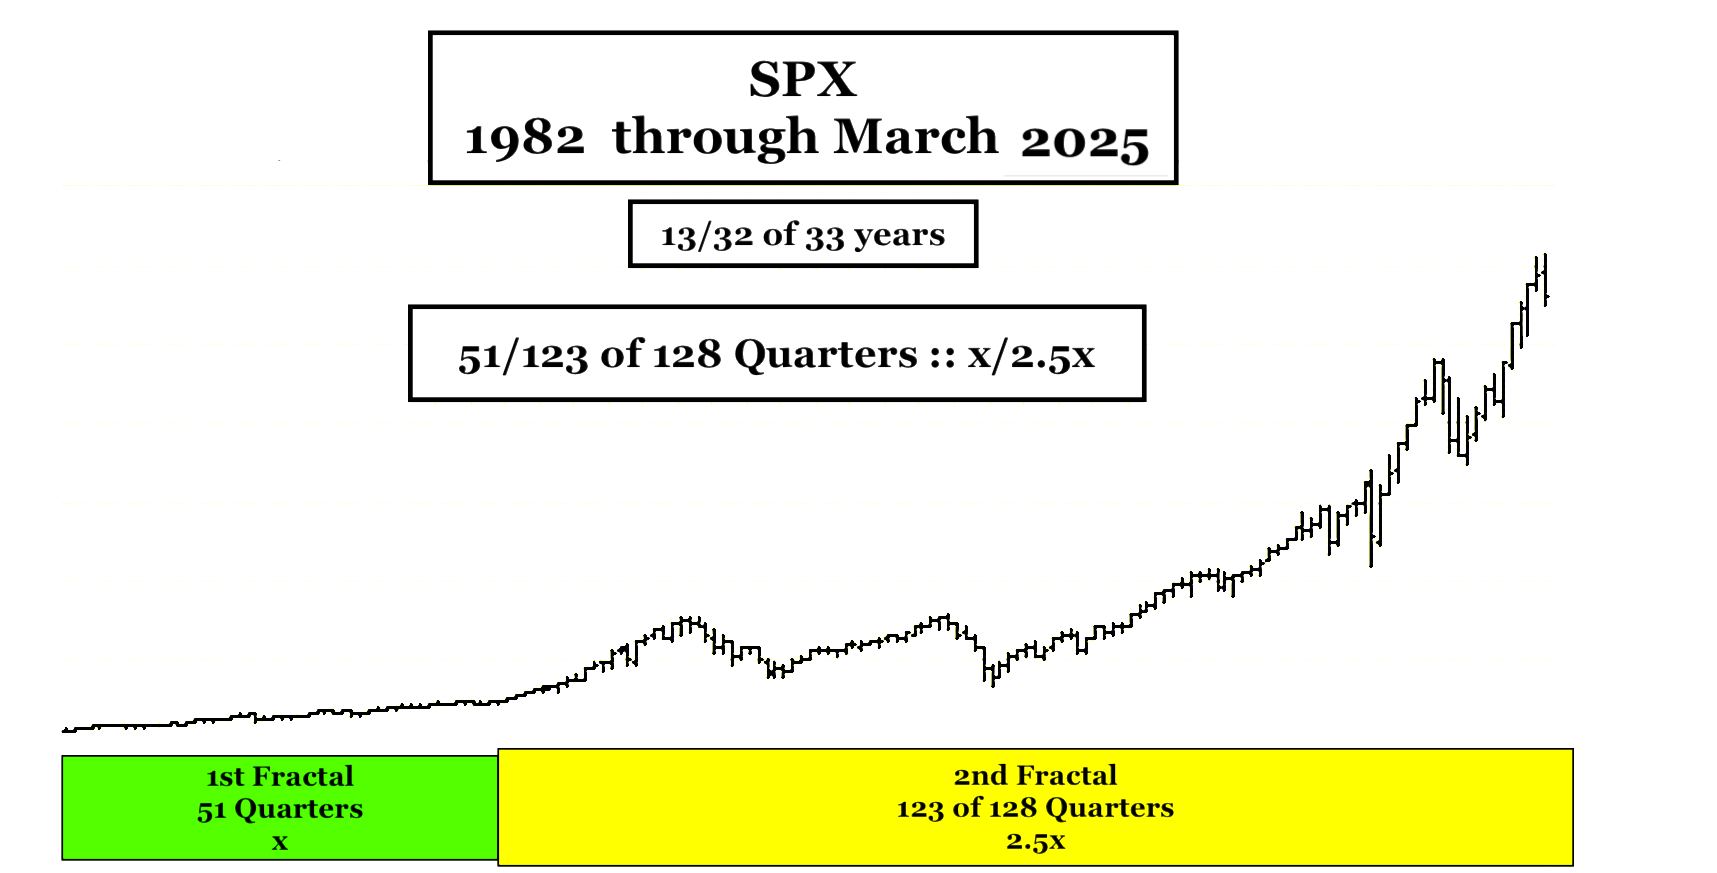
The SPX 27 October 2023 then self-assembled a 55/139/138 day :: x/2.5x/2.5x final lower high valuation with the peak valuation on 19 February 2025 or day 136 of the 138 day 3rd fractal providing an observable example of the system’s maximum 3-phase x/2.5x/2.5x fractal growth.
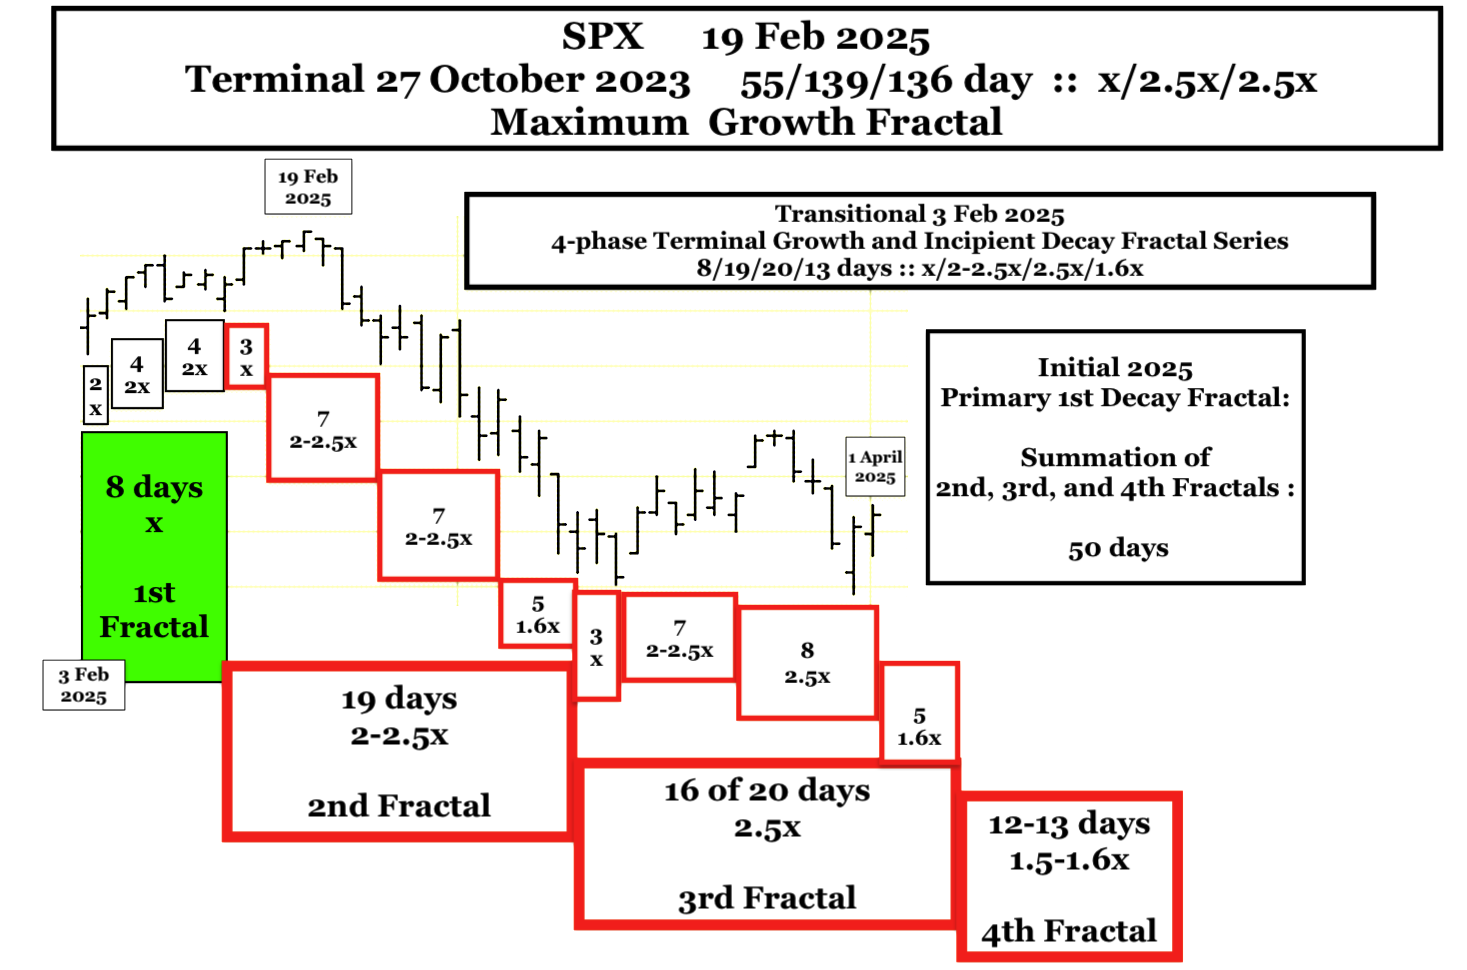
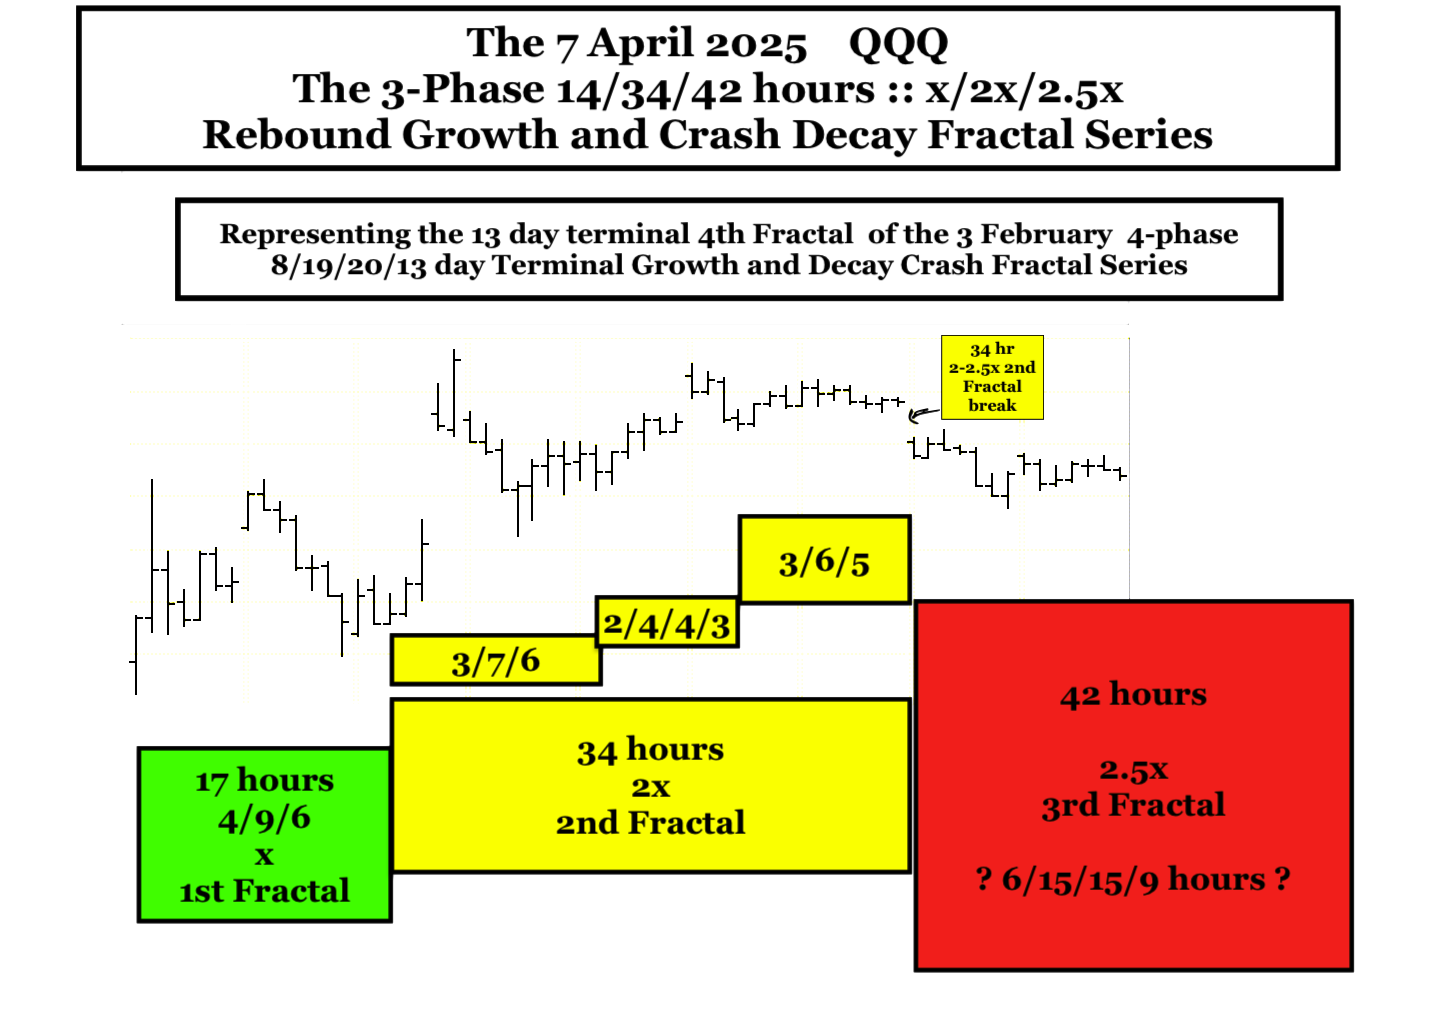
A final 4 phase 3 Feb 2025 SPX 8/19/20/13 day terminal growth (posted on 1 April below) and a fractal crash decay series will form a 19/20/13 day incipient 1st decay fractal taking the 1982 13/32 of 33 year interpolated 1st and 2nd fractal series to its 2026 nadir. (… Interpolated in the larger US 1807 hegemony 36/90/90 /54-57 year :: x/2.5x/2.5x/1.5-1.6x 4-phase fractal series ending in 2074-77.
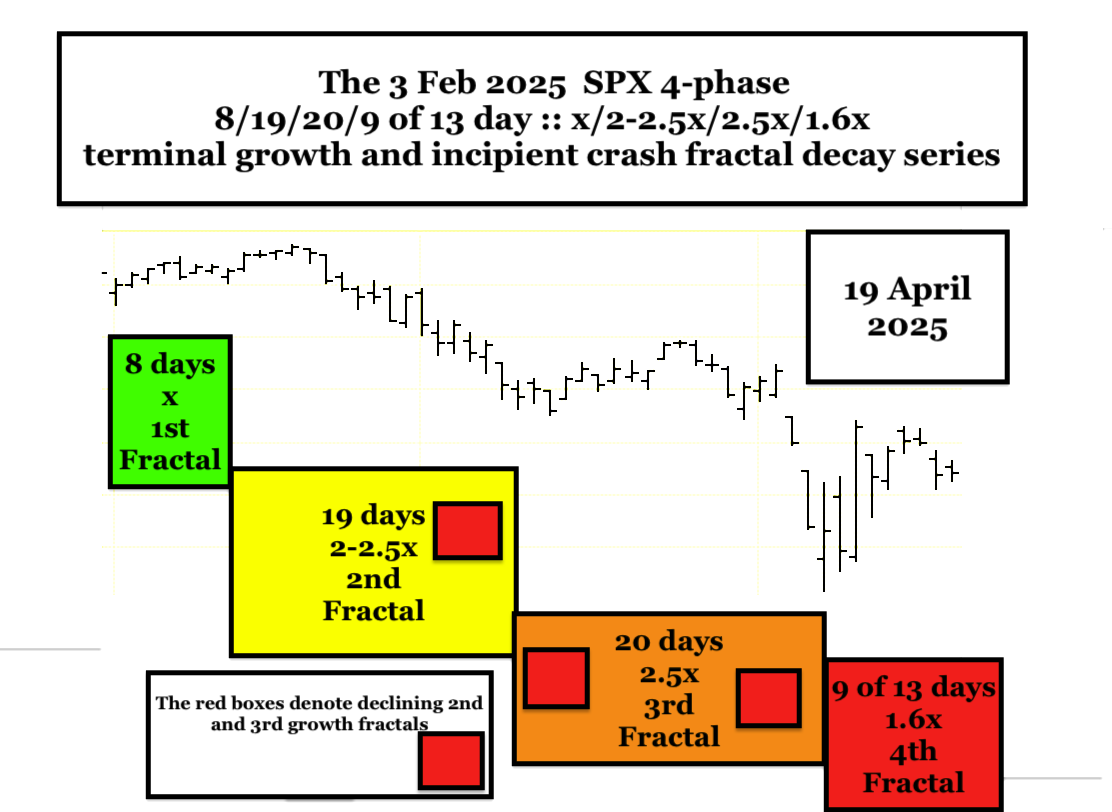
The 1 April 2025 post above is updated as of 19 April 2025 below:
The final 13 day 4th fractal appears to be composed of a 3-phase rebound growth and crash decay fractal series of 17/34/42 hours:
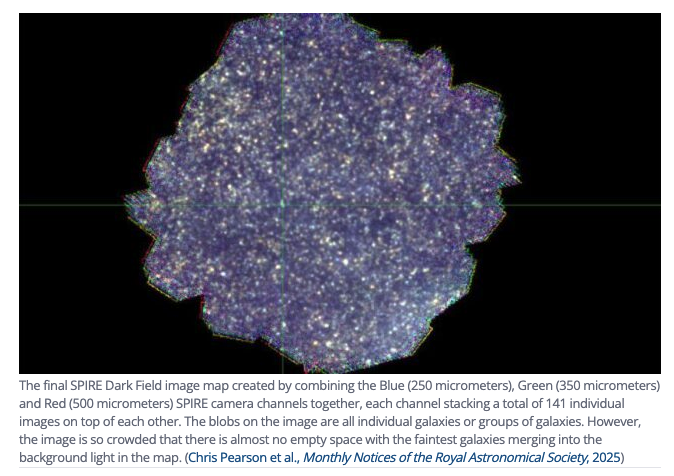
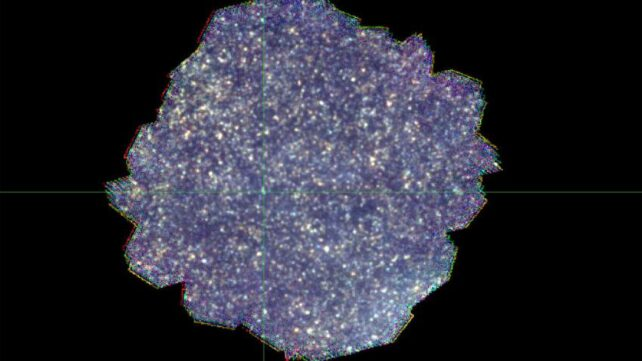
The furthest observable galaxy by JWST has a z number of 14.32 and the CMB a Z number of about 1089. If light loses energy and has wavelength lengthening in a gravitational field proportional to the distance traveled, The CMB wavelength 1900 microns would be on average a little over 2E6 further away than the farthest observable galaxy. The JWST has an infrared detection system of 0.6 to 28 microns. What if space telescopes were developed with deep infrared detectors at 50 100 200, 400, 800, 1600 micron wavelength that could detect photons with lower and lower energies? A telescope with an 800 micron wavelength detector might have to be focused on a specific location for 1-10 years (maybe that’s technically impossible)to collect enough photons – with the photon field from 500Z distant galaxies being reduced by the inverse square with the doubling of distances. Deep AI retrieved this information about one far infrared telescope. The Herschel Space Telescope was a deep infrared telescope that operated at about 60- 670 microns from 2009 to 2013 at about 750,000 to 1.1 million miles earth orbit when it depleted its liquid helium. Recently (April 2025) data from the 2009-2013 Herschel Space Telescope was computer reanalyzed showing new more distant galaxies.
The final SPIRE Dark Field image map created by combining the Blue (250 micrometers), Green (350 micrometers) and Red (500 micrometers) SPIRE camera channels together, each channel stacking a total of 141 individual images on top of each other. The blobs on the image are all individual galaxies or groups of galaxies. However, the image is so crowded that there is almost no empty space with the faintest galaxies merging into the background light in the map. (Chris Pearson et al., Monthly Notices of the Royal Astronomical Society, 2025)
With both narrower range and longer wavelength far infrared detectors it might be possible to discover more distant galaxies at specified wavelength distances … up to the current cosmological limit of the CMB where the steady state infinite universe has an average temp of 2.7K consistent with the CMB 1.9 mm or 1900 micron wavelength.
The synchronous East and West, Chinese and US, equity market Crash of 2025 thru 2026 are an asset-debt macroeconomic system quantitative time-based fractal inevitability. It may be difficult to convince most observers that the Great Global Crash was only made significantly worse by a trade war – not precipitated by one.
The East: China: The Shanghai Composite Index(SCI)
The Elegant Self-Ordering Quantitative Fractals of the SCI
Under the strong guidance of the CCP, China has become the largest manufacturing country in the world. As opposed to the former Soviet Union leadership whose near sole focus was on military production to compete, the CCP has focused on the development and expansion of a broad industrial base to claim a leadership role in global affairs.
The Shanghai Composite Index(SCI)has a decidedly different fractal valuation growth and decay pattern from the US SPX 1982 13/32 of 33 year fractal pattern.
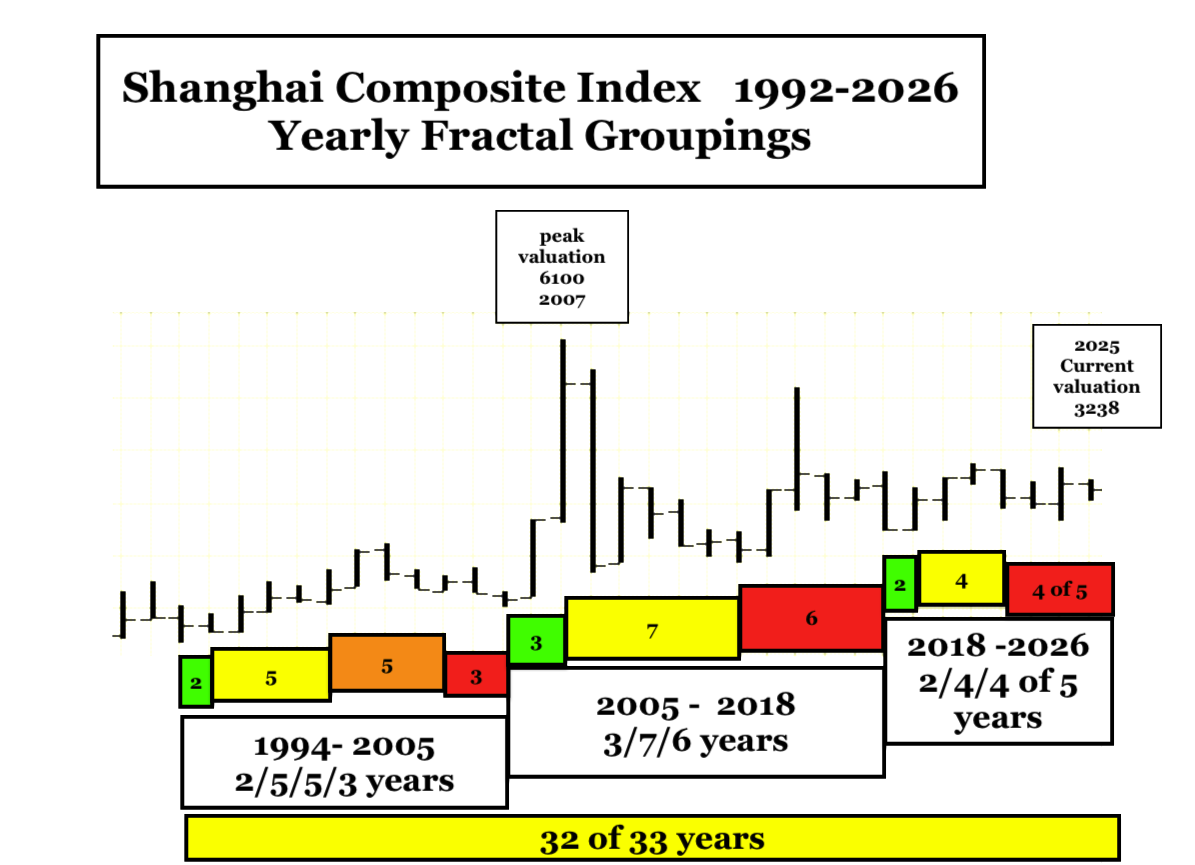
Nevertheless on a 35 year scale, the SCI started from a 1994 nadir similar to the SPX with a 30 year valuation growth peak on 16 Oct 2007 at about 6100. Over 17 years later it is now about at 3240, 47% below its 2007 peak valuation with a most recent 8 Oct 2024 lower high valuation of 3674 or about 40% below its 2007 peak valuation. By comparison the SPX peaked at 6147 on 19 Feb 2025 about 400% above it 2007 peak valuation. The US hegemony advantaged with its alliances and with its ownership status of the world’s reserve currency has been a vortex for global capital flow into its equity markets.
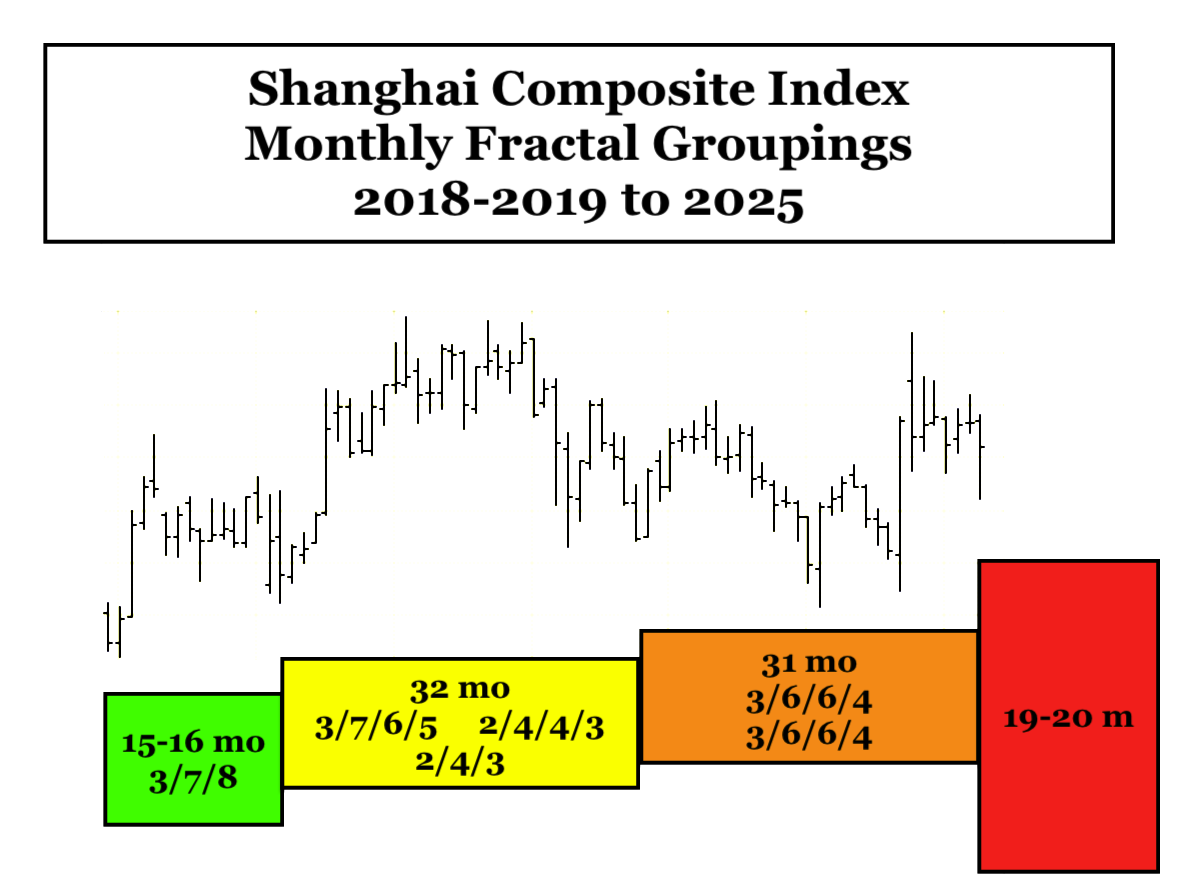
The SCI yearly fractal groupings since 1994 are 2/5/5/3 years, 3/7/6 years, and 2/4/4 of 5 years. The total of the fractal groupings is 32 of 33 years and will be synchronous with the length of the 1994 to 2026 SPX 33 year 2nd fractal.
The last SCI yearly fractal grouping of 2/4/4 of 5 years can be observed on a monthly basis to be 15/32/31 of 31/19-20 months :: x/2-2.5x/2x’/1.5-1.6x’ with x’ of the 32 2nd fractal equaling 13 months and 1.5-1.6x’ equaling 19-20 months for completion of the 4th fractal in 2026. The red 19-20 month 4th decay fractal represents the implosion of the overproduced, overvalued bubbled Chinese residential property market, a domestic purchasing recession, restructuring of debt and devaluation of assets.
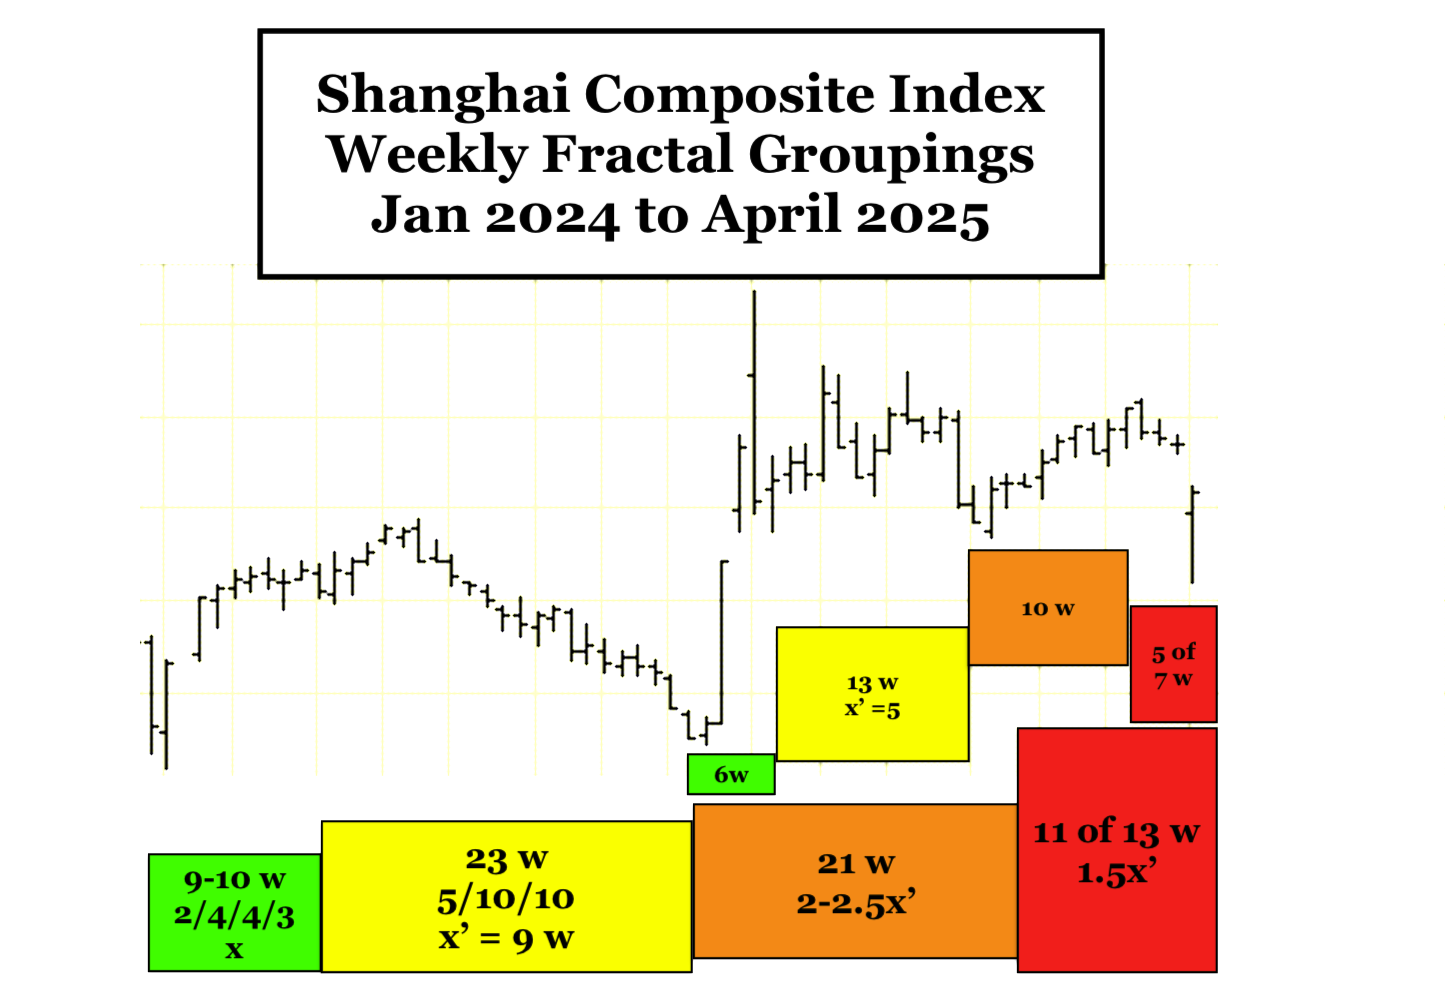
The SCI’s 3rd fractal of 31 months above can be observed on a weekly basis to be 10//23-24//(5-6/13/10/5 of 7) weeks with the sum of the 1st and 2nd fractals 32-33 weeks equaling the the sum of the interpolated 3rd and 4th fractals, 33 weeks.
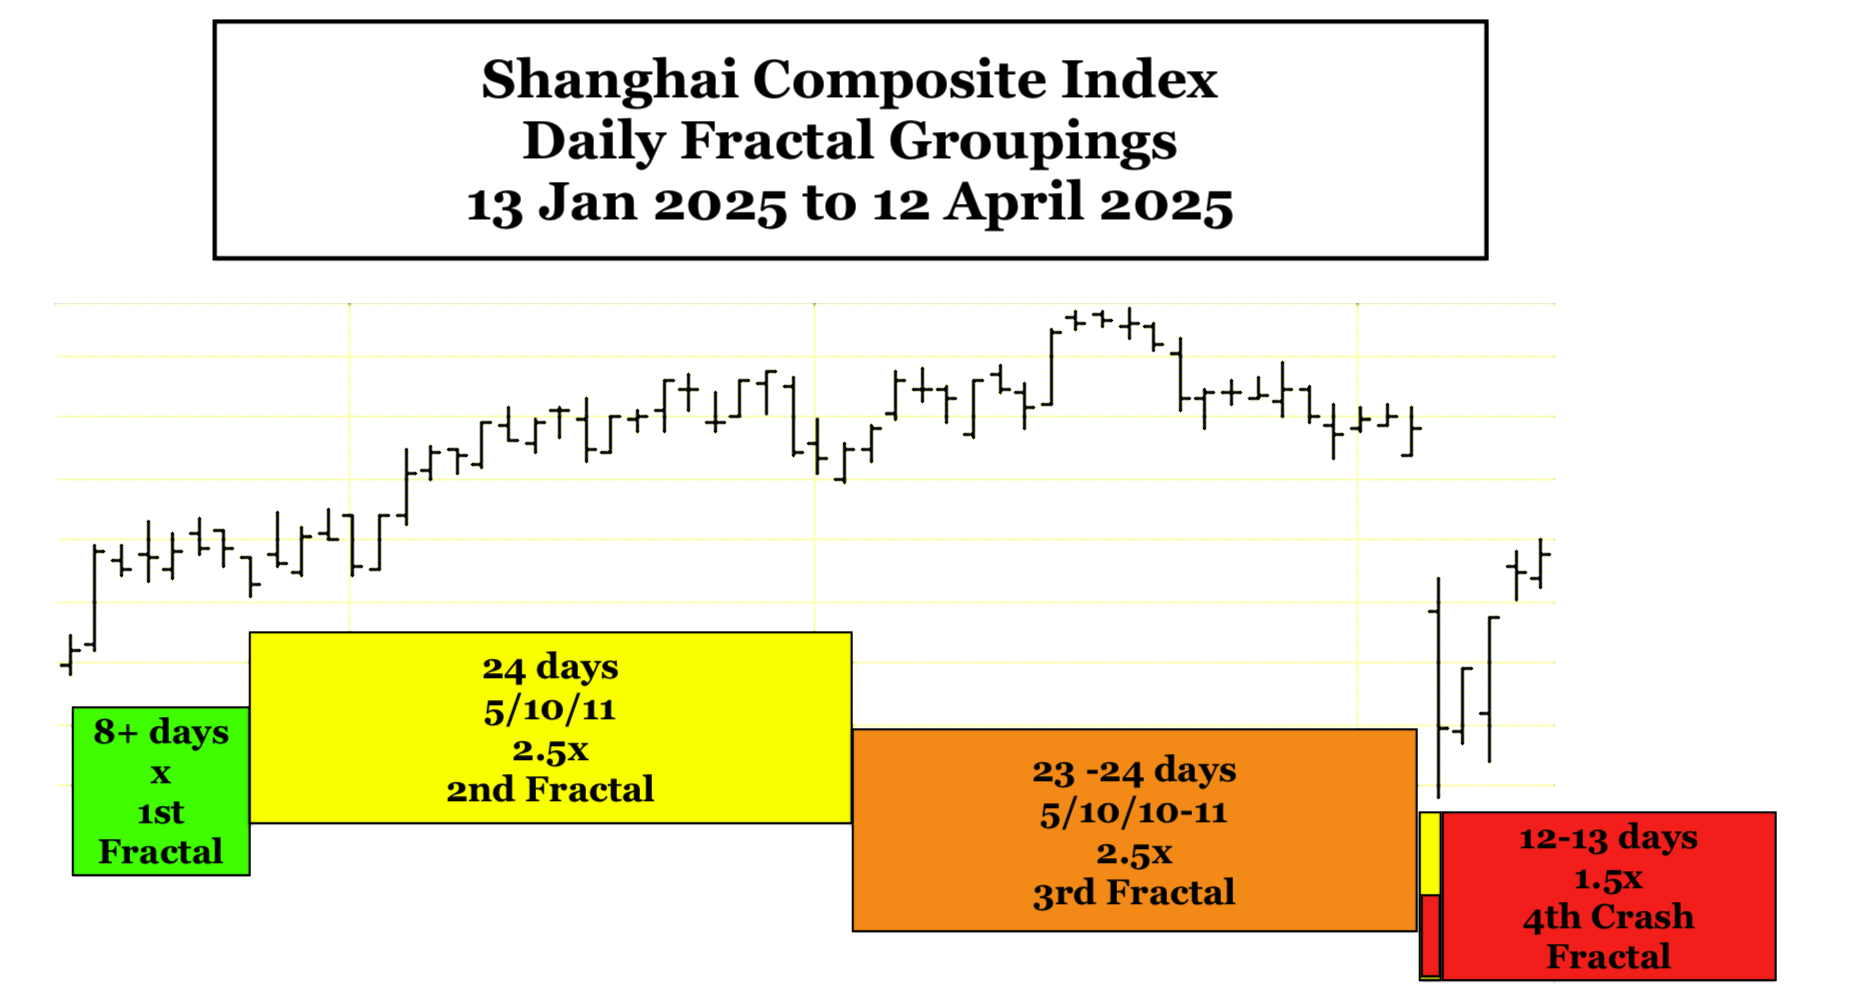
On a daily basis the SCI final 4-phase fractal series akin to the SPX 3 February 2025 8/19/20/12-13 day terminal growth and crash fractal series starts on 13 Jan 2025 and consists of a 4-phase 8+/24/23/12-13 day series. The incipient primary 1st decay fractal is the summation of the 2nd, 3rd, and 4th fractals or about 58 days. A 58/116-125/116-125/75-78 day x/2-2.5x/2-2.5x/1.5-1.6x fractal decay series would place the 2026 low in about August-September.
The West: The US, Europe, and Japan: The SPX, the STOXX, the NIKKEI (The Nikkei is following a western self ordering fractal pattern)
The SPX is undergoing a 1982 13/32 of 33 year :: x/2.5x 32 of 33 year 2nd fractal nonlinear collapse similar to the 1807 36/90 year :: x/2.5x 87 of 90 year 2nd fractal collapse peaking on 3 Sept 1929(DJIA) and nadiring on 8 July 1932(DJIA). The 1982 SPX 13/32 of 33 year 1st and 2nd fractal series ending in 2026, is an interpolated fractal series(13/33/32-33/18-20 year) within the larger US 1807 36/90/90/54-57 year hegemonic 4-phase fractal series, which ends in 2074-2077. The final 3-phase x/2.5x/2.5x fractal maximum growth pattern self-similar to the 1807 36/90/90 year pattern peaking on on 8 Nov 2021 (for the US composite Wilshire) was a SPX 27 Oct 2023 55/139/138 day :: x/2.5x/2.5x maximum 3-phase growth pattern peaking on day 136 (19 Feb 2025) with a final lower low on day 138. Note the gapped nonlinear lower lows in the terminal portion of the 139 day 2nd fractal.
A potential 3 Feb 2025 4-phase Lammert terminal growth and incipient fractal crash decay series of 8/19/20/12-13 days :: x/2-2.5x/2.5x/1.6x was identified in a 1 April 2025 posting as below.
Thus far, this model is holding true with a 20 day 3rd fractal low on 7 April 2025.
The SPX is now undergoing a self-assembly process for its last 12-13 day 4th fractal in the 3 Feb 2025 terminal growth and incipient fractal crash decay series of 8/19/20/12-13 days :: x/2-2.5x/2.5x/1.5x-1.6x.
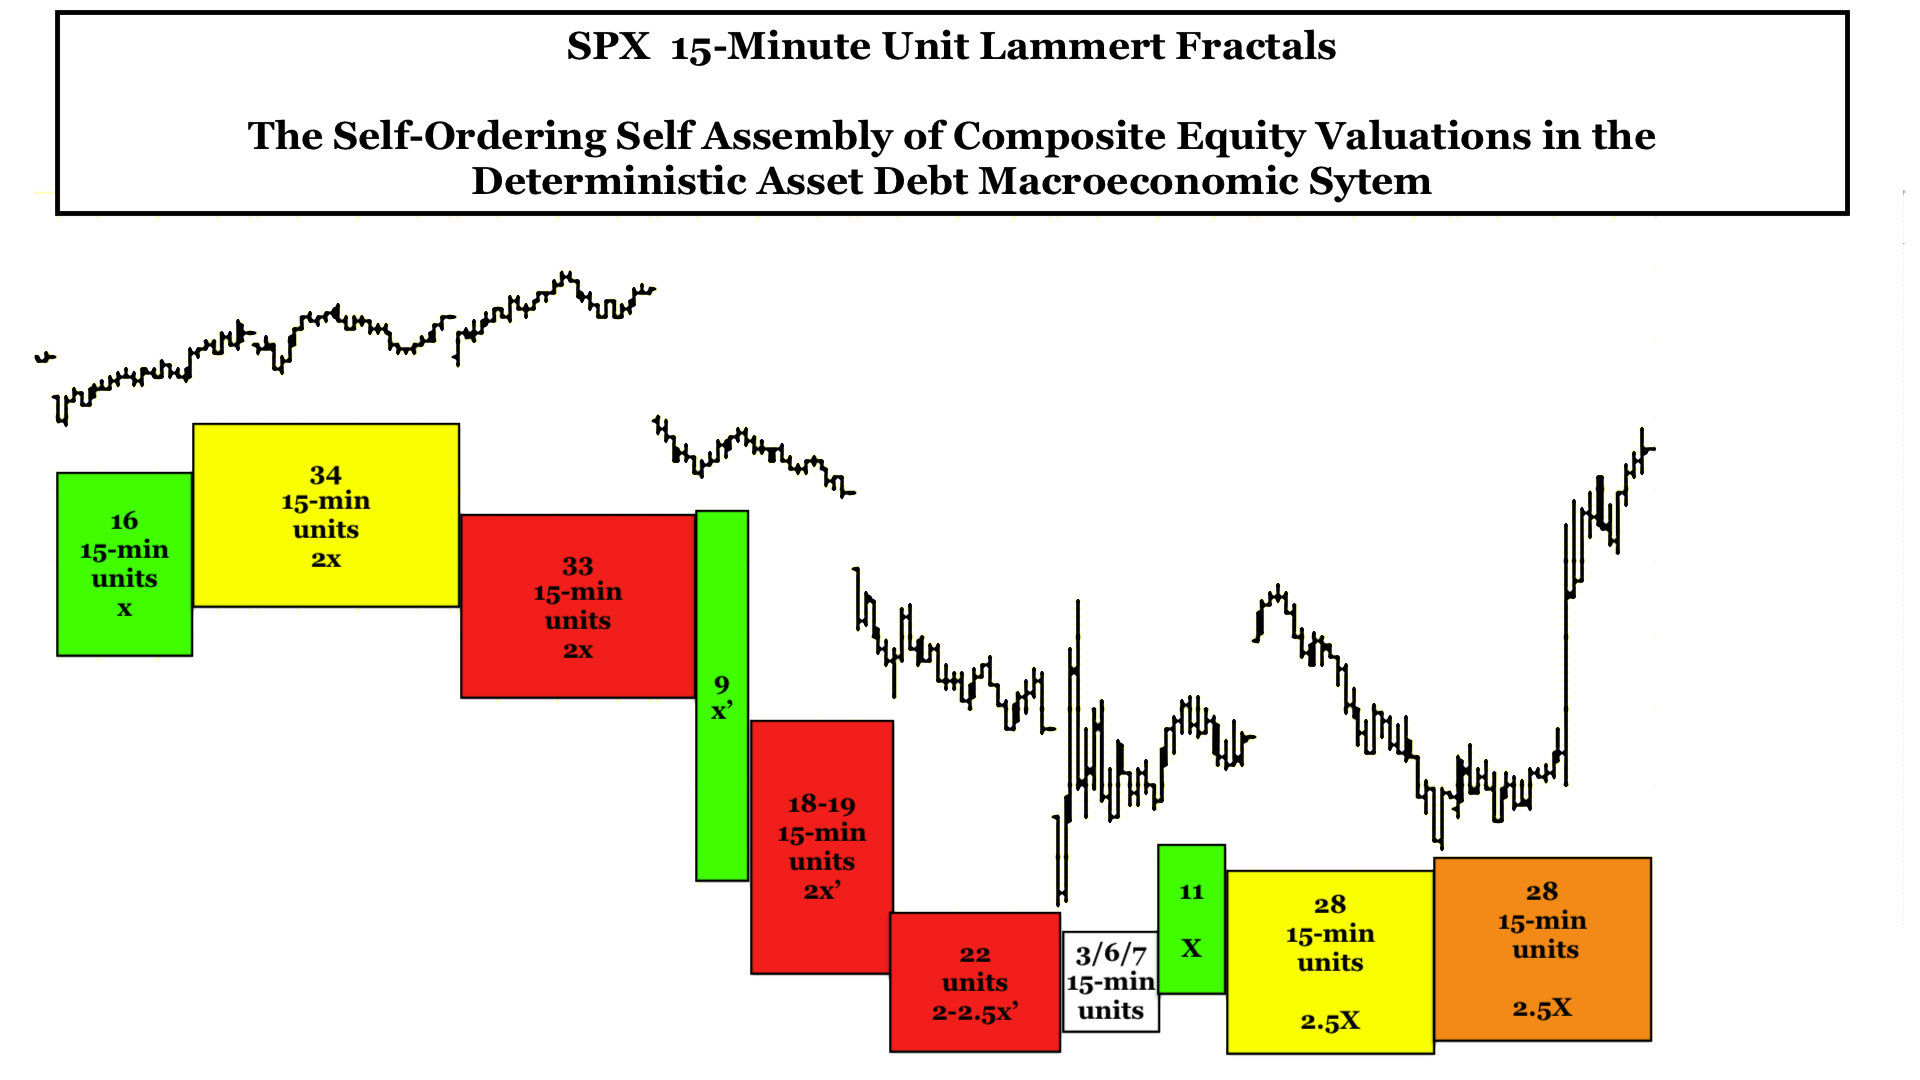
On a 15-minute fractal time basis, the 7 April 2025 3rd fractal 20 day nadir low begins its 12-13 day 4th fractal with a 3/6/7 15-minute unit :: x/2x/2-2.5x fractal growth series, followed by a 11/28/28 15-minute unit :: x/2.5x/2.5x maximal fractal growth series ending at the close on 9 April 2025 and fractally similar to the 27 Oct 2023 55/139/138 day :: x/2.5x/2.5x lower high maximum fractal growth series and the 1807 36/90/90 year :: x/2.5x/2.5x (composite Wilshire) high on 8 November 2021.
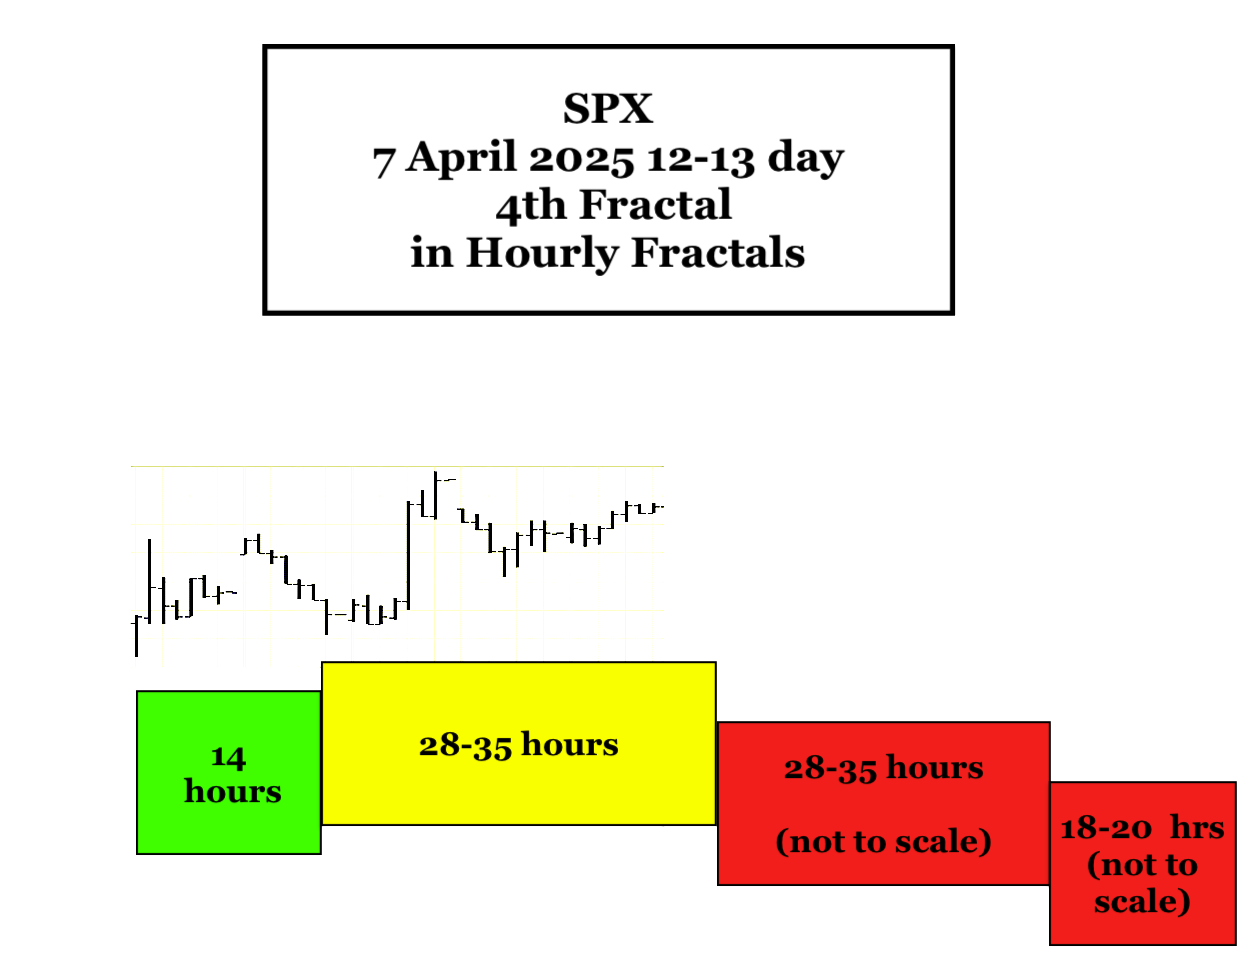
On an hourly unit fractal basis, the 12 to 13 day crash 4th fractal may be composed of a 4-phase terminal growth and crash decay fractal series: 14/22 of 28-35/28-35/18-20 hours :: x/2-2.5x/2-2.5x/1.5x.
The SPX 3 February 2025 8/19/20/12-13 day 4-phase terminal growth and incipient crash decay comes at the terminal portion of a 27 October 2023 55/139/138 lower high valuation growth fractal series with peak valuation on 19 February 2025 the 136 day of the 138 day lower high 3rd fractal. The incipient 1st decay fractal is the summation of the 2nd, 3rd, and 4th fractals or about 50 days. A 50/116-125/116-125/75-78 day 4 phase x/2-2.5x/2-2.5x/1.5-1.6x decay fractal series would placed the 2026 low in about August-September.
A Primer on Quantitative Time-based Fractal Growth and Decay of The Asset-Debt Macroeconomic System’s Composite Equities
Qualitatively …on the longest time-unit cycles (years) (e.g. 1807 36/90/90/54-57 years and 1982 13/32 of 33/32/-33/20 years) credit expands via governmental, corporate, and citizen debt; assets are produced and over-produced , overvalued and over-consumed; consumers reach maximum debt loads; the population of possible traders/invested are fully invested and composite equity asset valuations reach a singular fractal time-unit (minute, hour, day, week, month) peak valuation and thereafter undergo decay; recessions occur with weakening demand, interest rates fall; excess debt undergoes default and restructuring; individual and corporate bankruptcies occur; and composite equity (and commodity) asset valuations eventually reach a singular fractal time-unit nadir. The cycle thereafter repeats itself.
On smaller time-unit fractal cycles (quarters, months, weeks, days, hours, 15-minute/ 5 and 1-minute) : trader/investor population saturation of asset buying occurs ending in a transient peak valuation .. followed by trader/investor population saturation end selling resulting in a transient nadir valuation. These peaks and nadirs occur in one of the two quantitative fractal patterns as above.
Empirically composite equity asset valuation growth and decay cycles occur in 2 modes(laws) of mathematical self-organizing, self-assembly time-based fractal series:
a 4-phase fractal series: x/2-2.5x/2-2.5x/1.5-1.6x and a 3-phase fractal series: x/2-2.5x/1.5-2.5x
In the 4-phase fractal series sequential elements are termed: the 1st, 2nd, 3rd, and 4th fractals and in the 3-phase fractal series: the 1st, 2nd, and 3rd fractals.
The 2nd fractal is characterized by terminal gapped nonlinear lower lows between the 2nd fractal’s terminal 2x and 2.5x time period. (These gapped nonlinear lower lows can be observed in weekly valuation units for the DJIA between 1929 and 1932, the terminal portion of the US 90 year 2nd fractal; within the last three day before the terminal 5 August 2024 139 day 2nd fractal low occurring in the 27 October 2023 55/139/136 day :: x/2.5x/2.5x valuation maximum growth series ending 19 February 2025: and can be expected within last 14-15 months on a daily and weekly basis of the current 32 of 33 year 2nd fractal of the interpolated 1982 13/32 of 33 year 1st and 2nd fractal series.
With the exception of the 3rd fractal in the 4-phase series whose fractal grouping is determined by its terminal high or final lower high peak valuation, fractals (fractal groupings) are determined by the nadirs of the first and last time unit in the grouping with all intervening valuations above the connecting nadir trend-line.
Why does the asset-debt macroeconomic system self-organize to the maximum length x/2.5x/2.5x fractal time-based growth length? It is because equities represent the system’s best available investment with the highest return with superiority over other held assets in terms of possible dividends, valuation growth, tradability, tax-advantaged capital gains, corporate advantaged debt acquisition, and corporate advantaged buy-back legislation.