Lammert Asset Debt Saturation Economics: At the 155 Year US Equity Second Fractal Lower High Valuation Saturation Area: Incipient Quantum Lammert Fractal Decay Merges with Final Quantum Lammert Fractal Growth

The Self Assembly Debt- Asset Macroeconomic System : At the 155 Year Lower High Wilshire Zenith: Decay Begins in Terminal Growth: the Competing and Complimenting 25 July 2012 7/17/14/11 Day Deteriorating Final Four Phase Lammert Growth and Decay Fractal Series and the Complimenting 17 August 2012 6/15/15 day Crash Three Phase Fractal Decay Series

One of the goals of this web site has been to predict the exact daily fractal sequence of the asset debt system’s first nonlinear transitional crash phase of the US Equity 1858 155 year Second Great Fractal.

Proving that the asset debt system is a patterned science may aid those – in a position to legislate necessary really effective  counter balancing and regulatory laws – to understand how much damage is done to the real economy by the facilitation of  bad debt creation. With a wherewithal of the simple quantum mathematical nature and deterministic mechanics of the asset debt macroeconomy It can be understood with certainty that the Financial Industry’s debt creation schemes in the 1920’s and the corporate raiders,  paid for accomplice tax laws, junk bonds, and financial intrinsically fraudulent  innovations of the the Financial Industry from 1980 to 2012 have directly caused the leveraged bad debt that currently exists at this macroeconomic debt-asset dysequilibrium saturation area.

Raw Accumulative Greed does not care about communities or people or real economic value or global economic and therefore global political stability. Greed only cares about raw gains most easily accomplished by facilitating schemes to create  bad debt and the creation of monetary system manipulated wealth – insider wealth undeserved and gamed – but nevertheless equivalent to that – created by real work and service of regular citizens.

From a nationalistic point of view, NAFTA and similar policies promoted by non proAmerican corporate and political elements have eviscerated the American middle class, which has been the cornerstone of the republic.

On a yearly, monthly, daily, 15 minute time fractal basis (e.g. the 10 June 2012 posting regarding the second to third fractal transitional period ), and minutely basis(the 21 August 2012 SPX’s secondary high to its 11 October 2007 nominal high), Lammert Quantitative Fractal Saturation Asset Debt Macroeconomics has proved the asset debt macroeconomic system to be a patterned science.

This is the Asset-Debt economic system’s simple self assembly fractal math:

The Lammert Ideal Four Phase Growth and Decay Fractal sequence: x/2-2.5x/2x/1.5-1.6x

The Lammert Ideal Fractal Decay Sequence : y/2-2.5y/2-2.5y

While 24 July was the absolute low for the Wilshire, the integrative average low was on 25 July 2012. A 7 day base fractal occurred from 25 July to 2 August. This can be observed for the CAC.
The final lower high for the Wilshire (and the system’s secondary high to 11 October 2007 for the SPX) occurred on 21 August 2012 or 2x the 14th day of the 7/14 day sequence.

As was the evolution for the SPX on 11 October 2007 5 years earlier, the SPX’s secondary high  on 21 August had a minutely gap near the opening of the trading day to its new secondary high and ended on the low of the day.

The expected 25 July 2012 deteriorating four phase Lammert growth and decay fractal is 7/17/14/10-11 days.

The asset-debt macroeconomy is an integrative mathematical system. Just as growth begins in terminal decay, initial valuation decay begins near the terminal valuation saturation growth area.

17 August 2012 occurred in the terminal portion of the 17 day second fractal of 25 July’s 7/17 day :: x/2.5x sequence.

A 6 day base is formed from 17 August to 24 August with an expected 6/15/15 day decay sequence. The system nonlinear crash will ideally occur within the last 15 day 3rd fractal sequence of the 6/15/15 day Lammert decay fractal series and on days 10 and 11 of the 4th fractal of the deteriorating 7/17/14/10-11 day sequence.
1929: Lammert Asset Debt Saturation Economics: 1929 and 2012: The US Equity 155 year Second Fractal’s Two Subfractals’ Final Equity Apogees and Nonlinear Crashes of the US 1788-1858 First Fractal

http://www.youtube.com/watch?v=Fp1CttLLR0k&feature=player_detailpage

2012 will be different in the degree of initial nonlinearity.

The 6 May 2010 flash crash was a recent example of Lammert second fractal debt-asset self assembly terminal 2-2.5x nonlinearity as described in the the main page of TEF.

2012’s  Second Fractal nonlinearity will be at the end of a 155 year US equity class second fractal.

….  A sudden nonlinear drop in the last 0.5x time period of the 2.5X is the hallmark of a second cycle and characterizes this most recognizable cycle. After the nonlinear gap drop, the third cycle begins. This means that the second cycle can last anywhere in length from 2x to 2.5x.

 G. Lammert

 This page was last updated on 15-May-2005 01:21:59 PM .


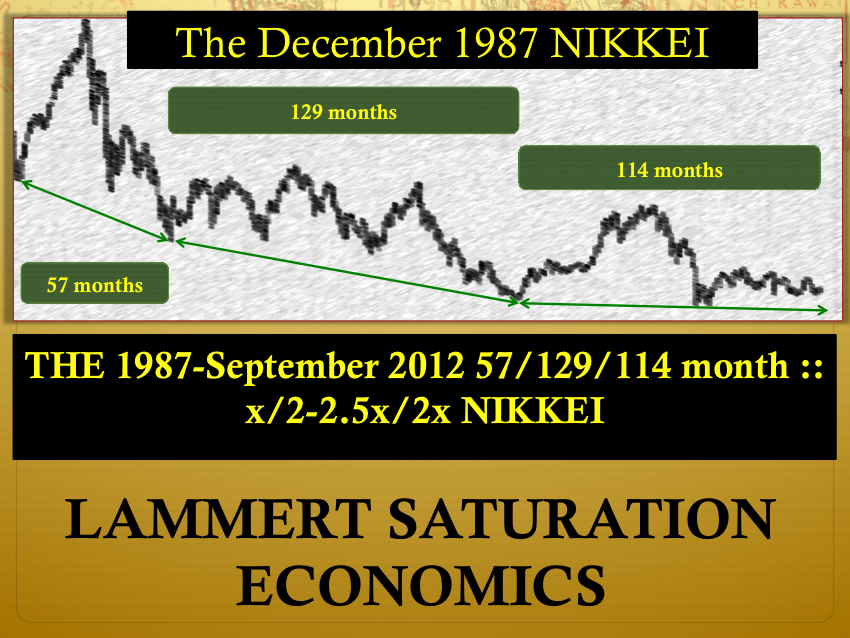
A 2003 Prediction: a Historical Equity Devaluation in September 2012: The Nikkei 1987: 57/129/114 month Growth Fractal :: x/2-2.5x/2x ?

Welcome to the small alcove for the advancement of cause and effect saturation macroeconomics. This site pursues the hypothesis that the nature of market valuations and economic cycles is both causal and quantitatively decipherable. Valuations confirm to fractal cyclical patterns that can be recognized, interpreted in conjunction with data emanating from the macroeconomic system, and used with short term and long-term predicative power. Information from this site is not intended to be construed as investment advice or as an investment tool. This site has been constructed because of the expected inevitability of a major sudden phase transition to occur at the conclusion of a grand 140 plus-year second fractal cycle starting in 1858. For the masses this phase transition will occur both very unexpectedly and very suddenly. Approaching the global macro economy from such a causal and fractal Weltanschauung may help those considering further debt obligation and those in position of formulating future interest rate and monetary policy.

The cyclical nature of the macroeconomic system operates by causality rather than chance. Valuations of assets are controlled chiefly by interest rates – the cost of money. Lowering nominal interest rates, below asset inflation controlling rates, leads to macro economical disequilibria with excessive money expansion through increased borrowing. This expansion engenders unbalanced forward consumption, consumer saturation, overproduction, and inflation of assets and consumer items. With the addition of ongoing wages of the consumer masses, these oppositional elements are countervailing, and periodic macroeconomic imbalances will self correct.    

Market overvaluation saturation and decay corrections to new lower saturation points occur in a fractal manner. Cyclical patterns can readily be identified on valuation charts denominated in minutely, hourly, daily, weekly, monthly, and yearly units. The transitional asymptote of overvaluation saturation curves are followed by decay curves which bring market valuations to lowered levels where intelligent buyers reenter the market.    

Human psychology is a decidedly lagging indicator and follows as an end effect of the mechanistic saturation and decay evolutions in the market. Market contrarians understand these turning points and anticipate the directional changes of the markets based both on market asymptotic overvaluation saturation areas or decay end-point saturation characteristics and counter intuitively by recognizing the lagging psychological parameters of extreme optimism or pessimism in reaction to the mechanistic respective high and low points.    

Both the degree of valuation and the cyclical time course of valuation evolutions appear to conform to range bound near quantum-like units and quantum related Fibonacci numbers. While the absolute degree of valuation is influenced by the absolute interest rate, the percentage or proportionality changes of valuations from highs to lows and lengths of time to decay and intra-cycle nodal points appear to conform to these range bound near quantum units.    

The ideal growth fractal time sequence is X, 2.5X, 2X and 1.5-1.6X. The first two cycles include a saturation transitional point and decay process in the terminal portion of the cycles. A sudden nonlinear drop in the last 0.5x time period of the 2.5X is the hallmark of a second cycle and characterizes this most recognizable cycle. After the nonlinear gap drop, the third cycle begins. This means that the second cycle can last anywhere in length from 2x to 2.5x. The third cycle 2X is primarily a growth cycle with a lower saturation point and decay process followed by a higher saturation point. The last 1.5-1.6X cycle is primarily a decay cycle interrupted with a mid area growth period. Near ideal fractal cycles can be seen in the trading valuations of many commodities and individual stocks. Most of the cycles are caricatures of the ideal and conform to Gompertz mathematical type saturation and decay curves.  

 G. Lammert

This page was last updated on 15-May-2005 01:21:59 PM .

Non-Stochastic Saturation Macroeconomics