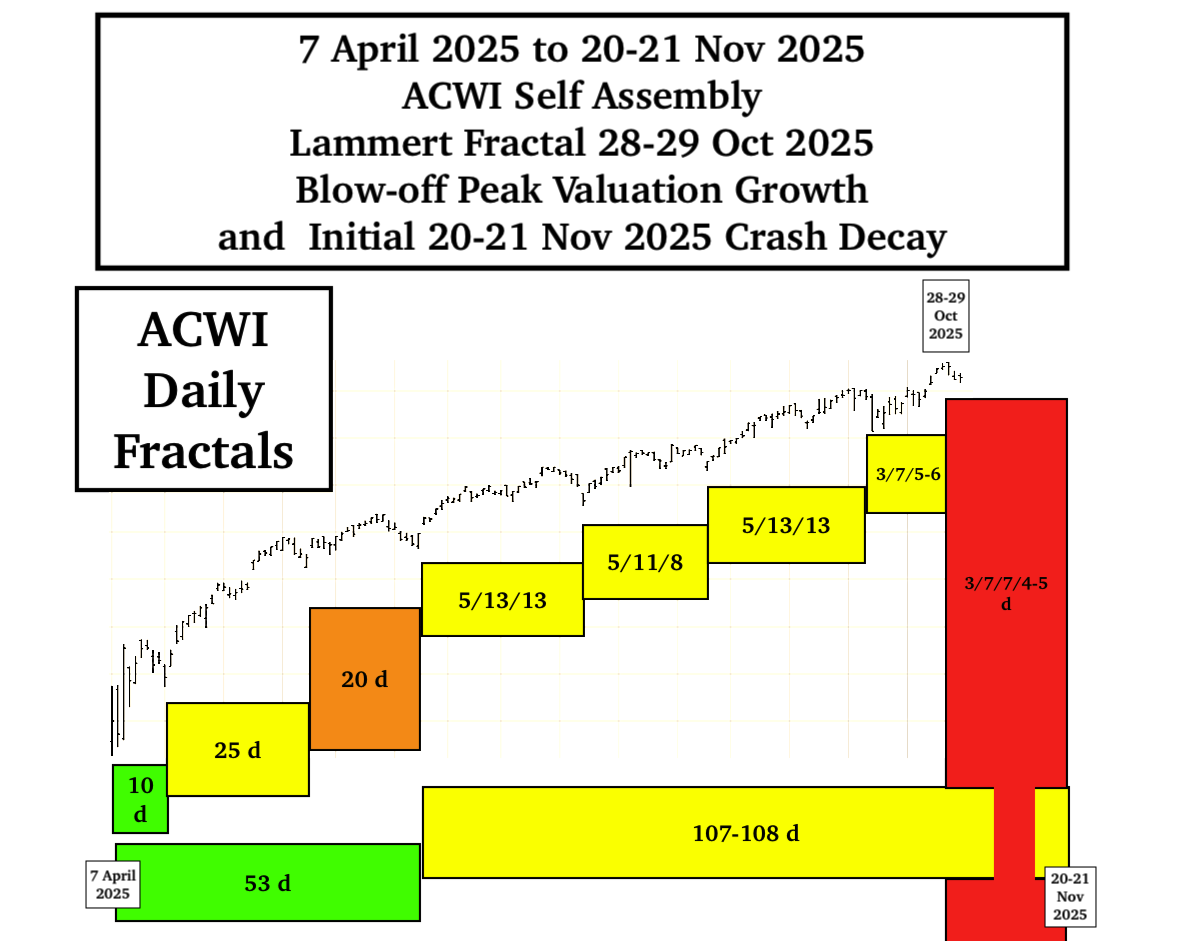
The Current 1929-like 4-phase Lammert Fractal Decay Model with a Transient Nadir Ending 31 December 2025 (see red blocks above)
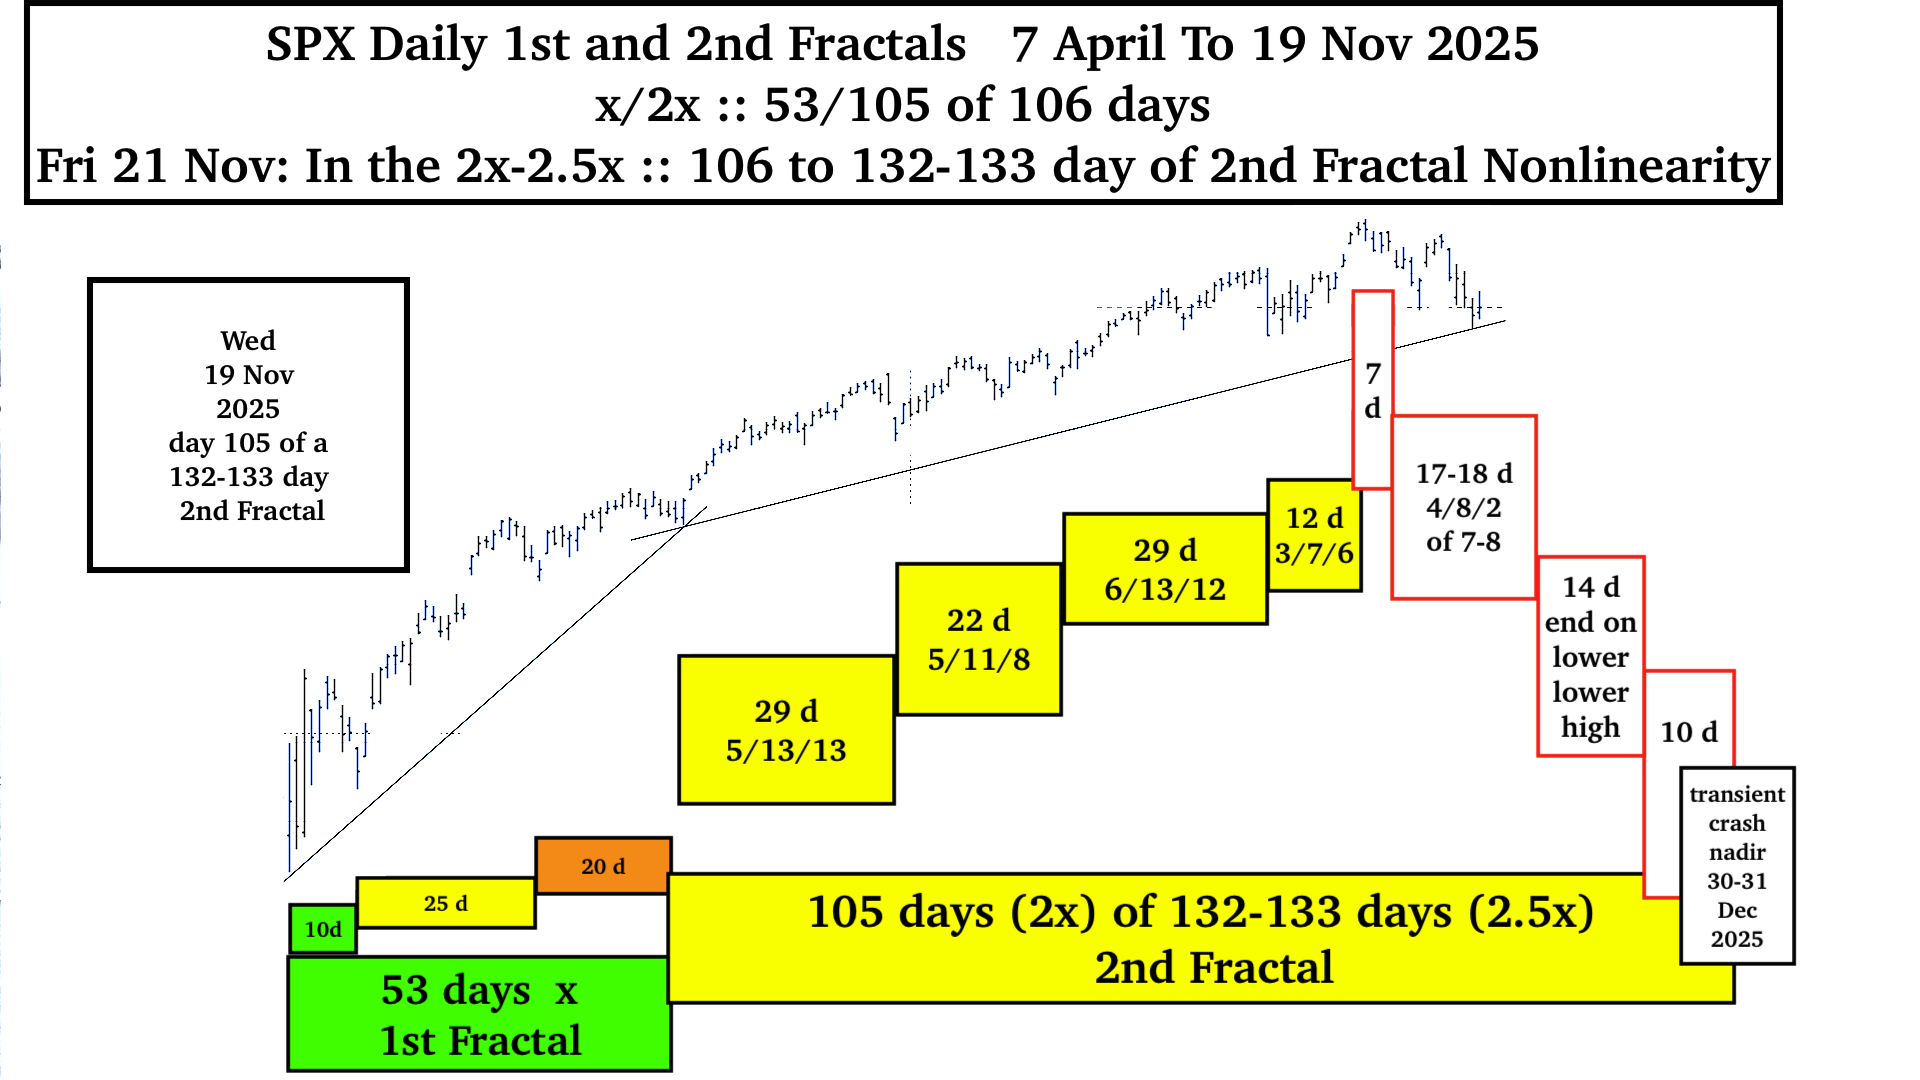
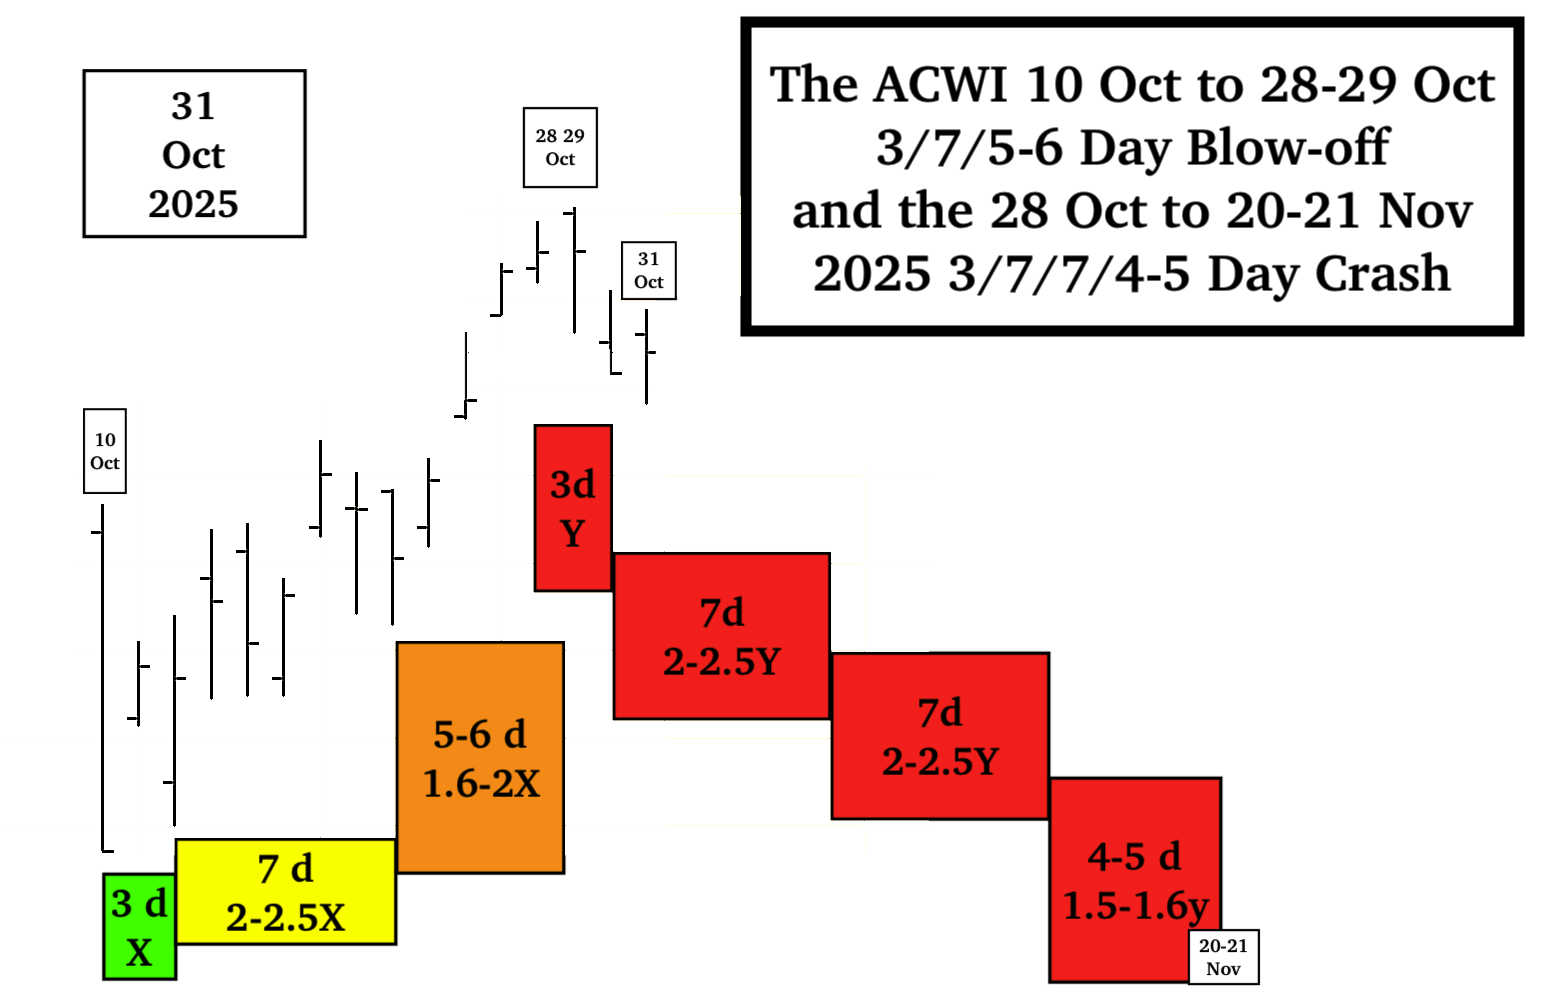
Within the 7 April 2025 to 31 December 2025 53/132-133 day :: x/2.5x 1st and 2nd Fractal Series rest the two average high valuation days and the intraday SPX/ACWI peak valuation on days on 28 and 29 Oct, and 29 Oct respectively …
The potential interpolated 27 October 7/17-18/14/10 day 4 phase Lammert crash decay fractal series would be very similar to the 30 Aug 1929 to 13 Nov 8/19/16/12 day 4 phase fractal decay crash series with 2025 lows on day 7 day of the first fractal, day 17-18 of the 2nd fractal and day 10 of the 4th fractal and a lower lower final high on day 14 of the 3rd fractal. The fractal annotation to show a deteriorating 4 phase decay series would be y/2-2.5y/2xy/1.5y, where y =xy in unit time length and the 2xy of the 3rd fractal represents lower lower high growth. For 1929 the respective lows occurred on day 8, day 19, and day 12 of the respective 1st, 2nd, and 4th fractals and a lower lower high on day 16 of the 3rd fractal.
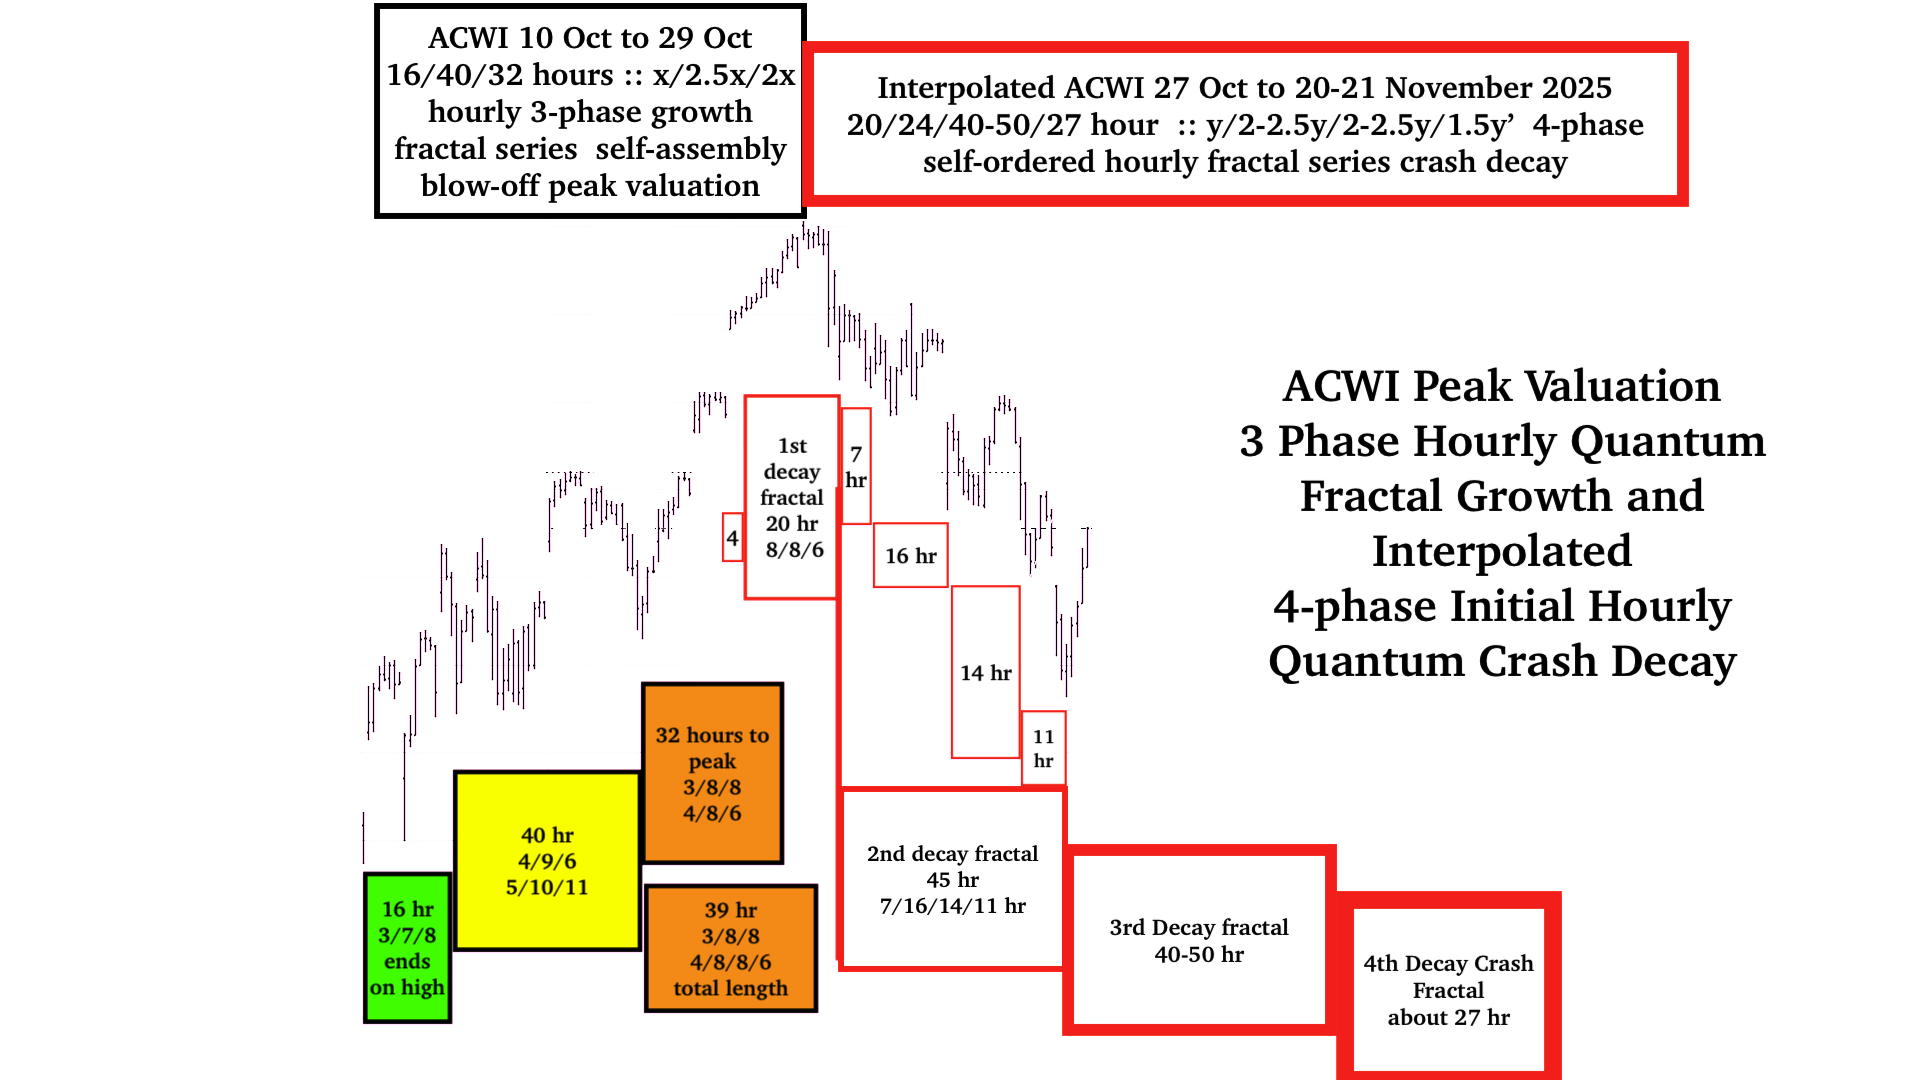
It appears that the 4-phase y/2.5y/2-2.5y/1.5 -1.6 y hourly crash decay fractal series began at 1130AM EST 27 Oct 2025.
The 4-phase hourly crash fractal series begins self assembly within final 3rd fractal 2x portion of the final 10 October 330 PM 16/40/39 hour :: x/2.5x/2-2.5x blow off fractal series with a ACWI peak valuation on hour 32 (2x) at 930AM EST 29 October of the 39 hour 3rd fractal.
The 39 hour 3rd fractal are composed of two series: a 3-phase 3/8/8 hour :: x/2.5x/2.5x series and a (4)/8/8/6 hour series :: x/2x/2x/1.5x 4 phase series. The 32 hour peak valuation self-ordered on the 6th hour of a 4/8/6 hour :: x/2x/1.5x series after the initial 3/8/8/ hour series.
The 4-phase crash fractal series starts with the 2nd 8 hour fractal of the (4)/8/8/6 hour fractal series and includes the 8 hour 3rd fractal and the 6 hour 4th fractal for total of 20 hours and ends 930AM EST 30 October. The 2nd decay fractal starts at that time and follows a self ordering 7/16/14/11 hours :: y/2-2.5y/2y/1.5y 4 phase decay series or 45 hours and appears to end on1030 AM EST on 7 November. The 3rd decay would be 40-50 hours (2x-2.5x) in length and the final 4th fractal likely 27 hours or 1.5 x’ in length with x’ of the 45 hour 2nd fractal 18 hours and 1.5x’ that ideal base placing the crash Nadir on 20/21 Nov dependent on length of the 3rd 40-50 hour fractal.
The final 3-phase 330PM EST 10 Oct 2025 16/40/32 hour :: x/2.5x/2x to peak valuation is consistent with self-ordering 3 phase fractal growth and the 20/45/20-50/27 hour fractal crash decay series :: y/2-2.5y/2-2.5y/1.5y’ conforms to the 4 phase fractal pattern described in the initial posting of the May 2005 main page of the Economic Fractalist.
A final 2026 low is expected preceding the US midterms by a month or so.
Observationally, on the largest time scales, the global Asset-Debt Macroeconomic System has composite asset peak valuations and accompanying maximal debt loads/credit expansion and, alternatively, asset nadir valuations with bad debt liquidation/credit contraction and accompanying accelerating recessional economic activity.
Are there internal self organizing ADM System time-based fractal patterns that govern this cyclical growth and decay composite asset valuation peak to composite asset valuation nadir evolution?
It appears so.
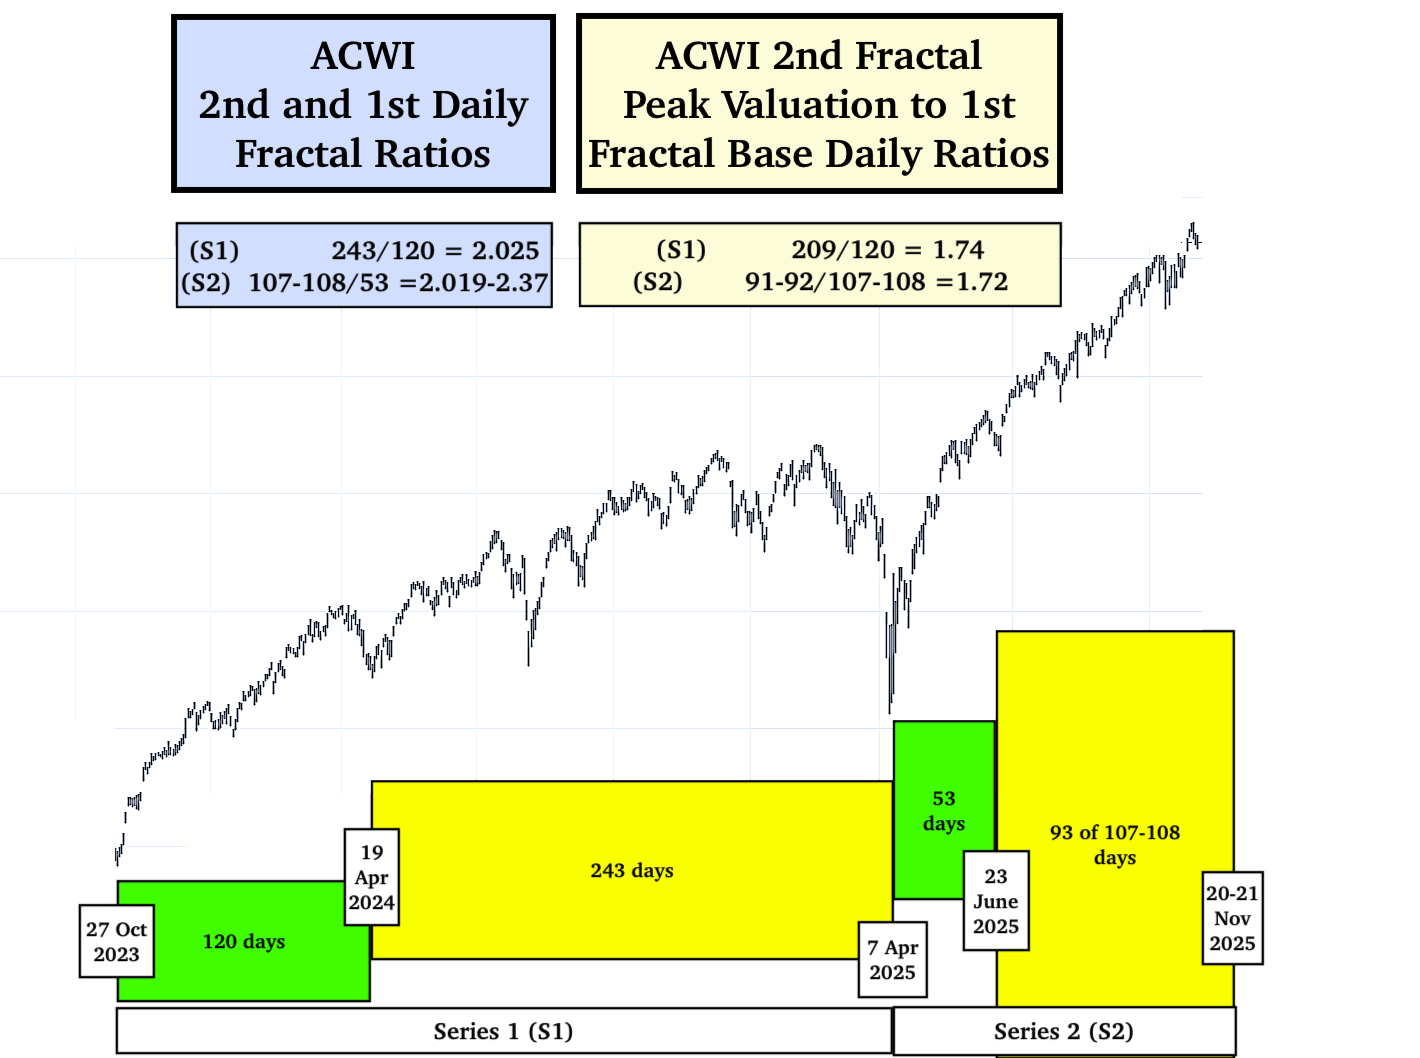
Current Fractal Model:
Below. The ratio of the 90/91 day second fractal peak valuation to the 7 April 2025 53 day first fractal base and the ratio of the length of the 107-108 day second fractal to the 53 day first fractal closely match the preceding 27 Oct 2023 similar ratios.
A Primer on Quantitative Time-based Self-Assembly Lammert Fractal Growth and Decay of Valuations of The Asset-Debt Macroeconomic System’s Composite Equities
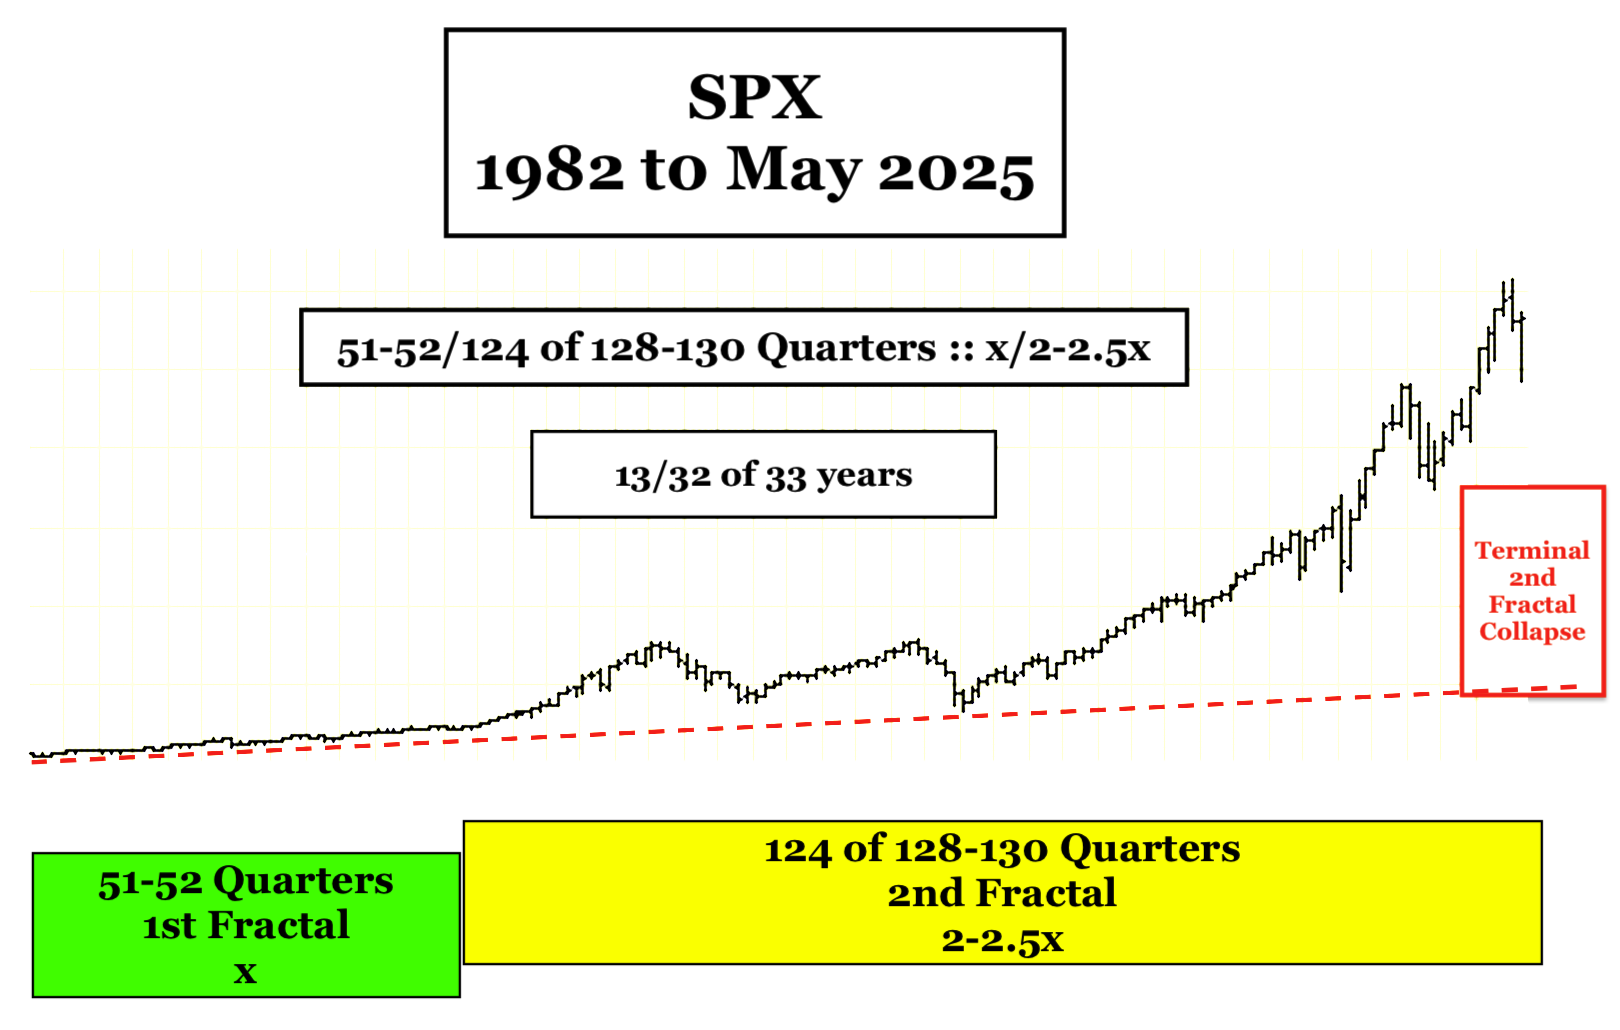
Qualitatively …on the longest time-unit cycles (years) (e.g. 1807 36/90/90/54-57 years :: x/2.5x/2.5x/1.5-1.6x and 1982 13/32 of 33/32-33/20 years x/2.5x/2.5x/1.5-1.6x credit expands via governmental, corporate, and citizen debt; assets are produced and over-produced , overvalued and over-consumed; consumers reach maximum debt loads; the population of possible traders/invested are fully invested and composite equity asset valuations reach a singular fractal time-unit (minute, hour, day, week, month) peak valuation and thereafter undergo decay; recessions occur with weakening demand, interest rates fall; excess debt undergoes default and restructuring; individual and corporate bankruptcies occur; and composite equity (and commodity) asset valuations eventually reach a singular fractal time-unit nadir. The cycle thereafter repeats itself.
On smaller time-unit fractal cycles (quarters, months, weeks, days, hours, 15-minute/ 5 and 1-minute) : trader/investor population saturation of asset buying occurs ending in a transient peak valuation .. followed by trader/investor population saturation end selling resulting in a transient nadir valuation. These peaks and nadirs occur in one of the two quantitative fractal patterns as above.
Empirically composite equity asset valuation growth and decay cycles occur in 2 modes(laws) of mathematical self-organizing, self-assembly time-based fractal series:
a 4-phase fractal series: x/2-2.5x/2-2.5x/1.5-1.6x and a 3-phase fractal series: x/2-2.5x/1.5-2.5x
In the 4-phase fractal series sequential elements are termed: the 1st, 2nd, 3rd, and 4th fractals and in the 3-phase fractal series: the 1st, 2nd, and 3rd fractals.
In the 4-phase fractal series sequential elements are termed: the 1st, 2nd, 3rd, and 4th fractals and in the 3-phase fractal series: the 1st, 2nd, and 3rd fractals.
The 2nd fractal is characterized by terminal gapped nonlinear lower lows between the 2nd fractal’s terminal 2x and 2.5x time period. (These gapped nonlinear lower lows can be observed in weekly valuation units for the DJIA between 1929 and 1932, the terminal portion of the US 90 year 2nd fractal; within the last three day before the terminal 5 August 2024 139 day 2nd fractal low occurring in an interpolated ACWI/SPX 27 October 2023 55/139/135-136 day (SPX-ACWI respectively) :: x/2.5x/2.5x valuation maximum growth series ending on 18/19 February 2025: and can be expected within the last months on a daily and weekly basis of the current 32 of 33 year 2nd fractal of the interpolated 1982 13/32 of 33 year 1st and 2nd fractal series. (The 27 October 2023 dominant fractal series now appears to have a 120 day first fractal base with a 243 day 2nd fractal ending 7 April 2025, whereas the 55/139/136 day 3 phase growth series was a secondary interpolated fractal series).
With the exception of the 3rd fractal in the 4-phase series whose fractal grouping is determined by its terminal high or final lower high peak valuation, fractals (fractal groupings) are determined by the nadirs of the first and last time unit in the grouping with all intervening valuations above the connecting nadir trend-line.
SPX Quarterly 1982 to May 2025 1st and 2nd Fractals: