As Deutsche Bank goes, so goes Global Equity indices and the CRB.
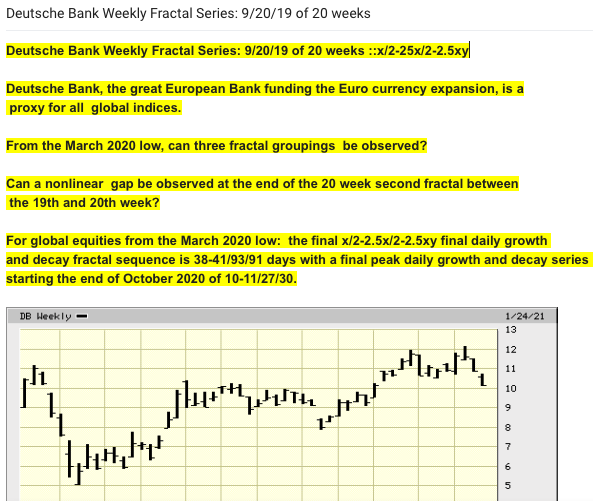
As Deutsche Bank goes, so goes Global Equity indices and the CRB.
The 1877 US Hegemonic 145 Year Global Second Fractal Collapse.
It is goal of this website to recognize that the asset debt macroeconomic system is a deterministic and patterned science.
Commodity, Crypto Currency, and Equity Asset valuations grow to maximum saturation valuations depleting the buyer population and thereafter fall to minimum valuation levels depleting the selling population.
The growth and decay of these asset valuations to maximum high and low valuation are dependent upon prevailing interest rates.
US interest rates since 1982, the start of the 1932 second subfractal series and composed of 9/20/13 year (x/2-2.5x/1.5x) concluding fractal series have progressively fallen with steadily higher valuations of asset classes, but with easily observable intermittent falls in valuations.
With a growing US national and international sovereign debt and growing social contract obligations, lower and lower interest rates are, perforce, needed to sustain the system, which cannot repay the debt load.
The rise and fall in the valuations of asset classes including debt to maximum highs and lows are deterministic and are self-organizing into regular hourly, daily, weekly, monthly, and yearly fractal patterns.
This regular patterned periodicity in simple well-defined mathematical fractals confers on the asset-debt macroeconomic system the properties of a science.
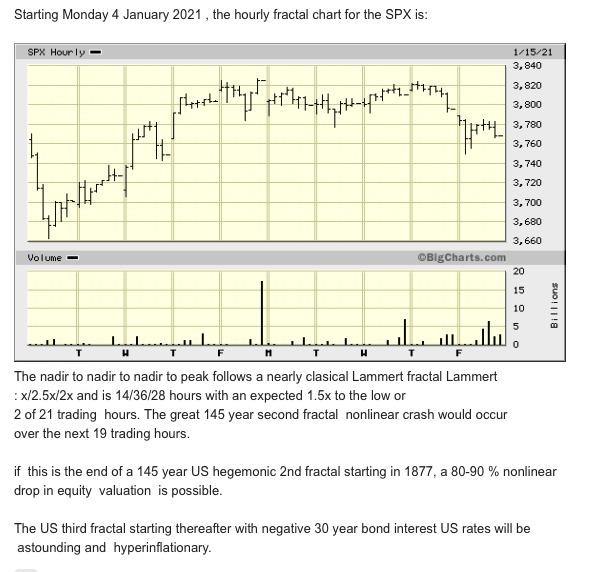
The 145 year US hegemonic second fractal starting in 1877 with a base of 71 years which started in 1807 is expected to end with a spectacular nonlinear collapse in valuations of commodity, cryptocurrency, and equity valuations.
All sovereign equity indices’s valuations are linked to each other via the existing sovereign, corporate, and individual debt interest rate parameters and debt load.
For Bitcoin represented by GBTC the final fractal progression is:
x/2.5x/2.5x/1.5x or 11/28/28/16 days. The valuation of bitcoin will be less than 5000 dollars in 5 to 6 trading days. A nonlinear drop is clearly observable between day 27 and day 28 of the second fractal.
For global equity indices, the French CAC index, starting from the low at the end of October 2020 to its peak valuation, provides a representative example of classical Lammert fractal self assembly to normal maximum (2x vice 2.5x third fractal )growth:
x/2.5x/2x :: 11/27/22 days.
Notice the obvious nonlinear drop between the 26th and 27th dayof the 27 day second fractal (as described as the hallmark of the terminal portion of second fractals in the 2005 main page of this web site).
The growth to peak valuation will be transformed into a x/2.5x/2.5xy combined growth and decay fractal collapse. Expected from the end of the October 2020 low valuation is a 11/27/28 days fractal. With 9 trading hours defining a trading day for the French CAC; the final hourly nonlinear collapse fractal series starting on 15 January 2021 is predicted to be 19/38/38 hours .
Again it is goal of this website to recognize that the asset debt system is deterministic and a patterned science.
Growth of asset valuation in the follow-on 2021 US-Euro-Asian 100 plus year Third Fractal starting 2021 will be determined by negative US and European sovereign long term bond interest rates. The hyperinflation caused by these negative interest rates will result in hyper inflationary growth of all asset class valuations. Those entities and individuals with first access to money and debt will be disproportionally advantaged in this Third Fractal progression.
This asset hyper-valuation progression (and periodic decay) will also occur in the simple deterministic patterned mathematical fractal manner that represents the science of the asset-debt macroeconomic system.