US March 2020 to March 2024 Unprecedented QE followed by Unprecedented QT
In early 2020 at the beginning and during the more lethal covid variant phases, the Central Bank and governmental response of unprecedented QE/low interest rate/MBS/money creation and distribution resulted in historical price inflation and misallocation of bank lending for speculative enterprises. The central bank then pivoted to an unprecedented acceleration of QT, shearing bond holders and causing Silicon Valley, Signature, First Republic and Heartland bank failures in 2023. These banks had the double whammy of both providing unperforming ‘speculative loans’ combined with paper losses on federal securities. In 2023 the Federal Reserve initiated the BTF program which injected liquidity and propped up banks owning US debt instruments which suffered paper losses. The termination of this QE program on 12 March 2024, will have an additional QT effect on bank lending.
American consumers, which had acquired 2.5 trillion in savings during the paychecks from the last part of the Trump administration and the first part of the Biden administration have depleted that savings in Jan 2024.
China, the World’s Second Greatest Economy
For China, the second largest economy, citizen speculative malinvestment in real estate with an overproduction of 2 times the amount of units needed combined with a grossly inadequate replacement younger population has placed a double whammy on citizen consumption and ongoing construction which had been about 7 percent of China’s GDP. Chinese construction giant Evergrande is undergoing bankruptcy proceedings and corporate giant Country Garden has lost 95% of its stock value over the last three years.
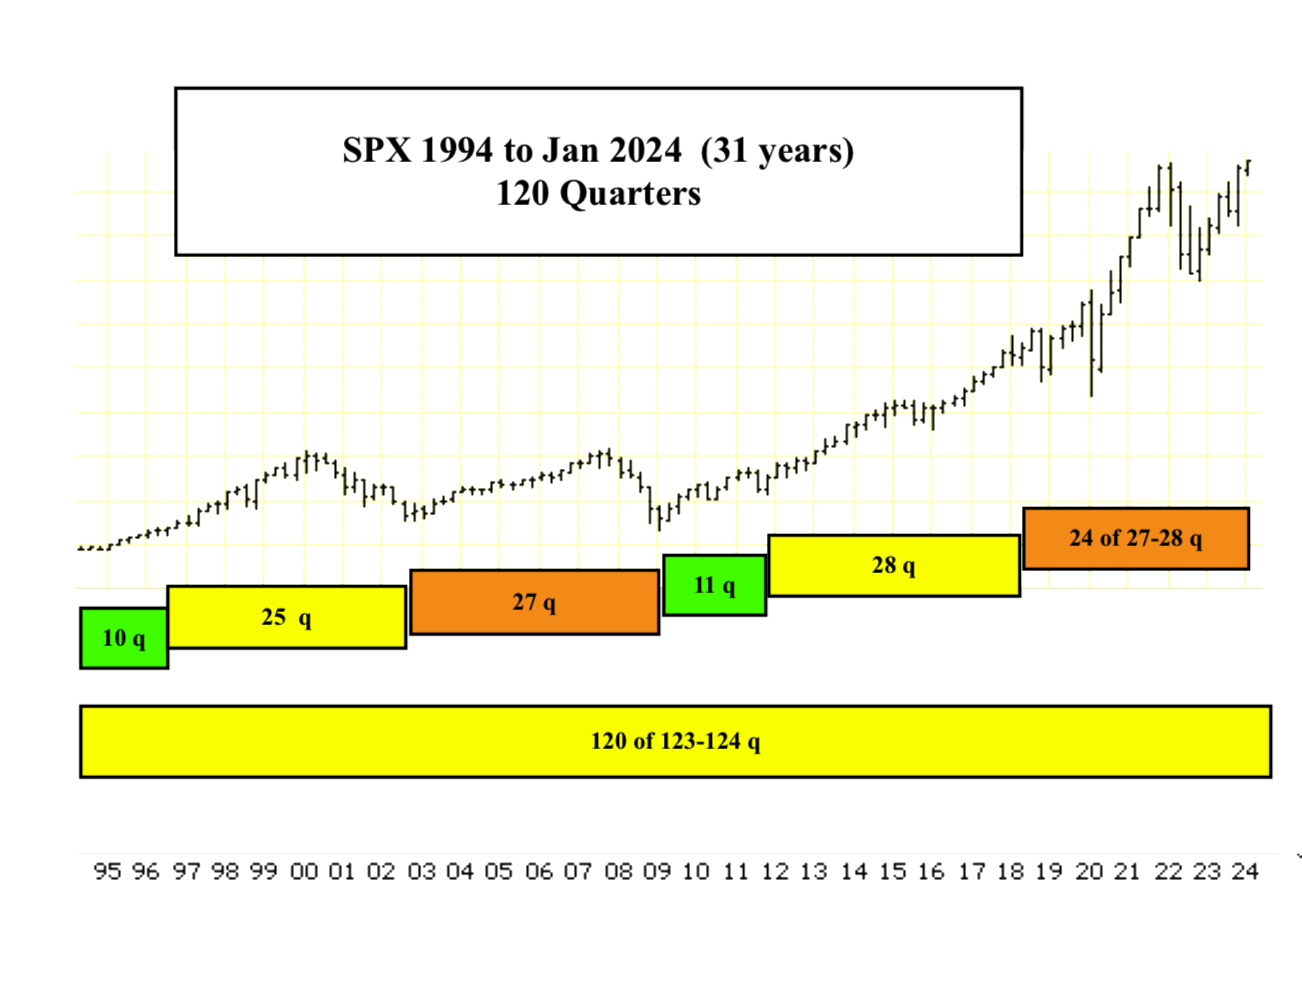
It is the hypothesis of this website that composite equity valuations, even under the most radical of central bank and governmental manipulative conditions of QE and Q, grow and decay in a deterministic very simple time-based fractal-patterned manner following the most efficient mathematical self- assembly process possible.
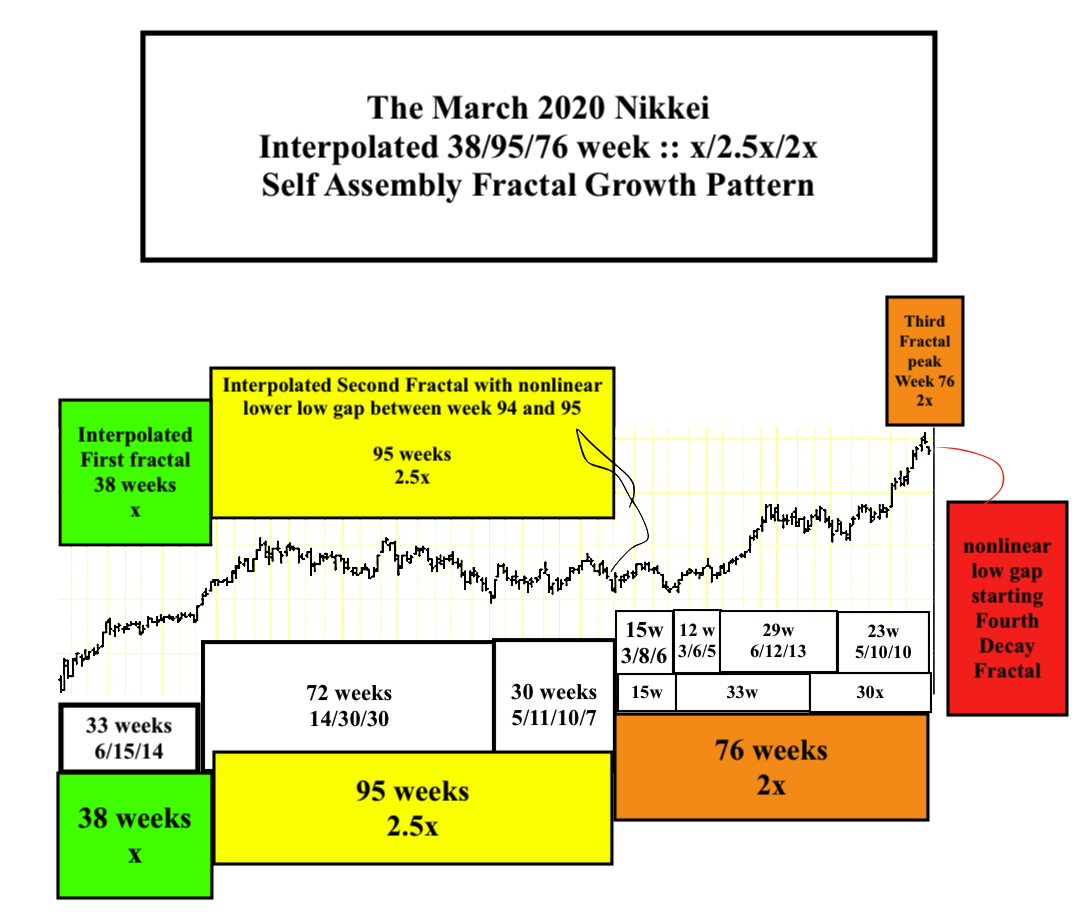
The March 2020 NIKKEI 38/95/76 Week :: x/2.5x/2x Peak Valuation Fractal Growth Pattern(with an expected nadir in about 1.5x or 54-57 weeks)
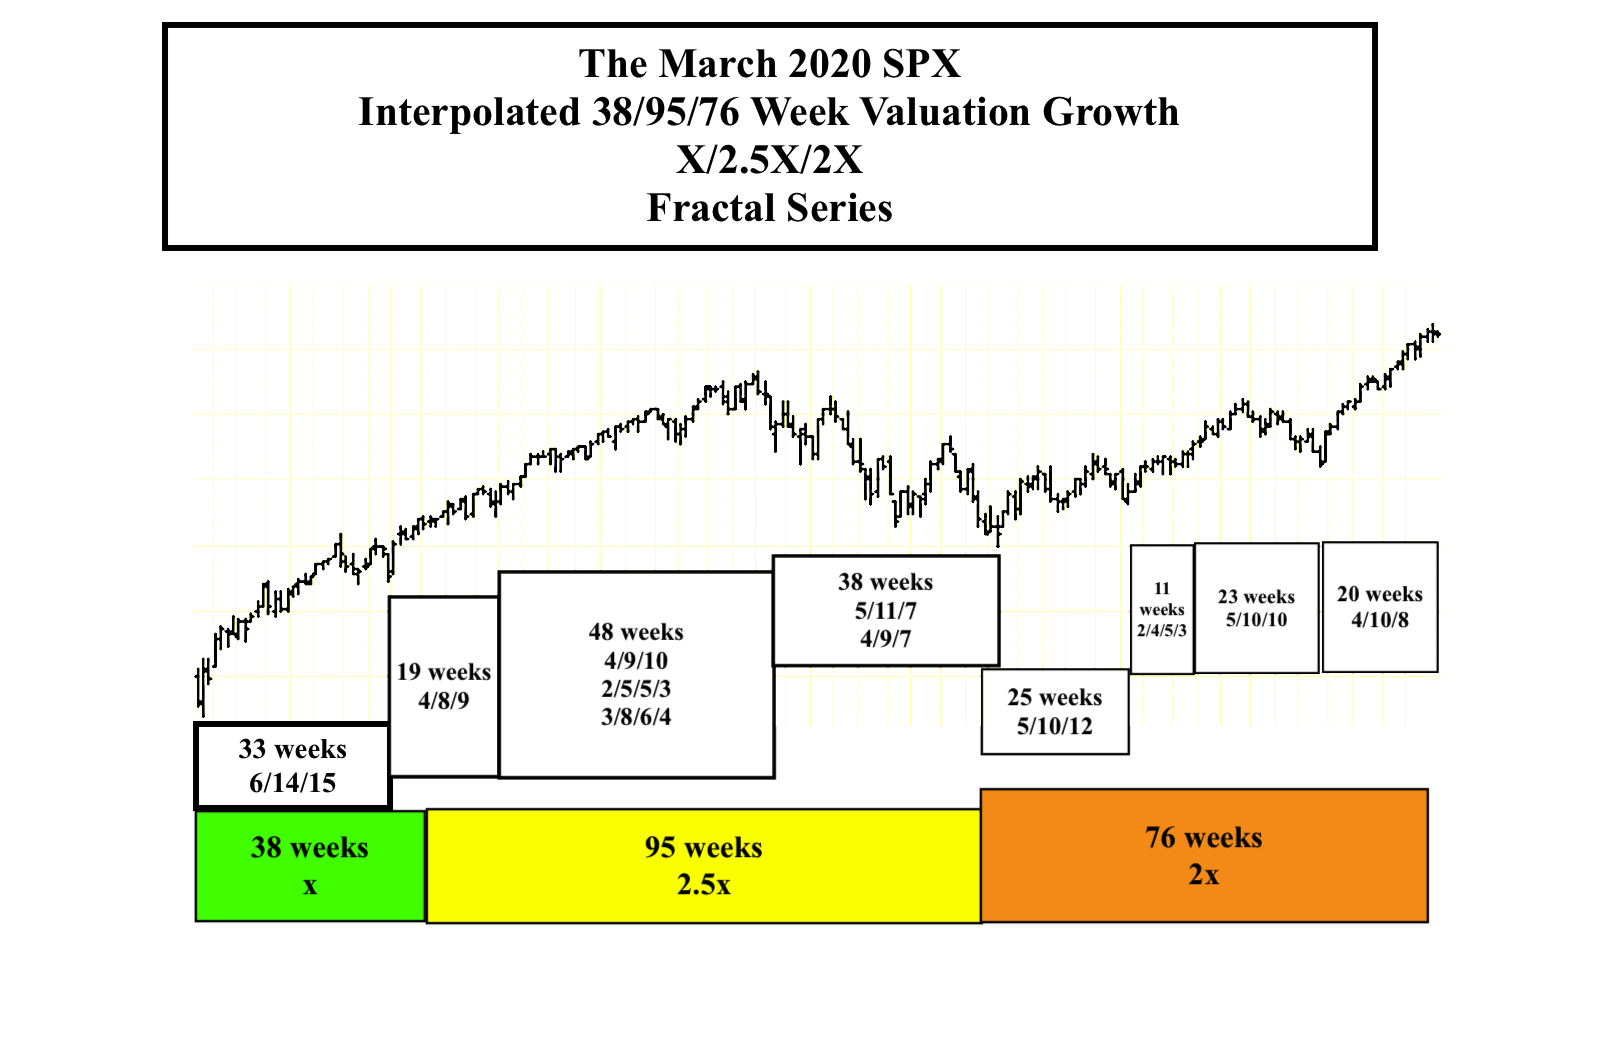
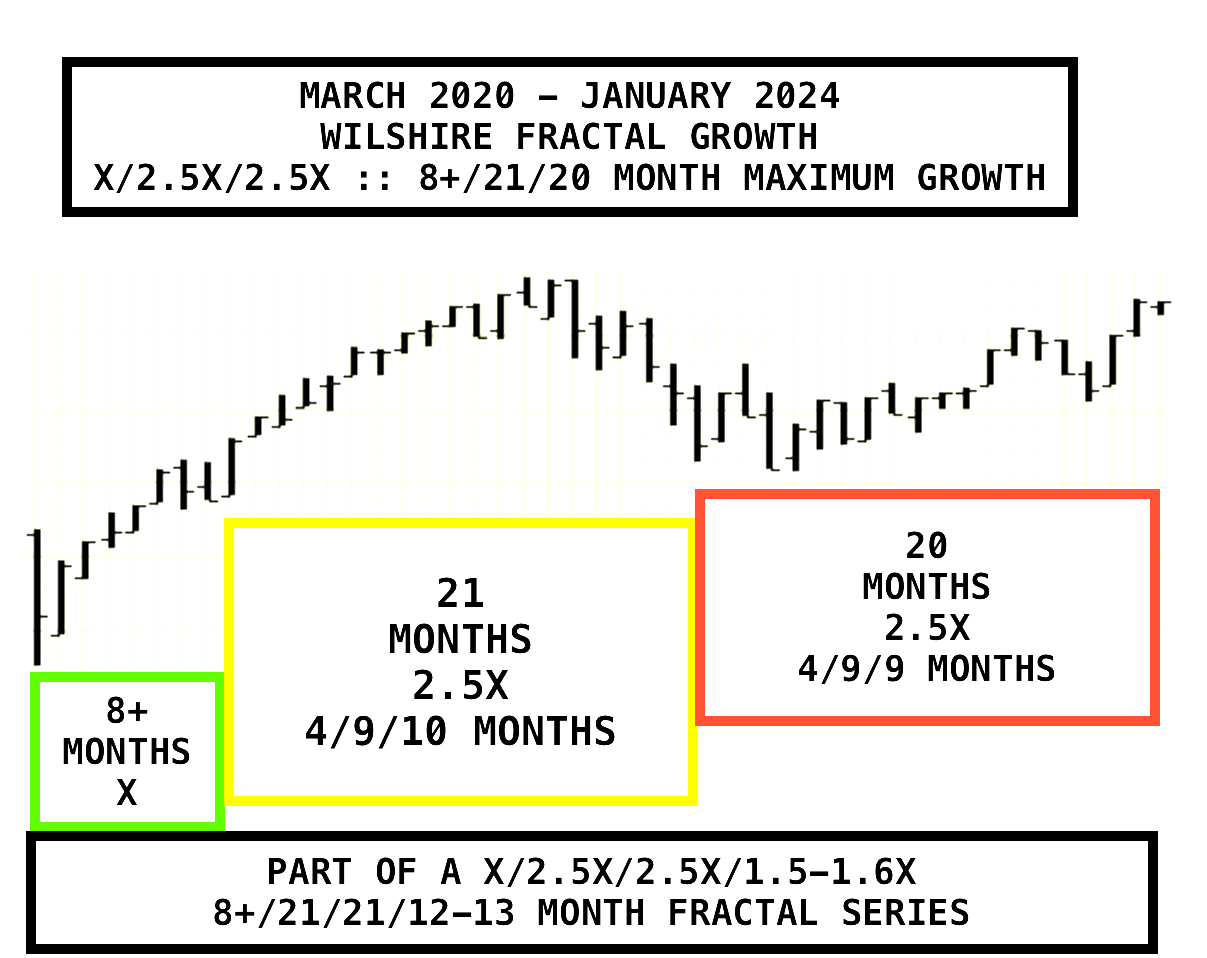
The March 2020 Interpolated SPX 38/95/76 Week :: x/2.5x/2x Peak Valuation Fractal Growth Pattern(with an expected nadir in about 1.5x or 54-57 weeks)