All posts by Gary Lammert

A US 1929-Like Collapse for 2023 Chinese Equity Market With a Much Shorter Peak to Nadir Valuation Decay Time Length Duration Than The US’s Sept 1929 to June 1932 Peak to Nadir.

There are only two elegantly simple laws of time-based  fractal asset-debt macroeconomics: 

While money and credit growth (and contraction)by central banks and government spending is periodically irregular, equity and commodity composite valuations grow and decay by only two distinct  time-based fractal patterns(mathematical laws): a three phase pattern: composed of three subfractals:1/2/ and 3  ::  x/2-2.5x/1.5-2.5x where x is the base first fractal time length in days, weeks, months, and years.

and a four phase pattern: composed of 4 subfractals: 1/2/3/ and 4  :: x/2-2.5x/2-2.5x/1.5-1.6x, where x is the base first fractal time length in days, weeks, months, and years.  

The time length of subfractal 2 (2-2.5x) of the 3 and 4 phase fractal series often determines the ideal time length of subfractal 1 : (x’) upon which the lengths of sub-fractals 3 and 4 are based: e.g., the 4 phase  fractal pattern’s time lengths become x/(2-2.5x divided by 2.5 = x’)/2-2.5x’/1.5-1.6x’.

China’s fastest growing economy has been based on the world’s largest % GDP corporate debt and money expansion. The Chinese population has placed its saving in domestic real estate whose valuation had steadily and reliably grown for twenty years but crested about 2-3 years ago and is now diminishing in valuation. Building corporations such as Country Garden and Evergrande have lost 90-99 % of their valuations over the last two and a half years. Chinese wages are now decidedly less competitive than other capable emerging countries with shorter and politically less complex supply chain issues. Wages in the Chinese financial sector have been cut by 25-33% resulting in real estate mortgage defaults.

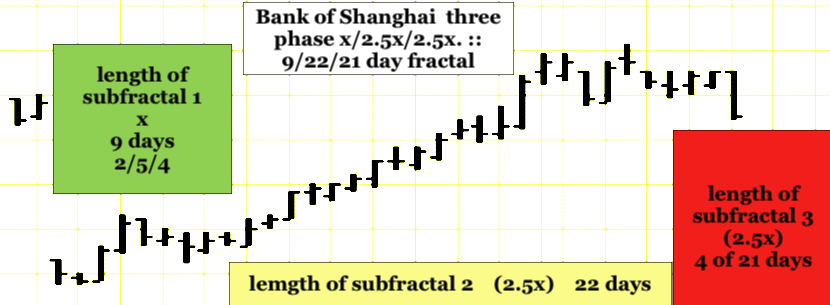
The Bank of Shanghai is the canary in the Chinese asset debt macroeconomic coal mine and is following a 12/2017 three phase 9/20/18 – 23 month x/2-2.5x/2-2.5x fractal series and a sequential three phase fractal series : (5)/13/11 of12 months :: x/2.5x/2.5x and (2)/5/4-5/(3) months with an anticipated nadir low in 10 to 11 months

A daily three phase fractal pattern for the Bank of Shanghai started on 6/27/2023 and follows a 9/22/4 of 21-22 day pattern :: x/2.5x/2.5x ending with an expected nonlinear low in 17-18 trading days.
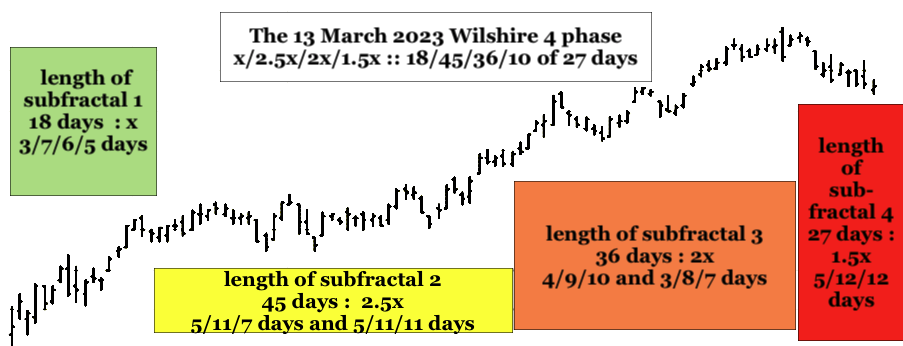
Starting 13 March 2023 the US Wilshire had a 4 phase blow-off fractal series of 18/45/36/10 of 27 days with a peak valuation on 31 July the 36 day 2x of subfractal 3. A nonlinear low is expected in 17 trading days. The decay fractal series starts on 7/ 27/2023 following a 3 phase 5/8 0f 13/13 day :: x/2.5x/2.5x fractal pattern or from the 31 July 2023 peak valuation: 5/6 of 12/12 days :: x/2.5x/2.5x.
US equity valuation decay from its peak in September 1929 to its nadir in June 1932 occurred over 32 months and started in August 1929. Two sequential three phase x/2x/2x fractal decay series of 15/33/30 weeks followed by 16/34/32 weeks are observable and completed the mathematical decay in June 1932 as debt was liquidated and restructured and assets sold at lower and lower prices.

By the law of a four phase fractal, Japan’s March 2020 Nikkei is expected to reach a low in 10 -11 months.
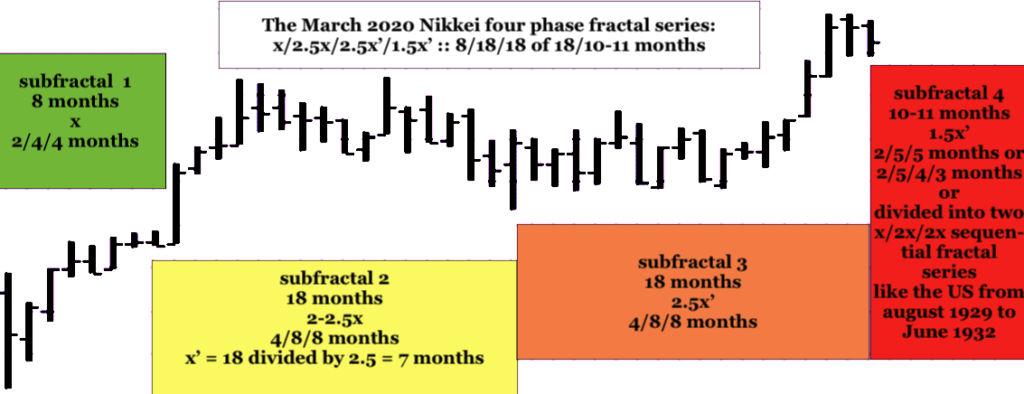
March 2020 Global QE/QT Equity Growth to a time-based fractal maximum lower high : the Nikkei : 33/72/72 weeks :: x/2-2.5x/2-2.5x 

The Nikkei’s 72 week third fractal  was concluded with a final 15 March 2023 15/37/37 day fractal series :: x/2.5x/2.5x.

When does composite  equity valuation growth conclude it lower high growth in a QE dominant debt-monetary expansion system? When it fractally must. 

The Wilshire is following a similar March 2020 33/72/72 week :: x/2-2.5x/2-2.5x secondary maximum growth fractal series and a concluding 13 March 2023 18/35/37 day growth series :: x/2x/2x.

The final low for this 2020 QE/QT cycle appears to be based on a  9/26 2023 Wilshire interpolated fractal series of 14/30 of 35/28 weeks :: y/2-2.5y/2y.

This model would see a low in another 24 days of trading completing the 35 week second fractal.

The US 3 month  treasury  minus ten year Note has the most time based negative area under the curve of any time period since the early 1980’s. All were followed by recessions.

The July 2023 Great Global Equity And Commodity Crash – US Debt Market Fractal Progression Since March 2020

The Debt Market Side  of the Asset-Debt Macroeconomic System: Now 8 days to a Historical  1982 13/30 Year First and Second Fractal Equity and Commodity Asset Valuation  Nonlinear Low


The global central banks’ manipulable debt markets represent  both an accelerator and conversely  the boron rods of a potentially  exponential fissionable asset over production and price over valuation.Lowering and raising of interest rates represent boron rod withdrawal and insertion, respectively equating broadly to  QE and QT.. 


At persistently zero or  negative interest rates, there is no limit to asset over production and valuation. The result is hyperinflation and the resulting complete dissolution of  the socialcontract for  workers and pensioners, the stuff  that maintains the macroeconomic system’s equilibrium. At high borrowing rates, the boron rod effect collapses growth activity, resulting in decreased economic activityand unemployment. If extreme., these boron rods  can implode the system.  

The March 2020 Ten Year Note weekly fractal sequence is 30/75/72 of 74 weeks. The 72 of 74 week third fractal is composed of a 4/10/10 week series followed by a 8/19/17/10 of 12 week series. The final 4th fractal 12 week series of the latter weekly series starts on 5/11/2023 and is composed of a 8/19/18/5 of 13 day sequence. The next 8 trading days could reasonably complete a 1981-82 13/30 year first and second fractal series, interpolated within the US hegemony 1807 36/90/90/54 year series with its 90 year third fractal (composite equity and crypto) asset valuation peak on 8 November 2021. Historical second fractal terminal 2x-2.5x area (26- 32 year) nonlinearity would result in both sudden and huge declines in equity and commodity valuation prices. 

Expect the unexpected. Over the next 8 trading days, money exiting commodities, equities, and crypto will flow into US debt instruments driving US debt interest rates much lower.

The Fed may  lower interest rates at the 25-26 July 2023 meeting simply to keep their policy in tune with US debt instrument actual market forces and a sudden drop in commodity and equity prices.