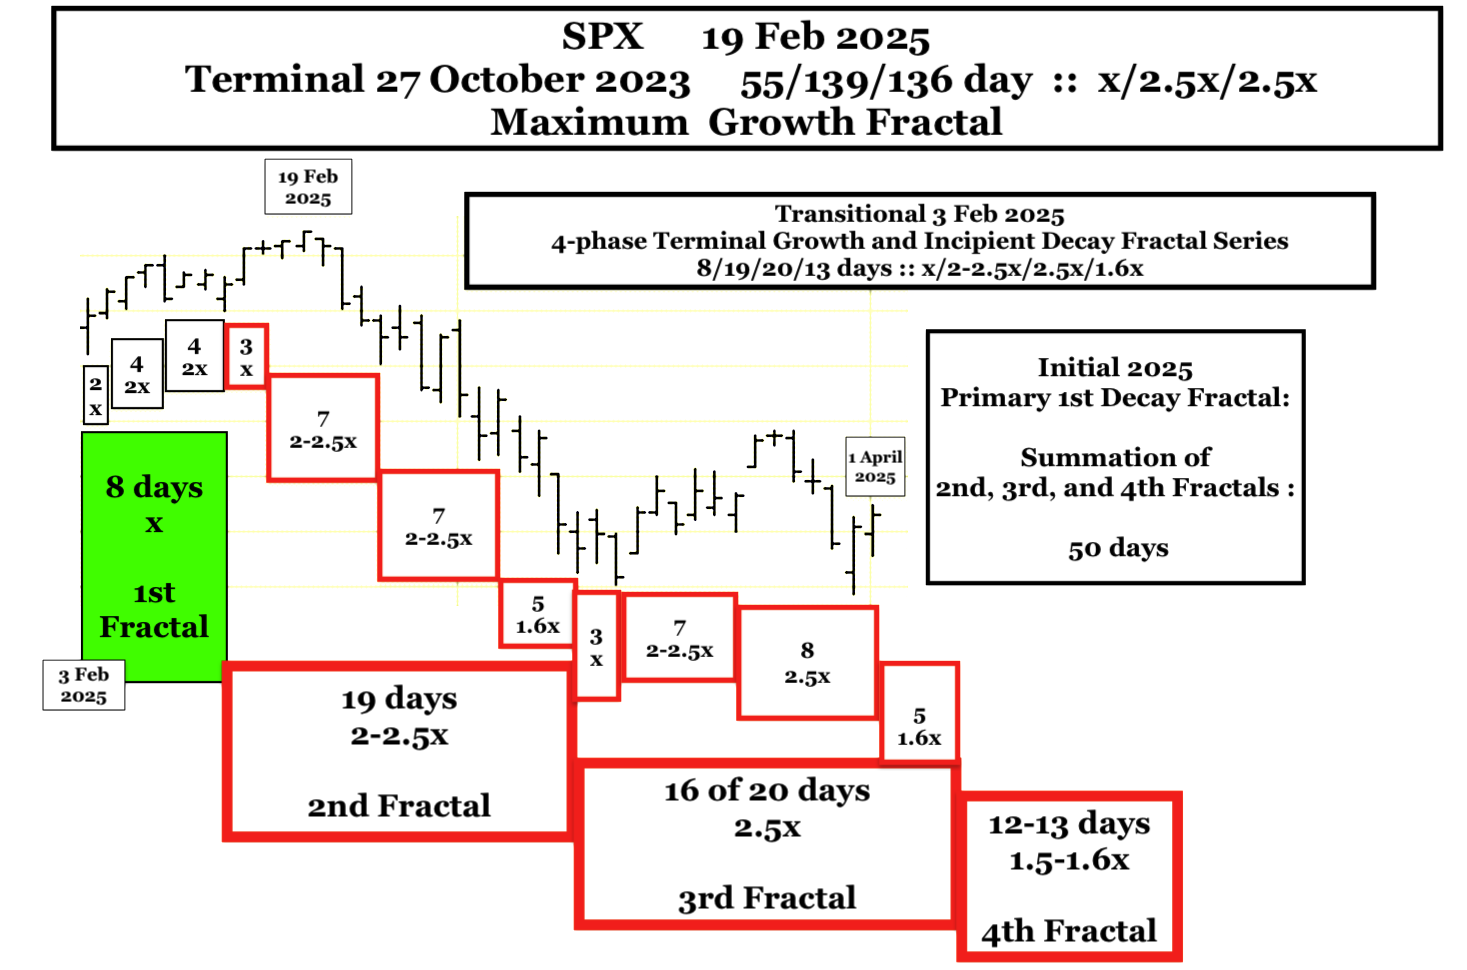
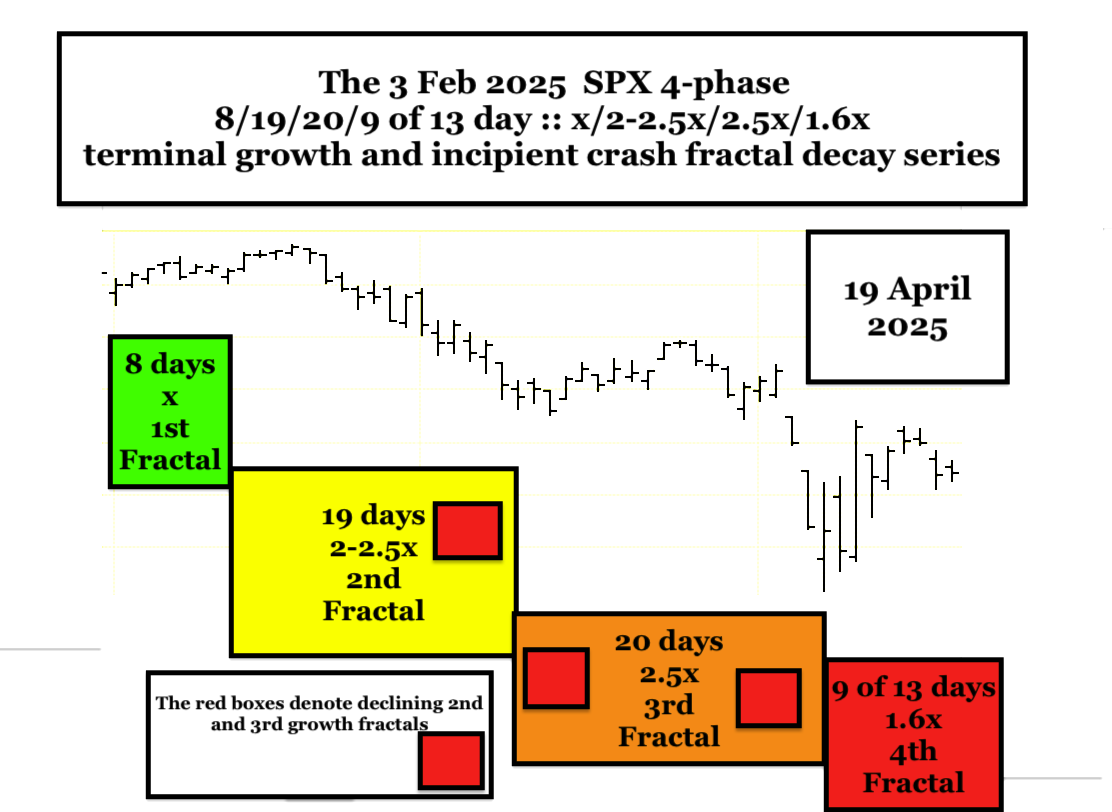
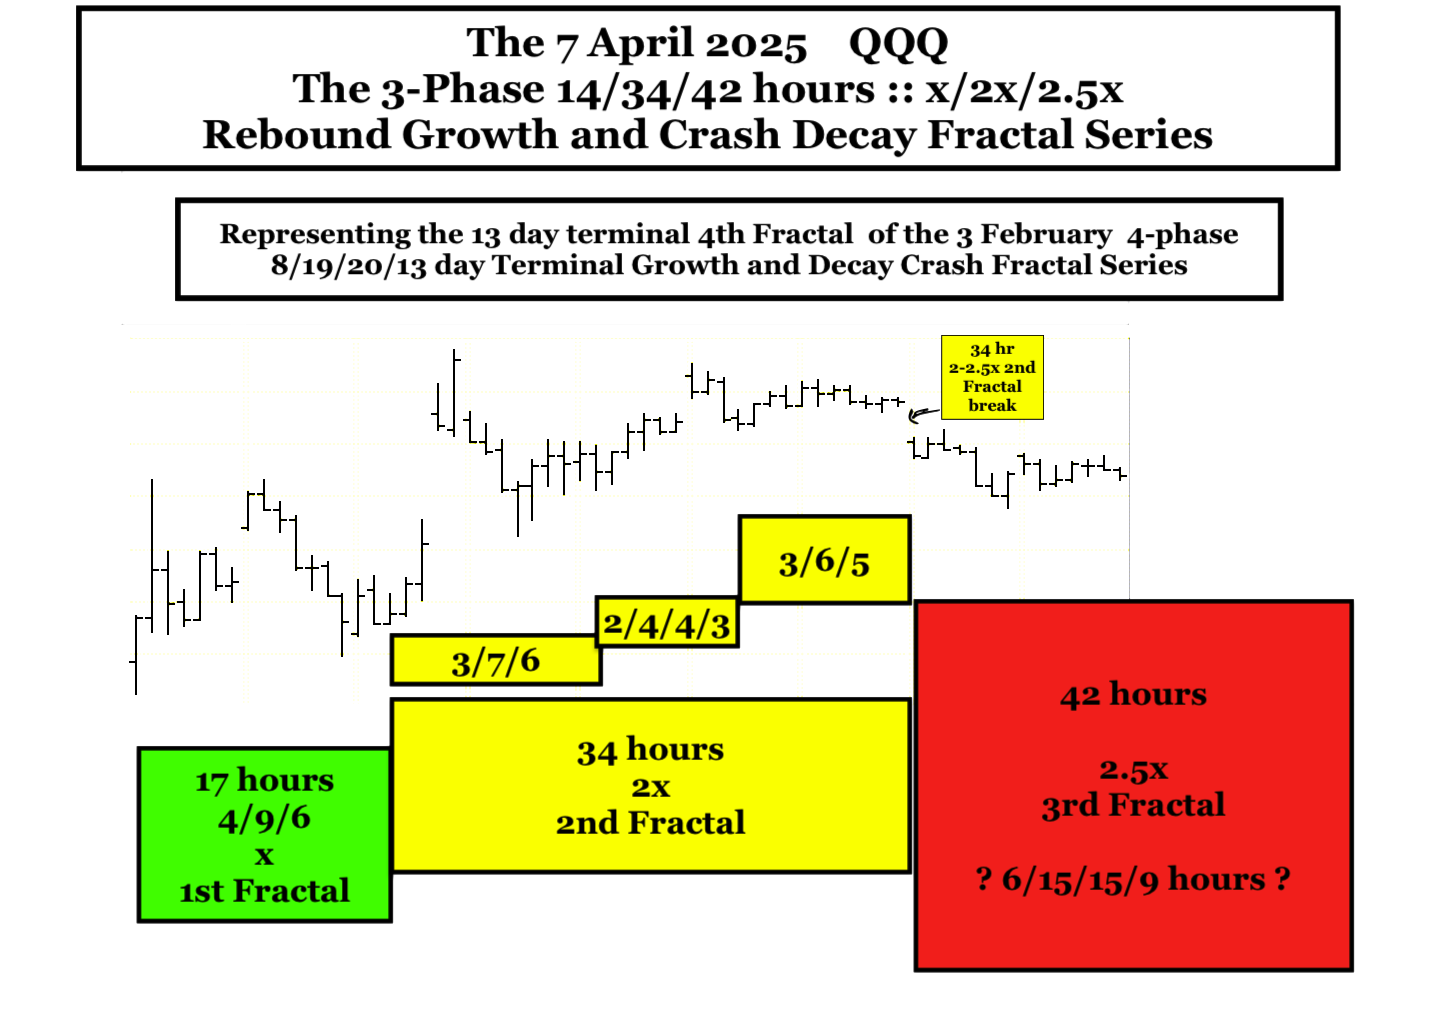
The SPX/QQQ identified 4-phase 3 February 2025 8/19/20/13 day :: x/2.5x/2-2.5x/1.6x terminal growth and crash decay fractal series model failed to coincide with the asset-debt system’s deterministic self assembly valuation growth and decline pathway.
On further review the 3 February 2025 fractal model is interpolated within a larger SPX/QQQ 13 January 2025 13/30/31 of 33/20 day 4-phase terminal growth and initial crash fractal decay series. The 33 day 3rd fractal ends on a lower high on Tuesday 29 April 2025 with a 20 day 4th crash fractal ending on 27 May 2025 and an expected final low in December 2026.
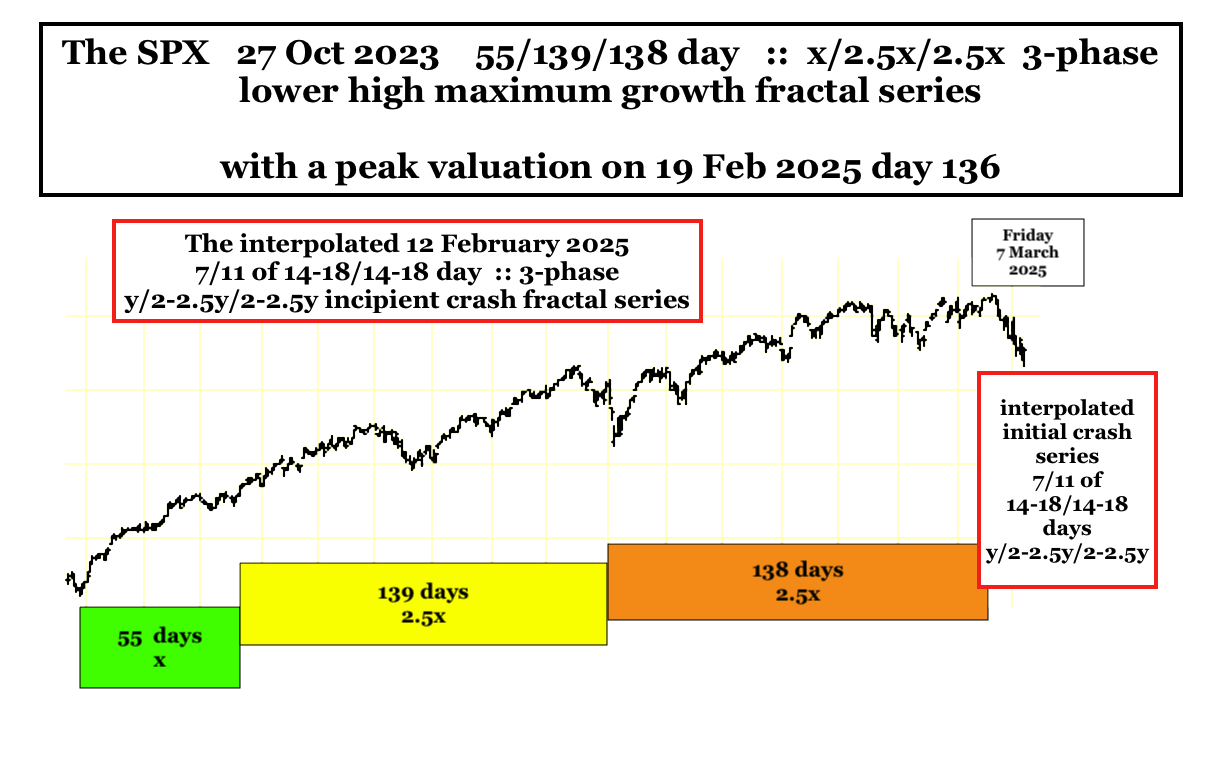
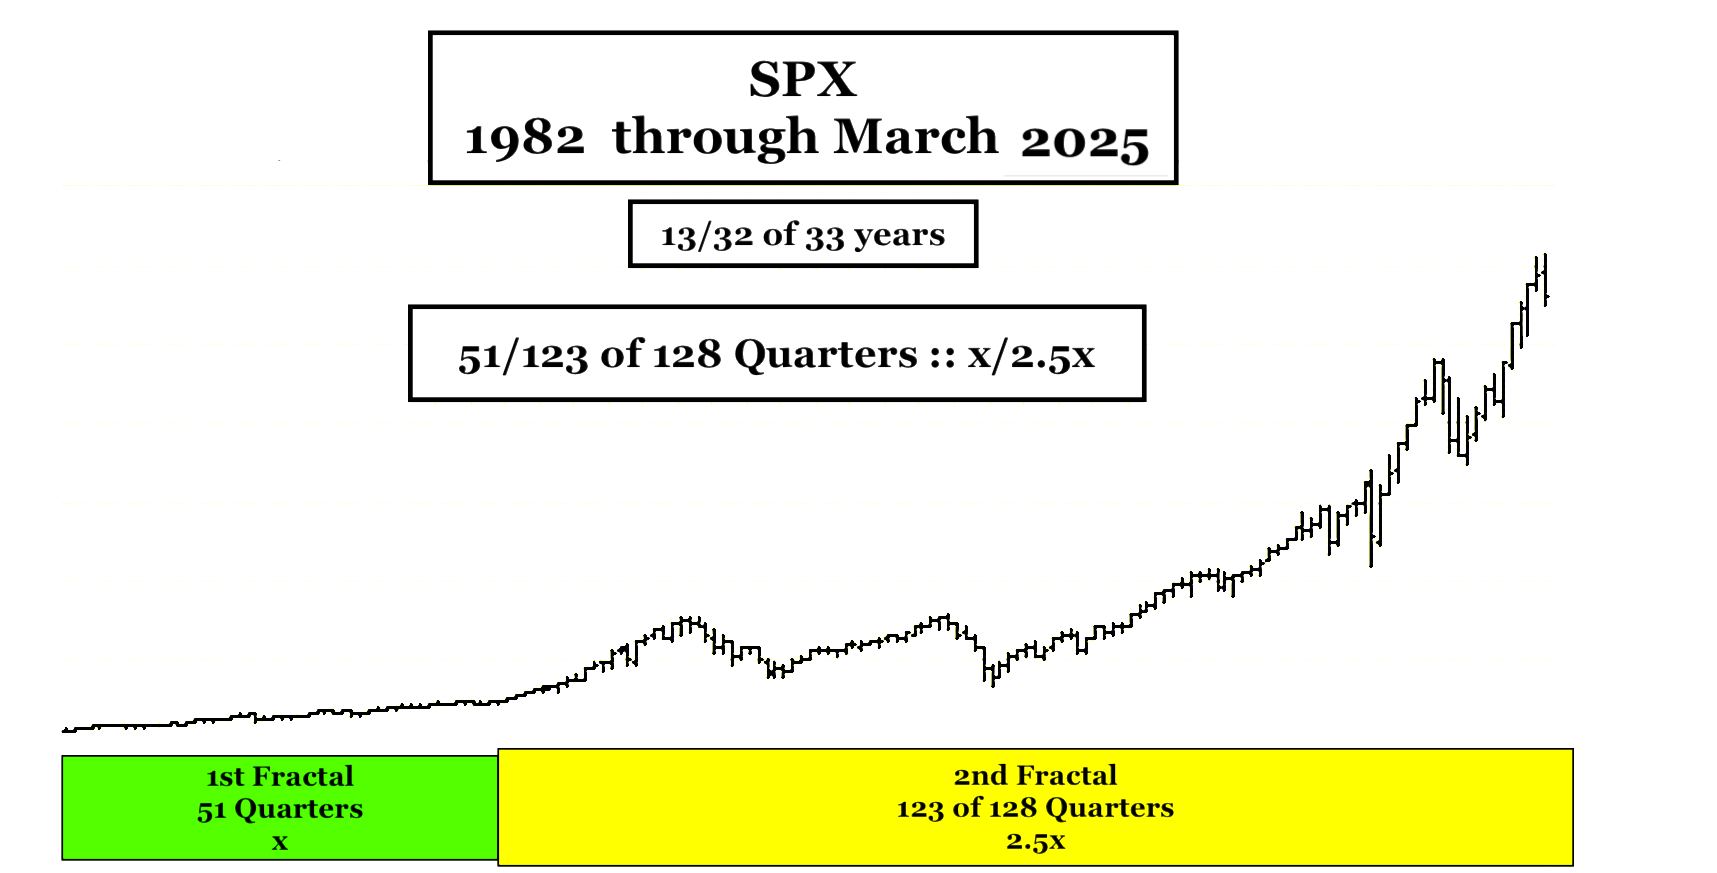
The 2nd 30 day fractal contains the 1982 SPX 13/32 year peak valuation high on 19 February 2025 and the 21 February 2025 55/139/138 day :: x/2.5x/2.5x lower high valuation from a terminal fractal growth series starting on 27 October 2023.
For the Shanghai composite the 13 January 2025 4 phase fractal series is 12-13/26-33/26-33/18 days with 8 days of the terminal 2nd and the initial 3rd fractal mathematically shared for an average 1st, 2nd, and lower high 3rd fractal of 12-13/29.5-30/29.5-30 days :: x/2.5x/2.5x The 4th crash decay fractal with a 2nd fractal of 30 days length and an ideal 1st fractal base of 12 days would have a 1.5x length of 18 days which balances the Shanghai Composite’s 3 days of stock holidays in early May with the SPX’s Memorial day on 26 May 2025 ending with a low on 27 May 2025.
The Shanghai Composite is following a 4-phase December 2018 16/32/31 of 32/20 month :: x/2x/2x/1.5x’ Lammert fractal series with an expected low in December 2026.
The timing of the expected lows will have a serious impact on the United States midterm elections of 2026.