In the Asset Debt Macroeconomy the valuation of individual asset classes are denominated in the summation valuation of all other classes including debt instruments: sovereign, non financial and financial corporate, and private debt. Out of the 346 trillion dollars of global collective debt, The US has about 102 trillion.
When non-debt assets are overvalued relative to the underlying collective consumer base economy {after consumers pay for the necessary and inflating activities of daily living(including accumulated debt)}, and consumers can no longer collectively expand their balance sheet thru further debt expansion, generic product demand falls, businesses fail, lower quality corporate debt undergoes default, unemployment grows, and the system’s asset prices fall.
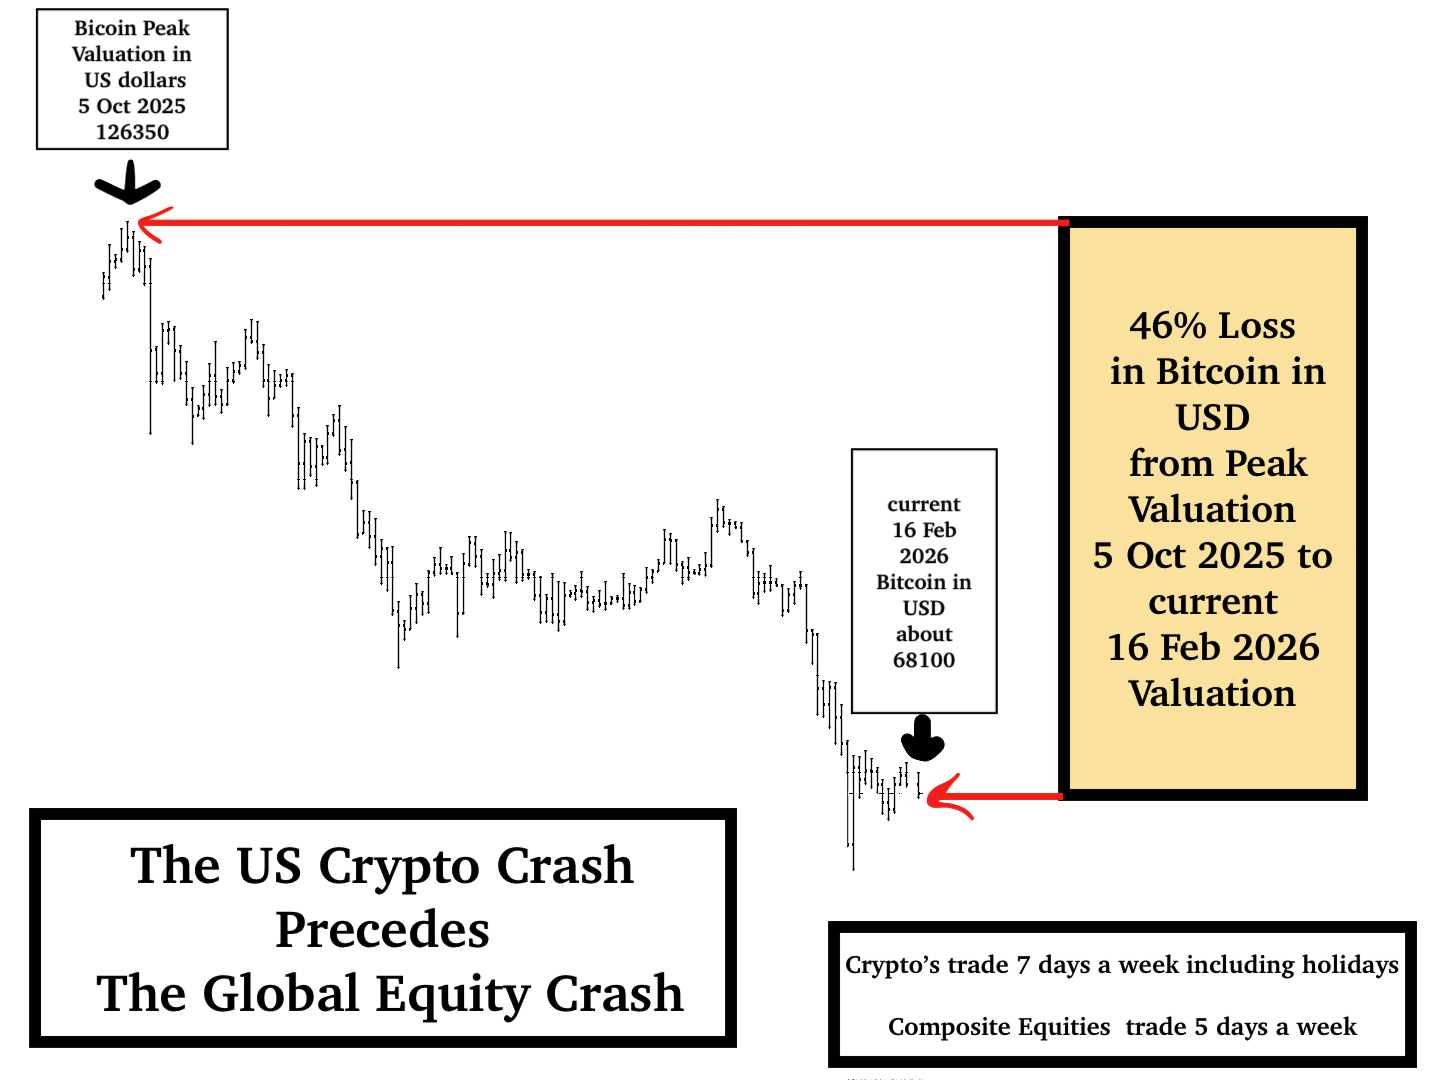
The global composite equity index ACWI peak valuation was on 11 February 2026. Crypto currencies as represented by bitcoin in USD peaked on 5 Oct 2025 at about 126,350 and are currently on 16 Feb 2026 at about 68-69000, a 45-46% drop from peak valuation.
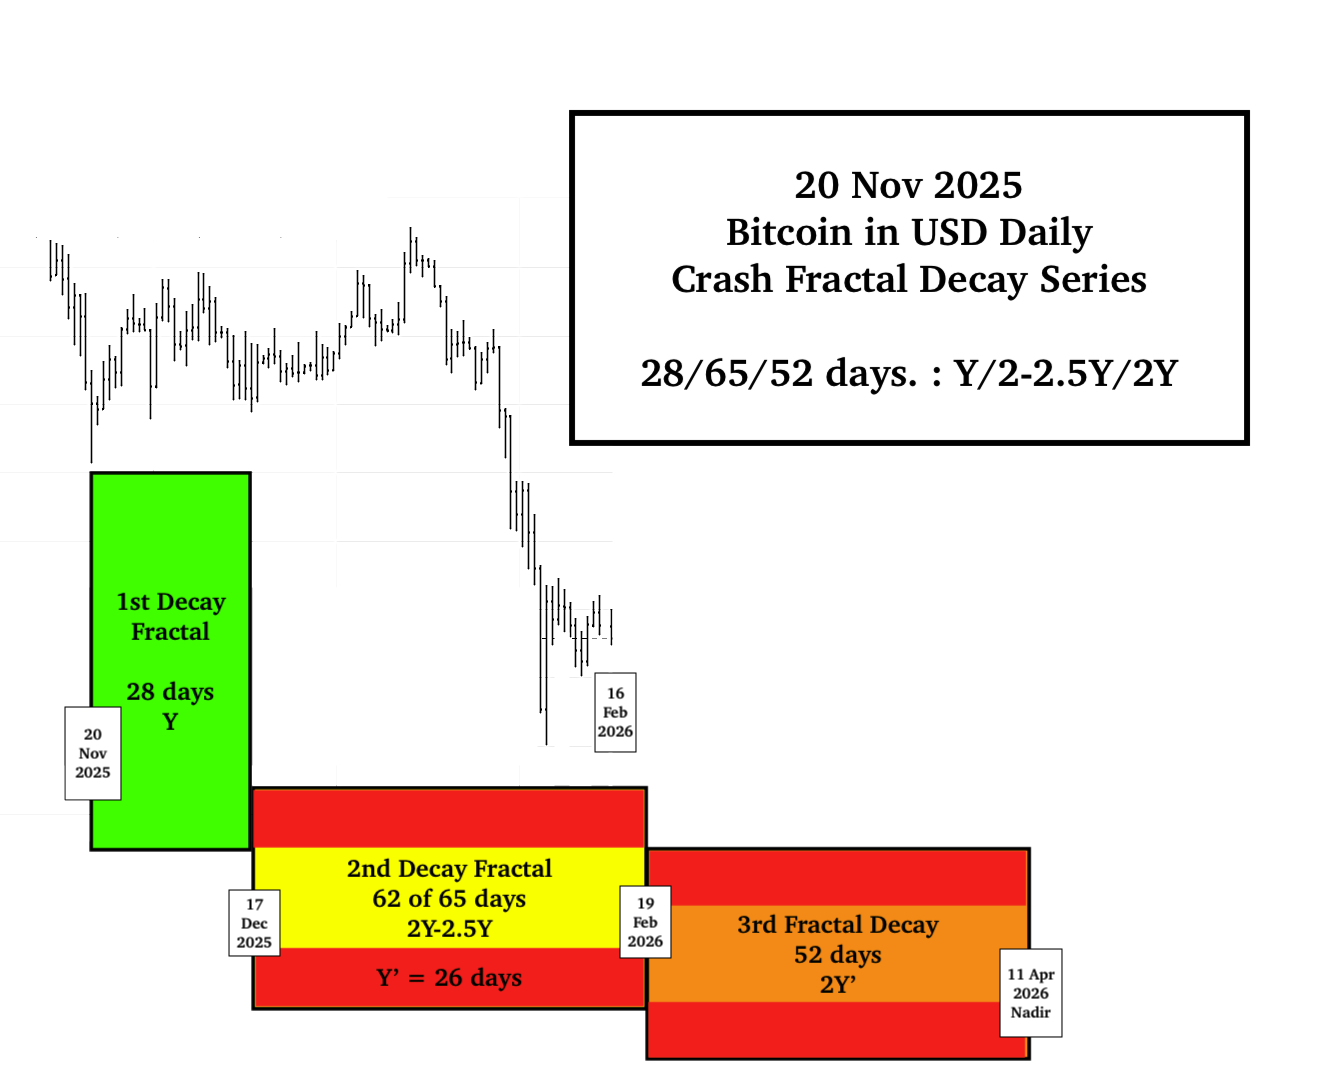
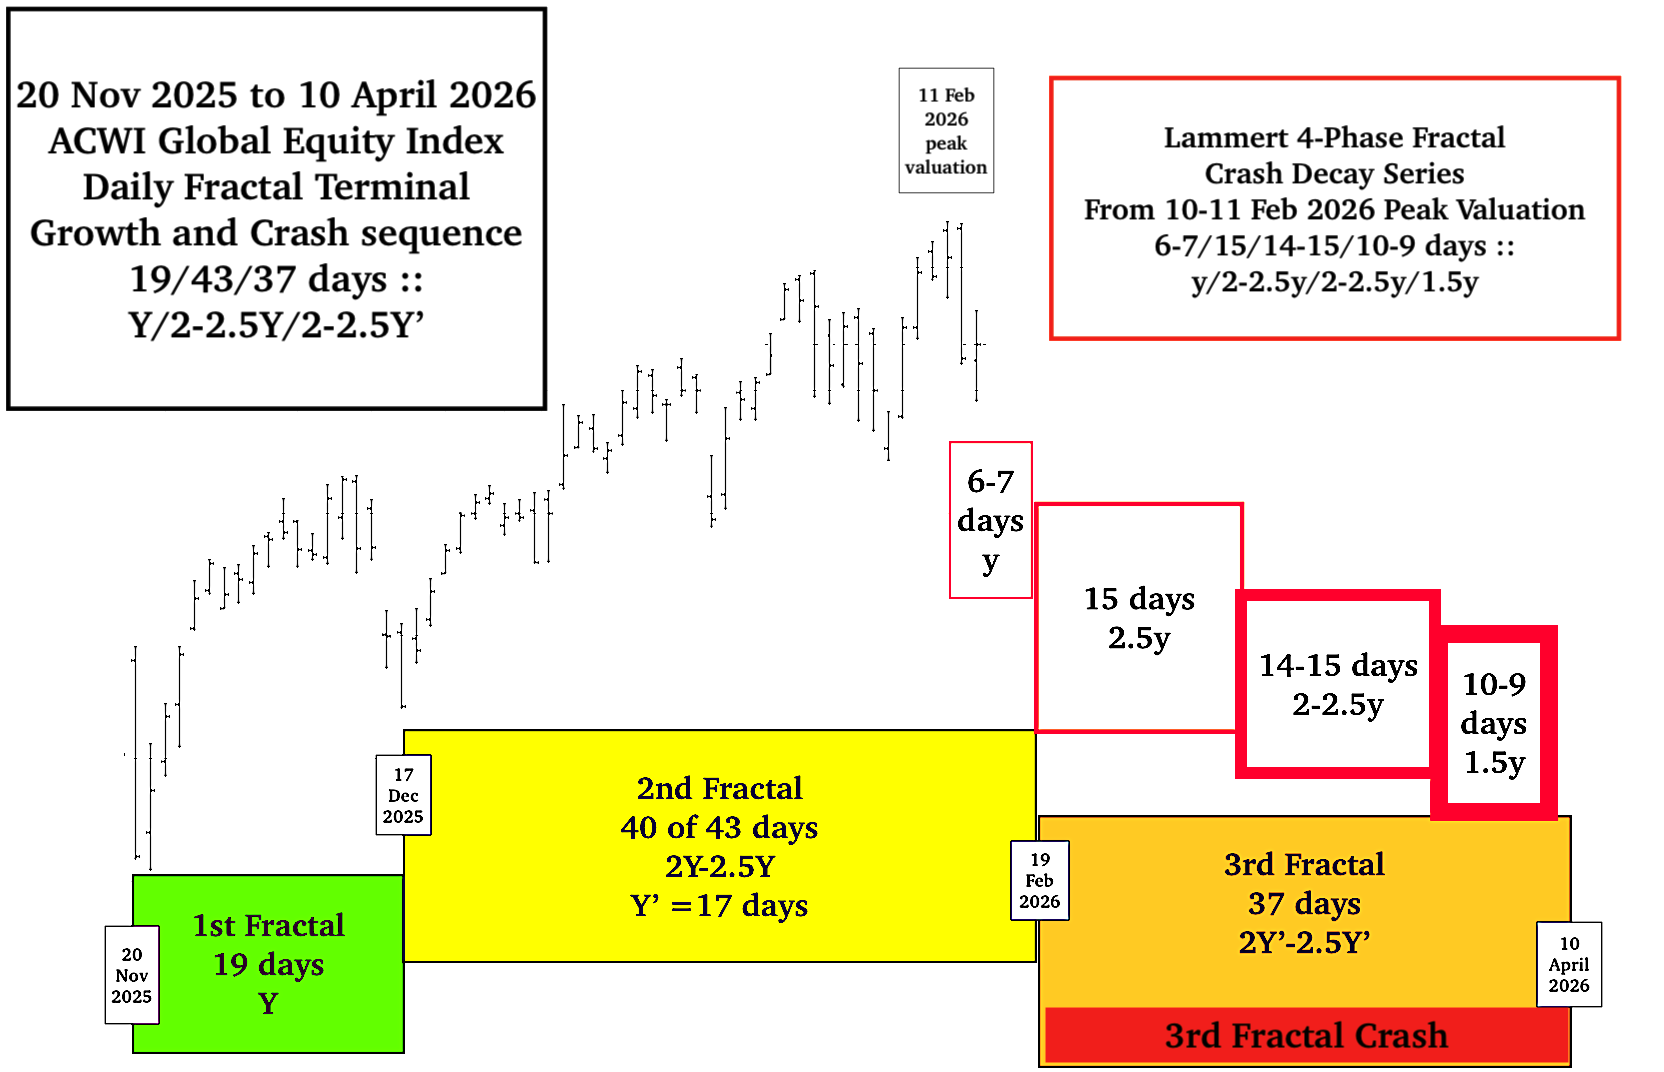
The current daily fractal decay model from 20 November 2025 for Bitcoin in USD which trades 7 days a week including holidays and for the ACWI global equity index which trades 5 days a week less US equity holidays have merged with an expected crash nadir low for ACWI on Friday 10 April 2026 and for Bitcoin in USD on (Saturday) 11 April 2026.
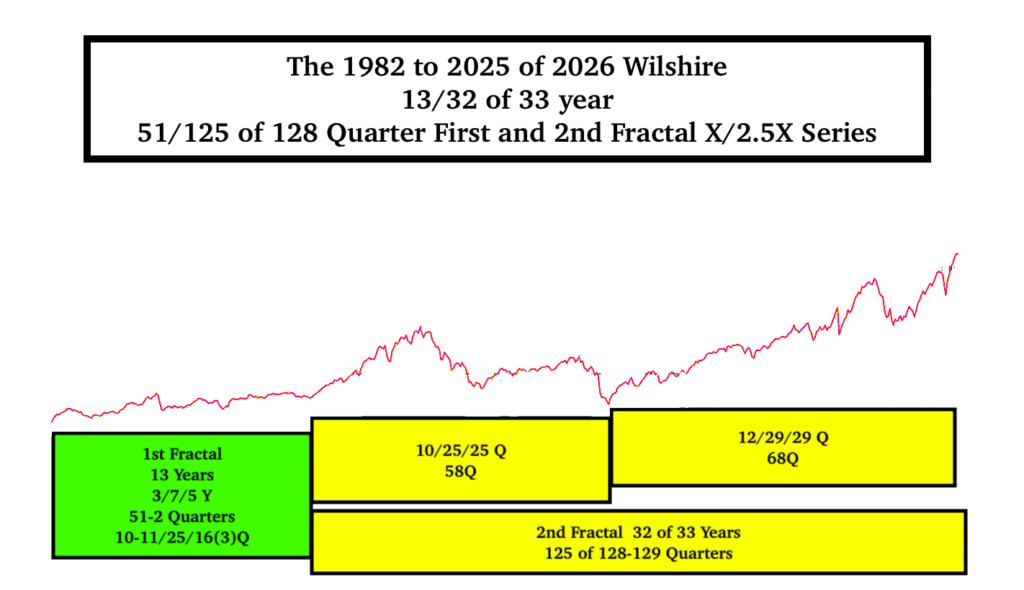
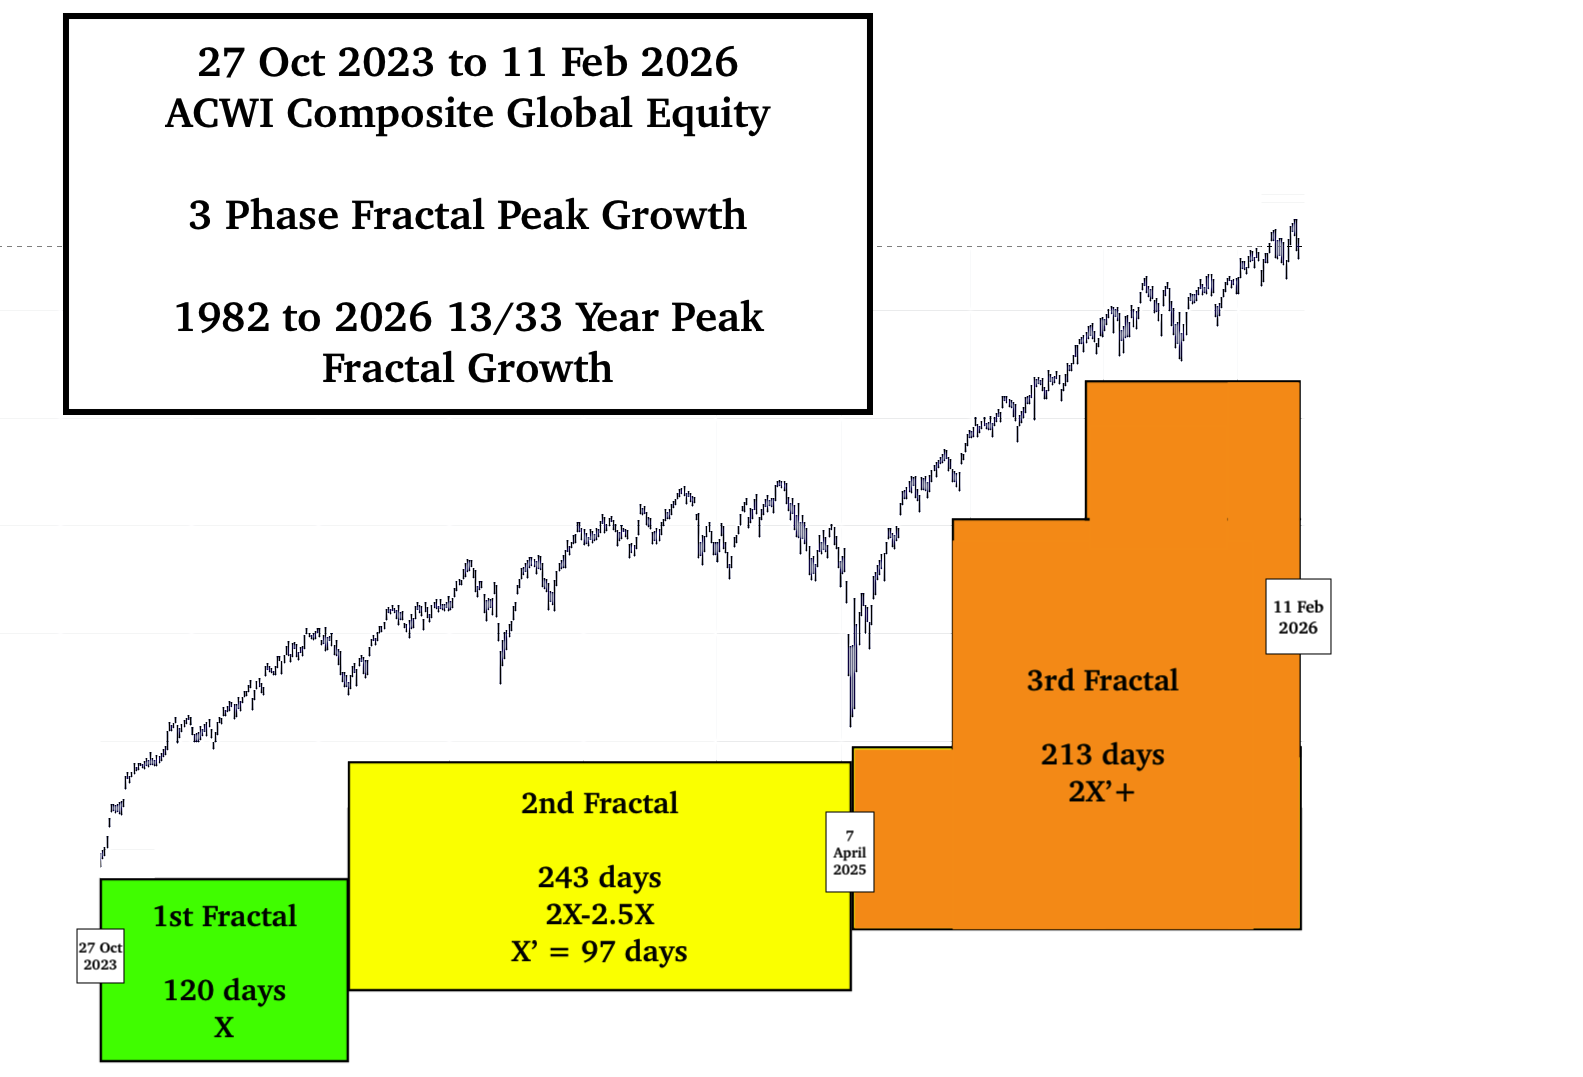
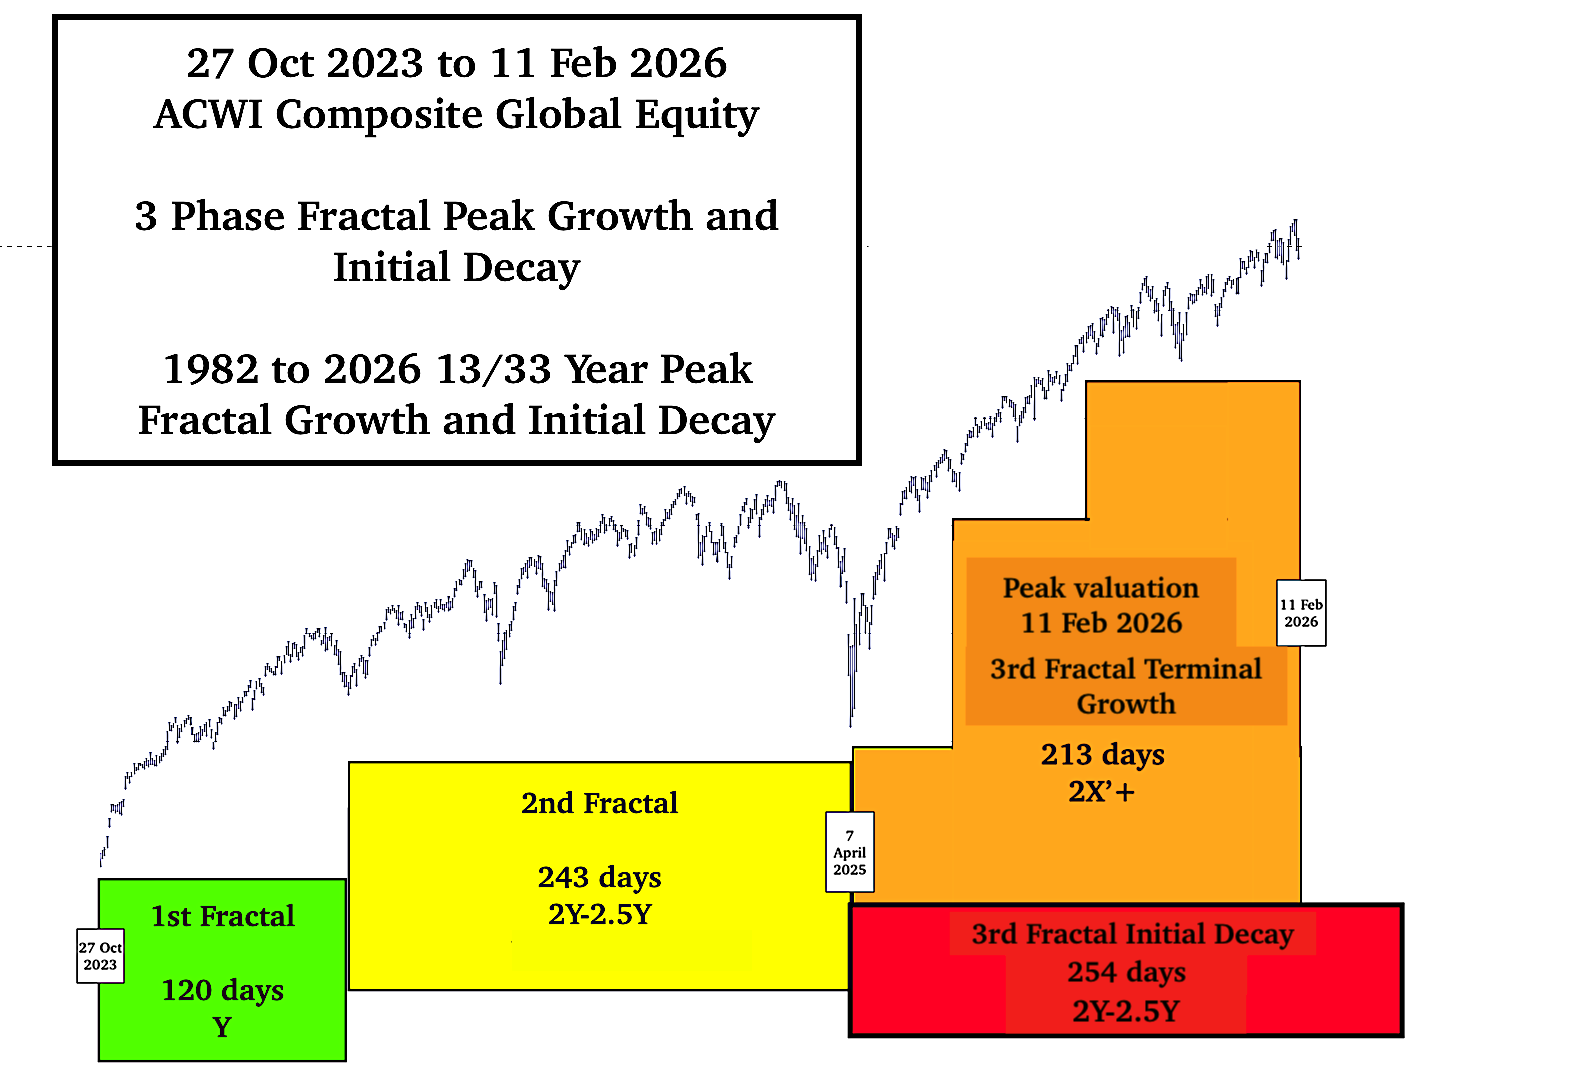
The 10 April 2026 initial crash nadir completes a 27 Oct 2023 3-phase 120/243/254 day :: y/2-2.5y/2-2.5y peak and decay fractal series.
The 10 April 2026 initial crash nadir completes a 27 Oct 2023 3-phase 120/243/254 day :: y/2-2.5y/2.5y (2X’ 214 day peak valuation and) crash decay fractal series.
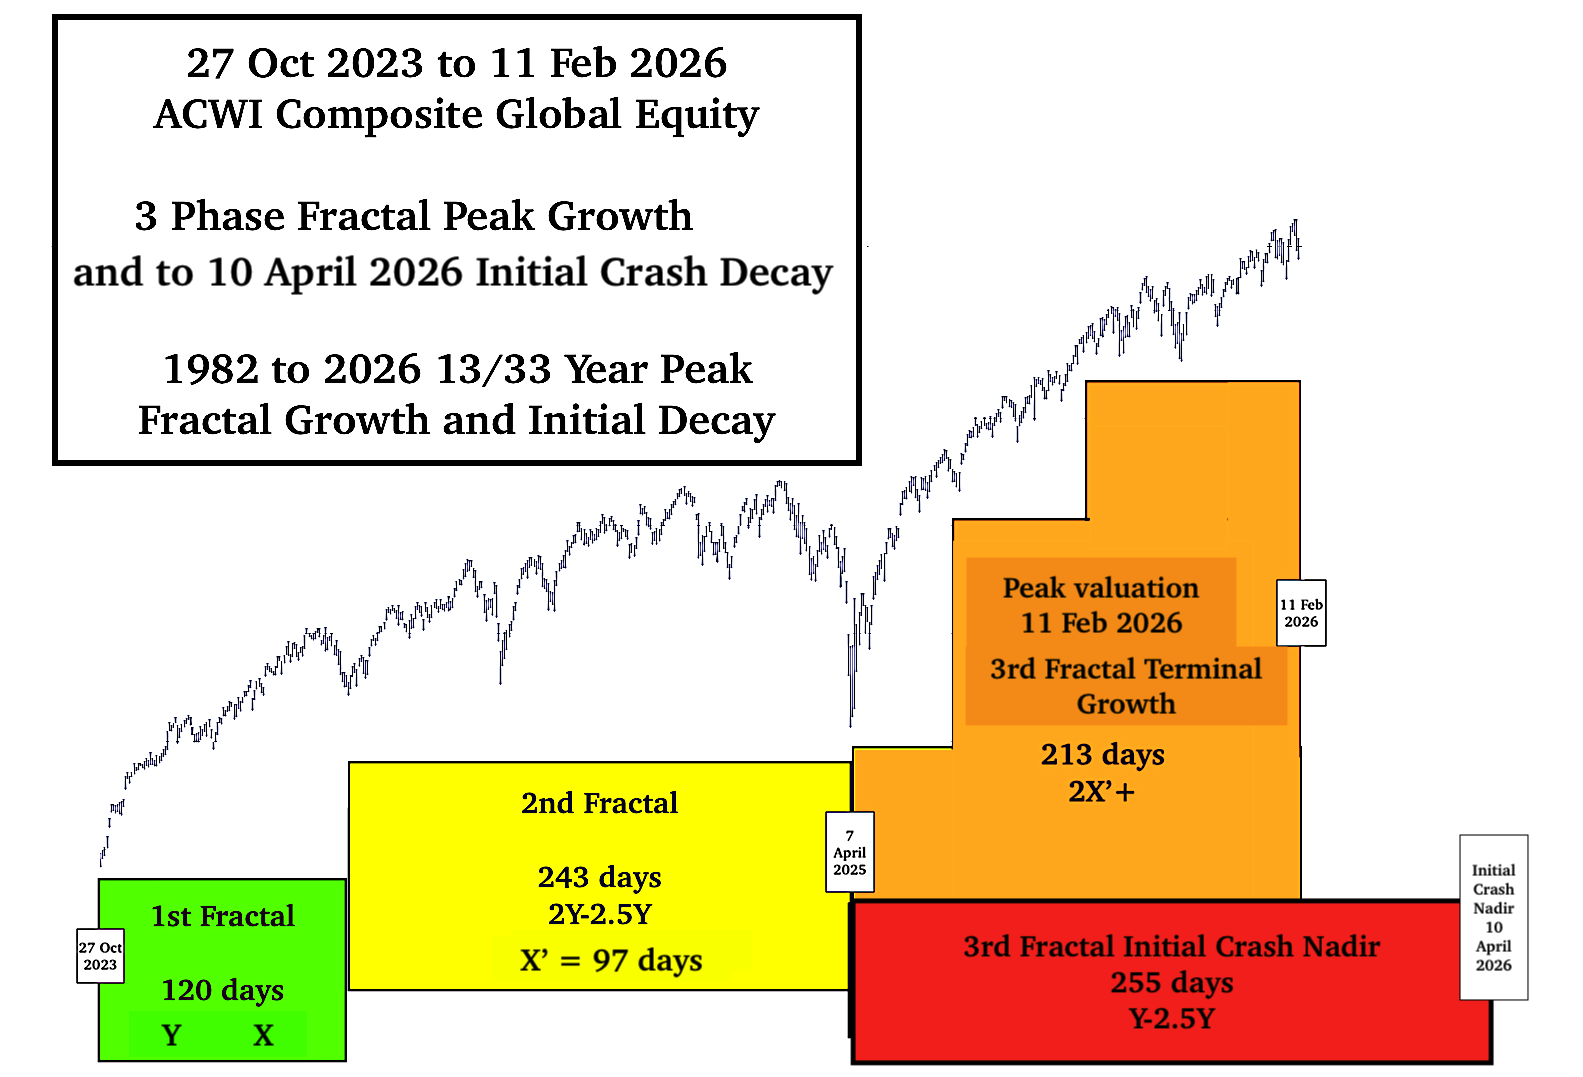
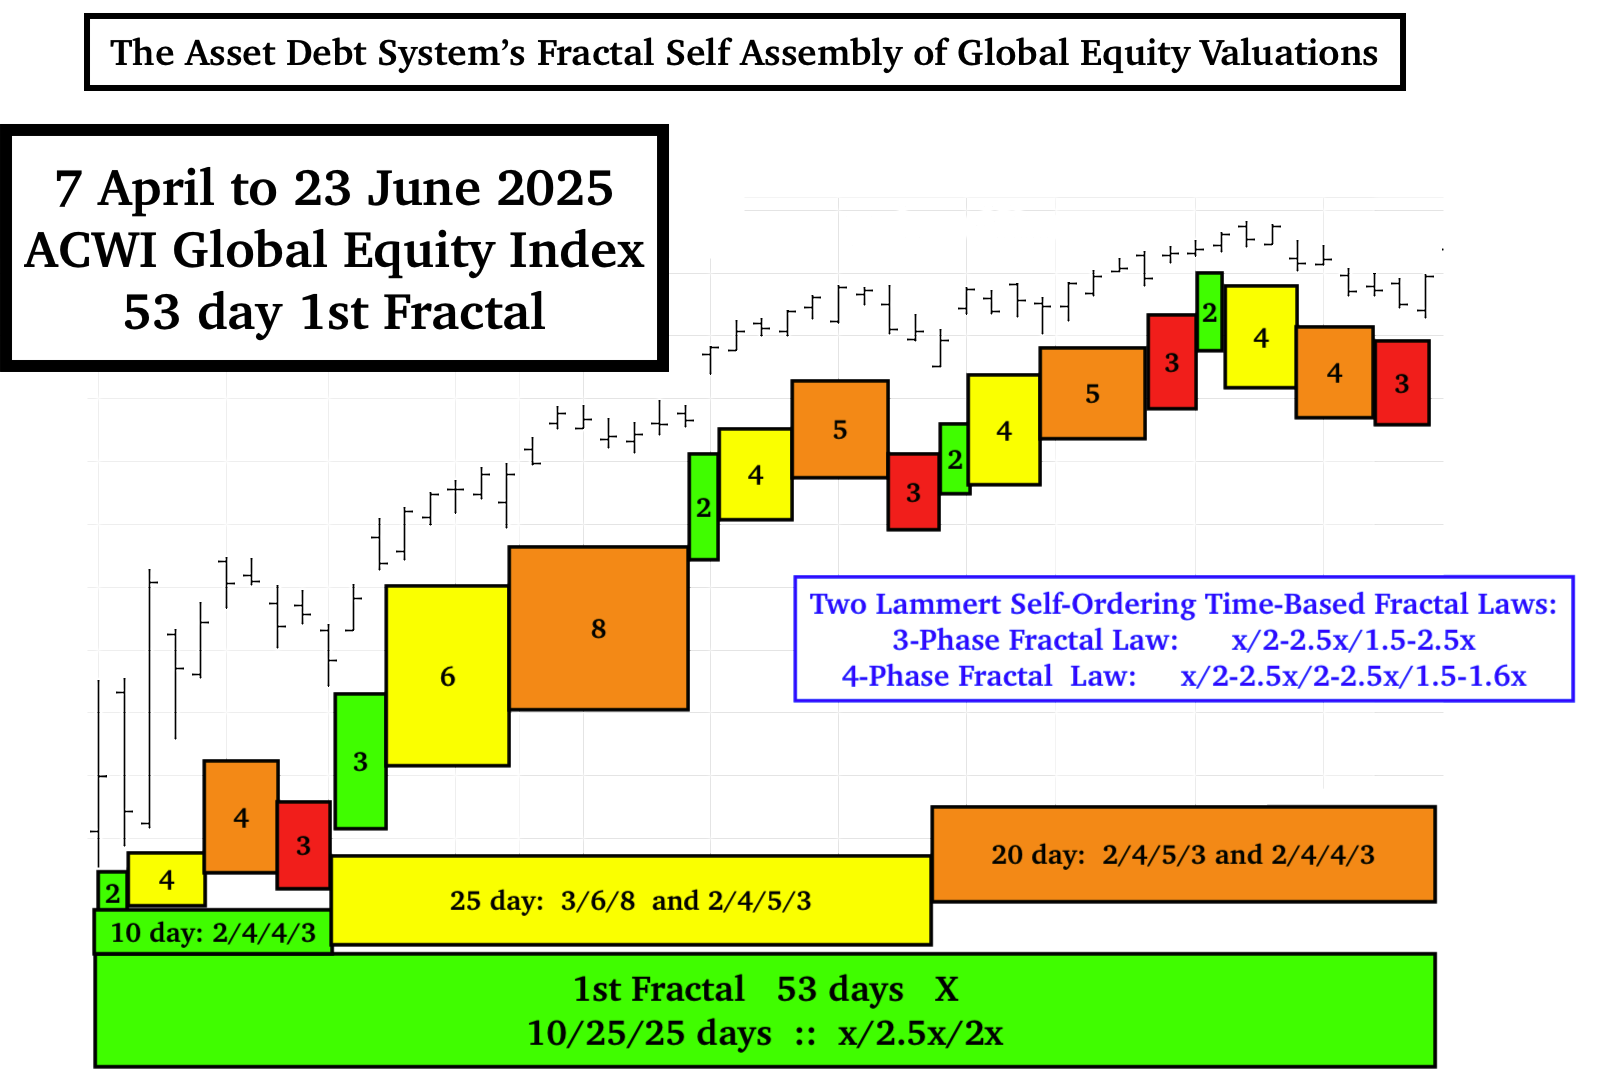
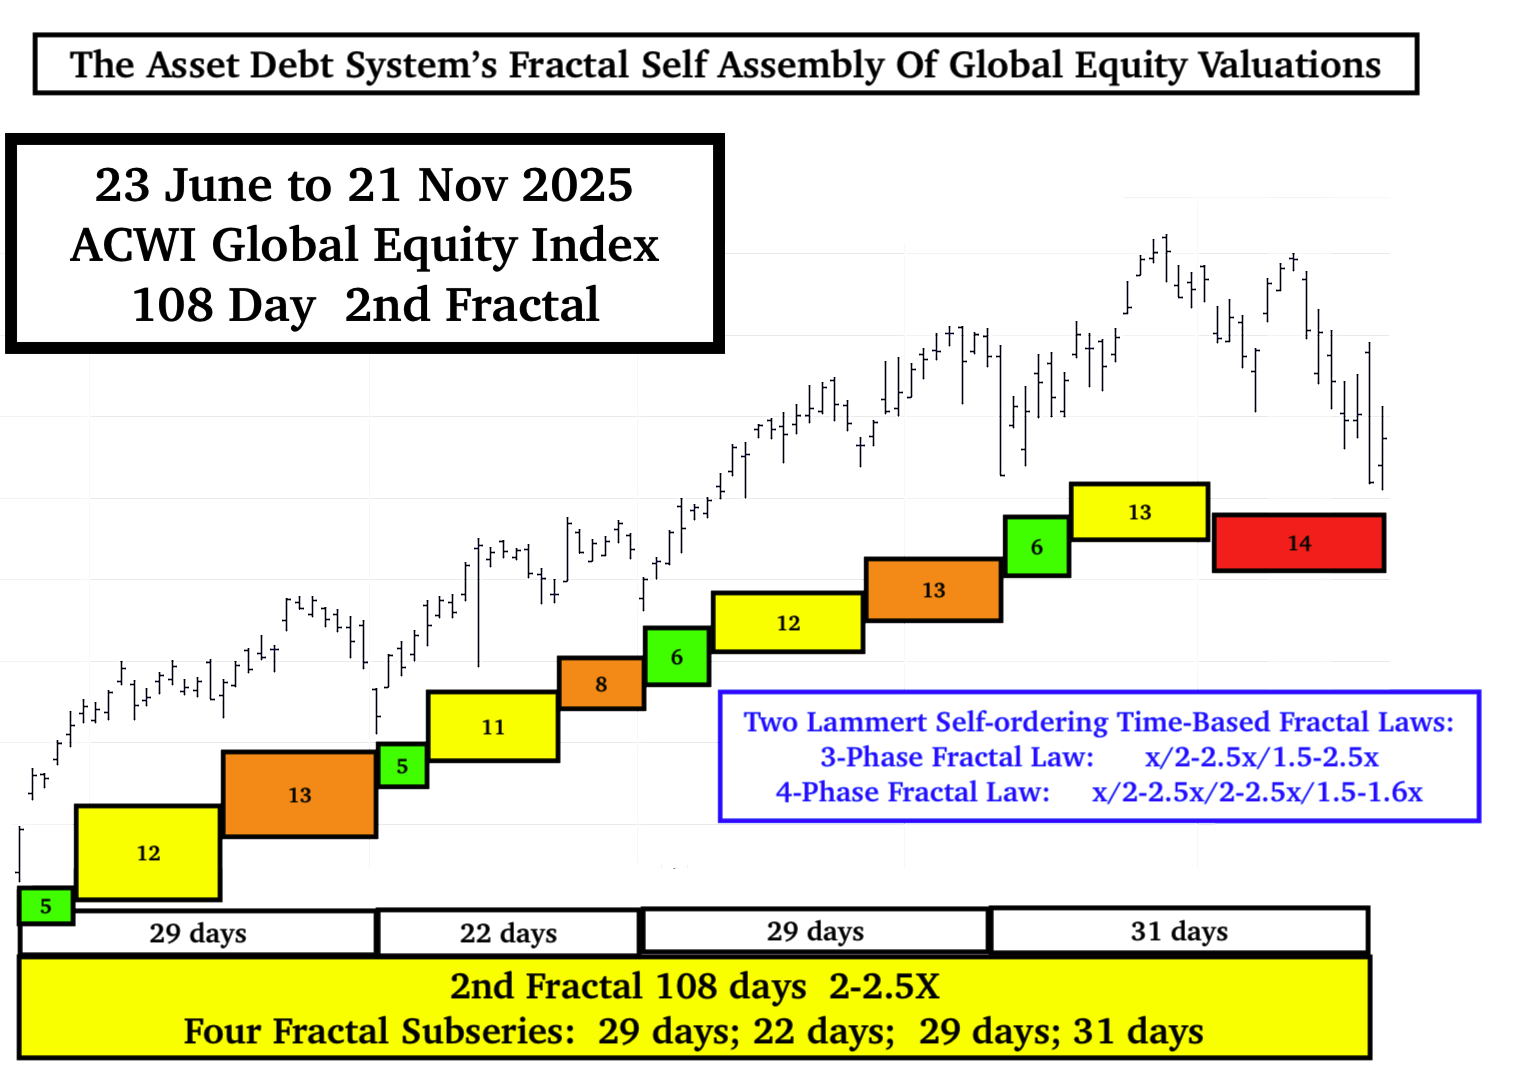
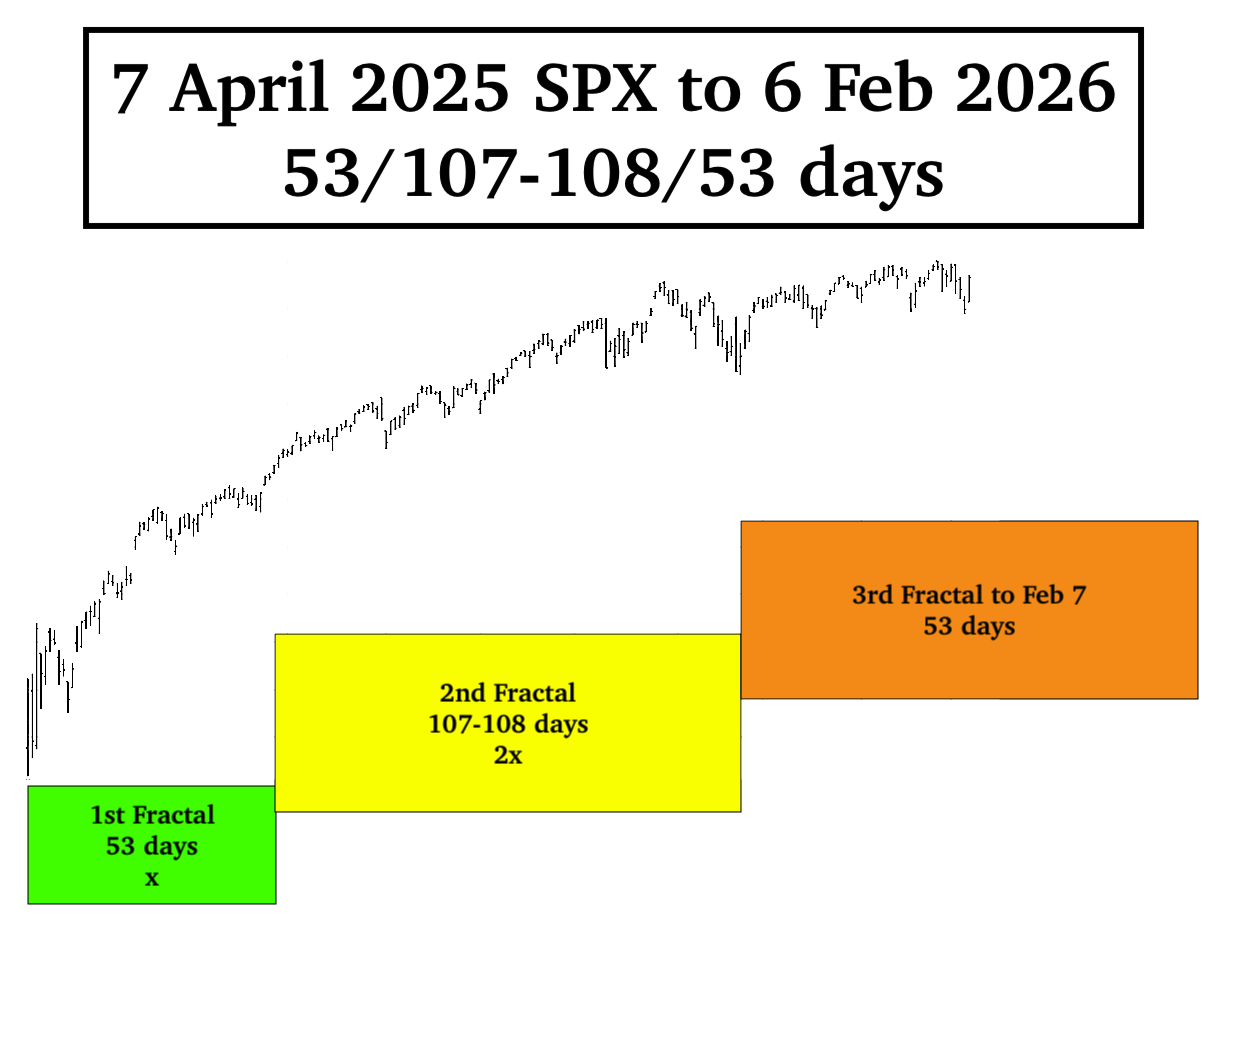
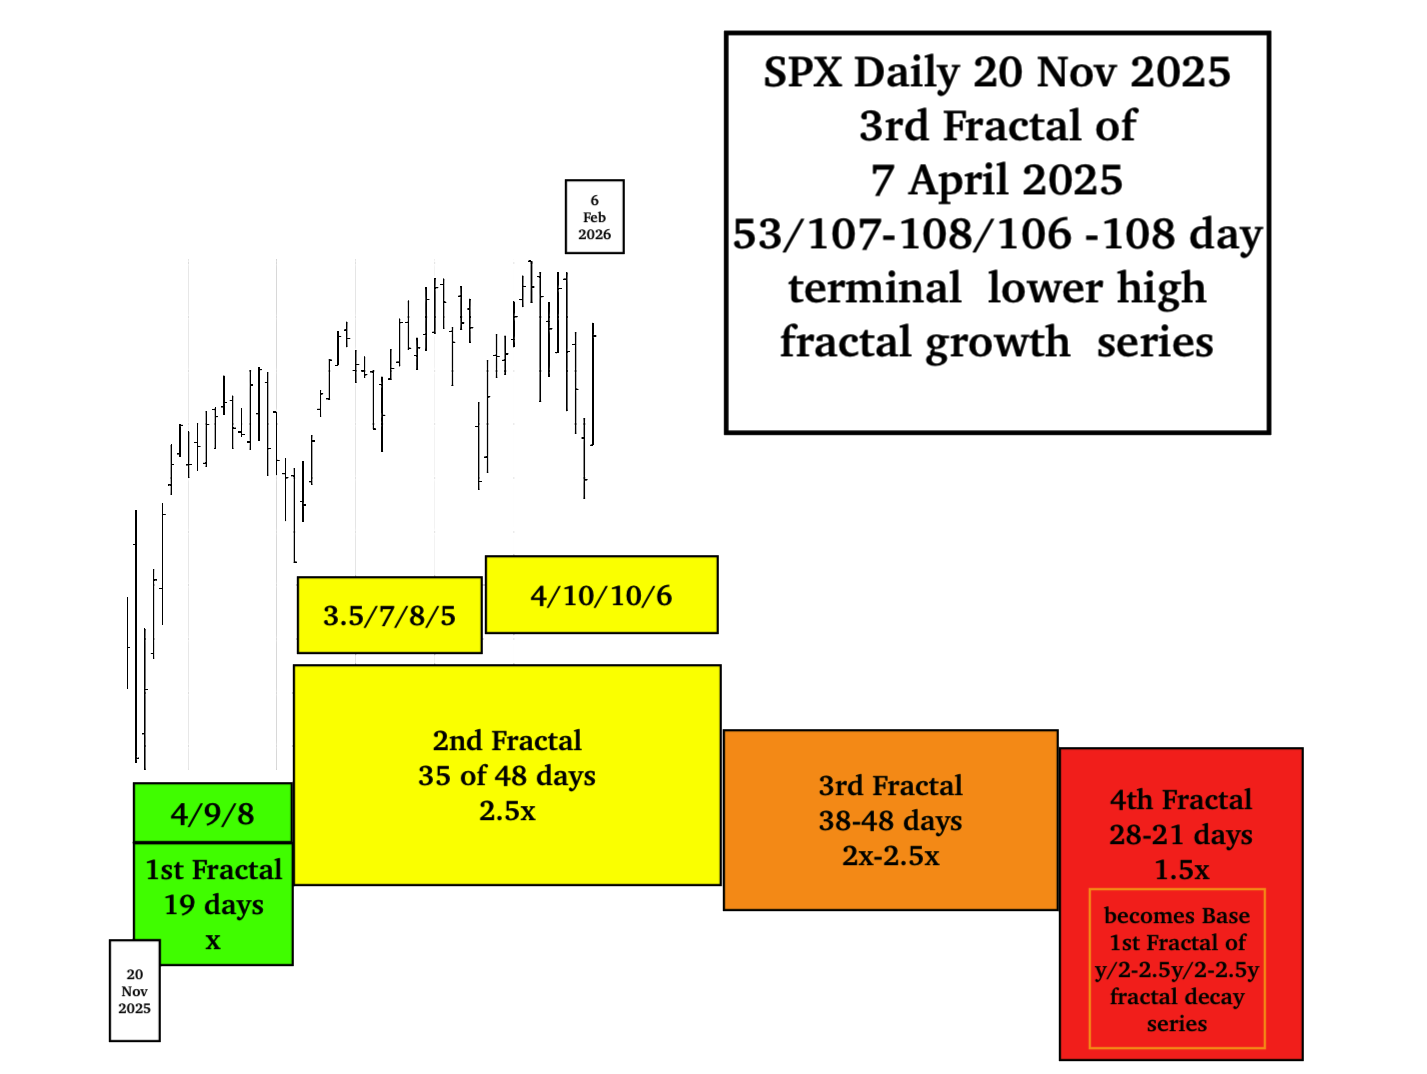
For the 255 day 7 April 2025 3rd Fractal of this 27 Oct 2023 120/243/254-255 day peak growth and initial crash decay series, a 7 April 2025 53/107/97 days :: y/2-2.5y/2-2.5y’ 3 phase peak valuation growth and initial crash decay series will be completed on 10 April 2026.
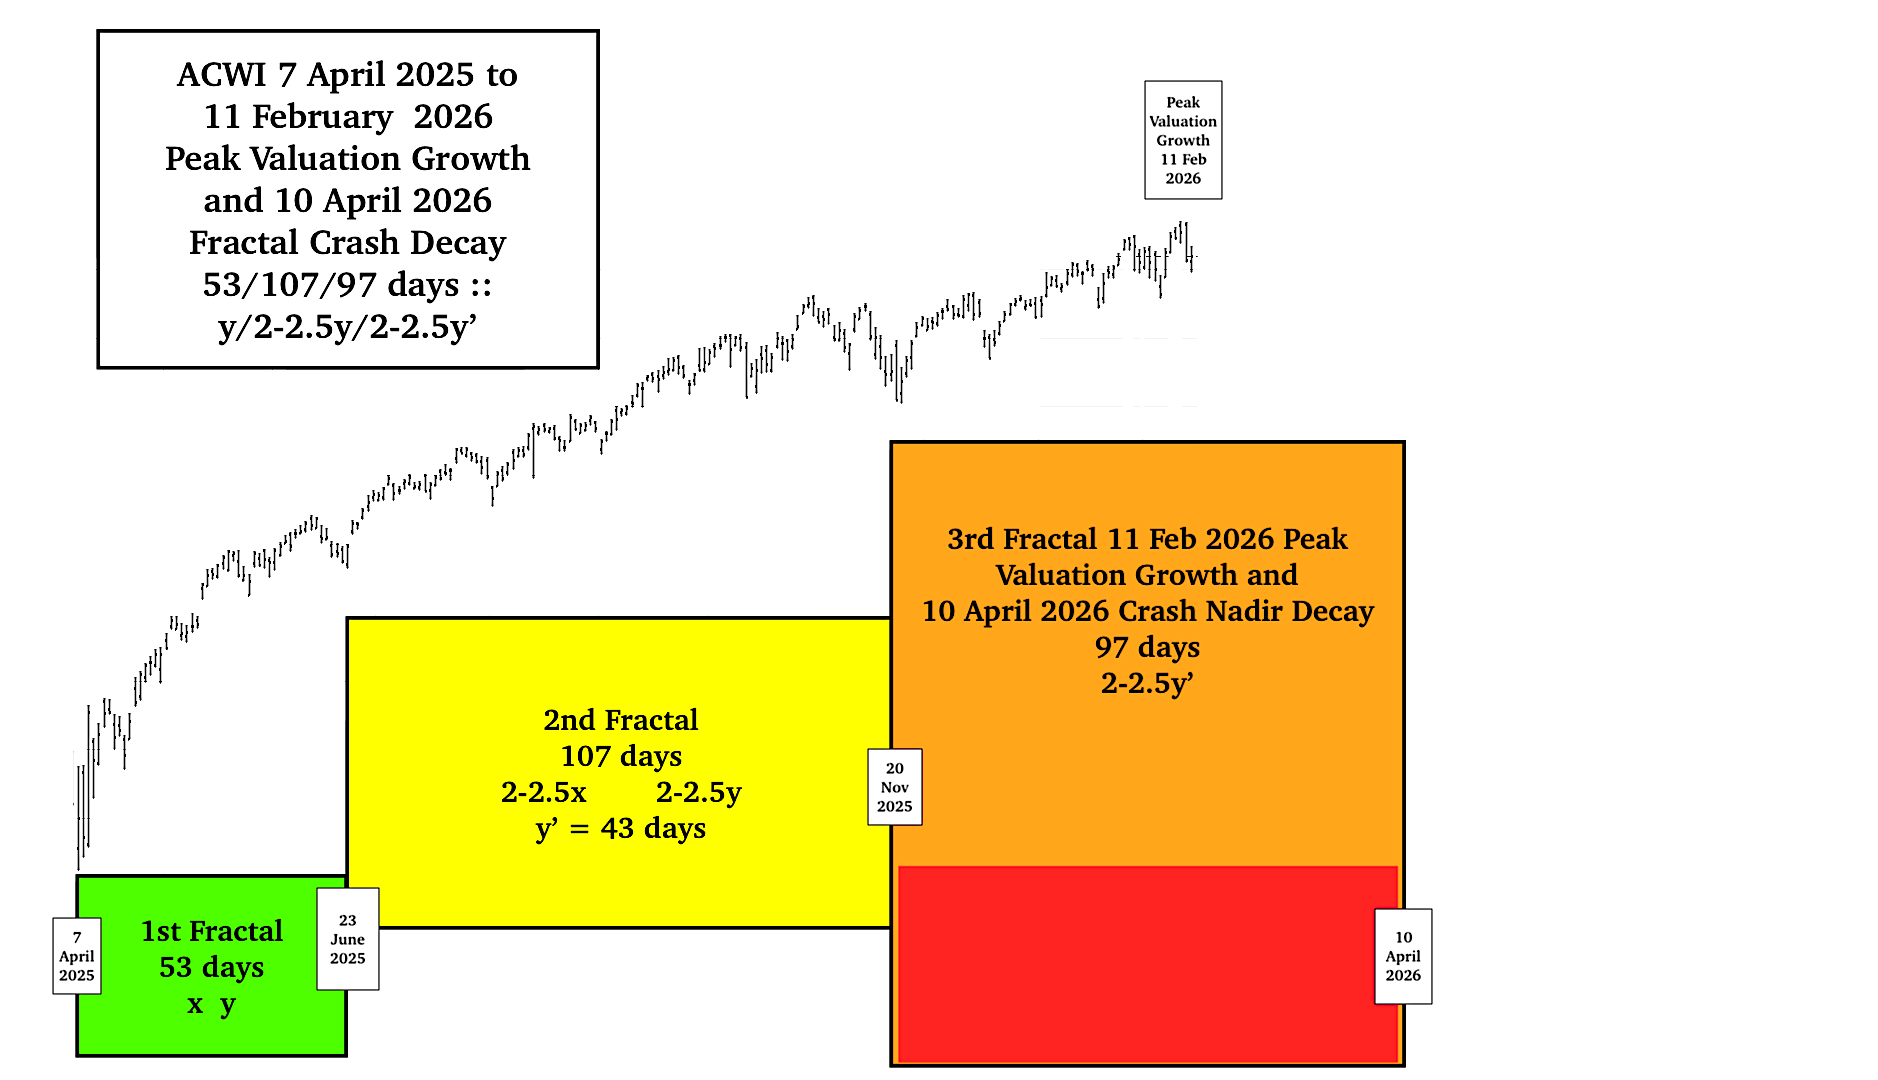
Fractal self assembly of the 1st and 2nd Fractal above is shown below: