From the Economic Fractalist 15 May 2005 Mainpage Re: 2nd Fractals (Cycles) : “A sudden nonlinear drop in the last 0.5x time period of the 2.5X is the hallmark of a second cycle and characterizes this most recognizable cycle.” … “This means that the second cycle can last anywhere in length from 2x to 2.5x.“
In the Window of Power Law Distribution 2nd Fractal Asset-Debt Macroeconomic System Self-Organized Criticality:
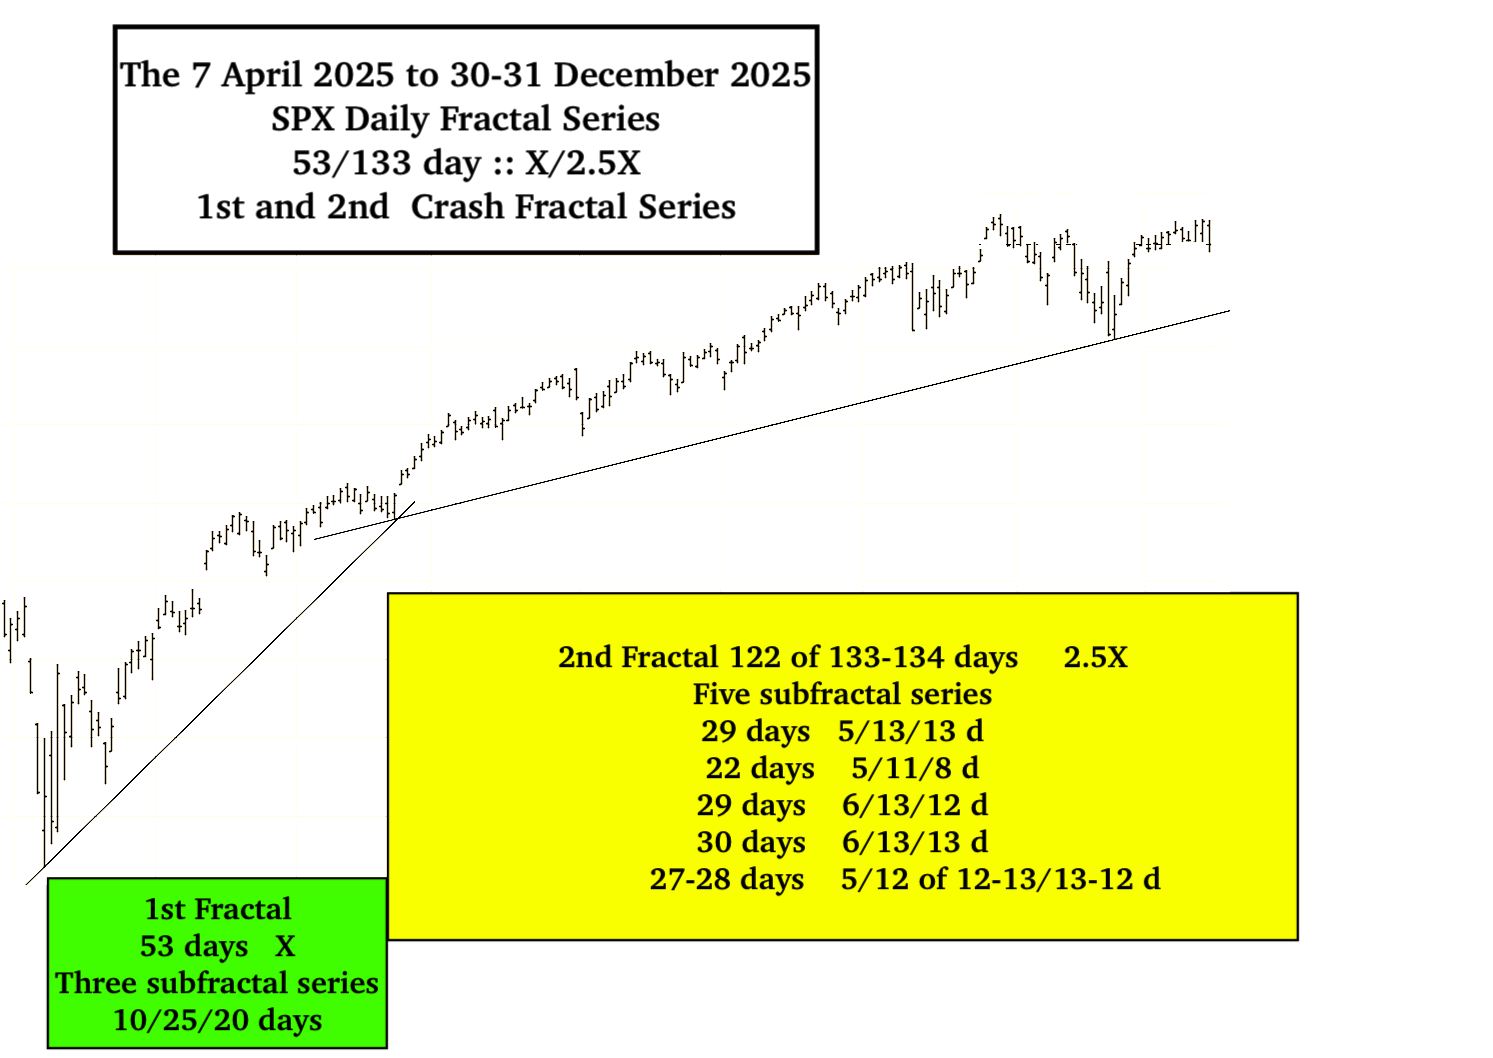
The original 7 April 2025 53/133-134 day :: x/2.5x 1st and 2nd fractal series ending 30-31 December 2025 is the correct fractal model with the incipient 1982 13/32 0f 33 year :: x/2-2.5x crash in the final trading days of December 2025.
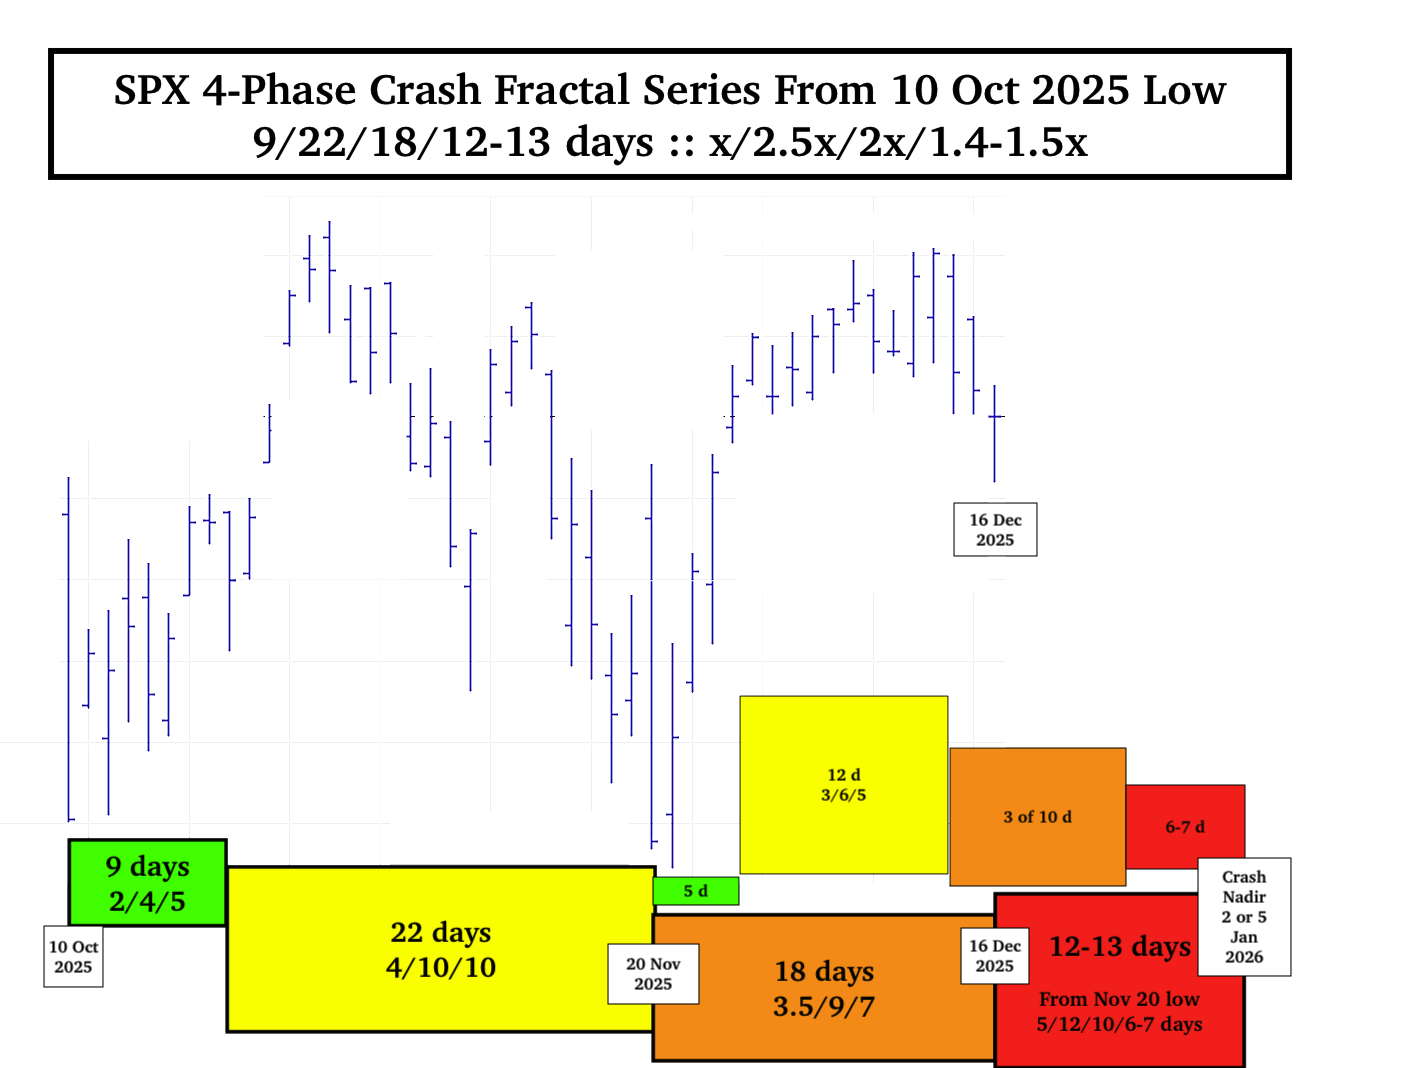
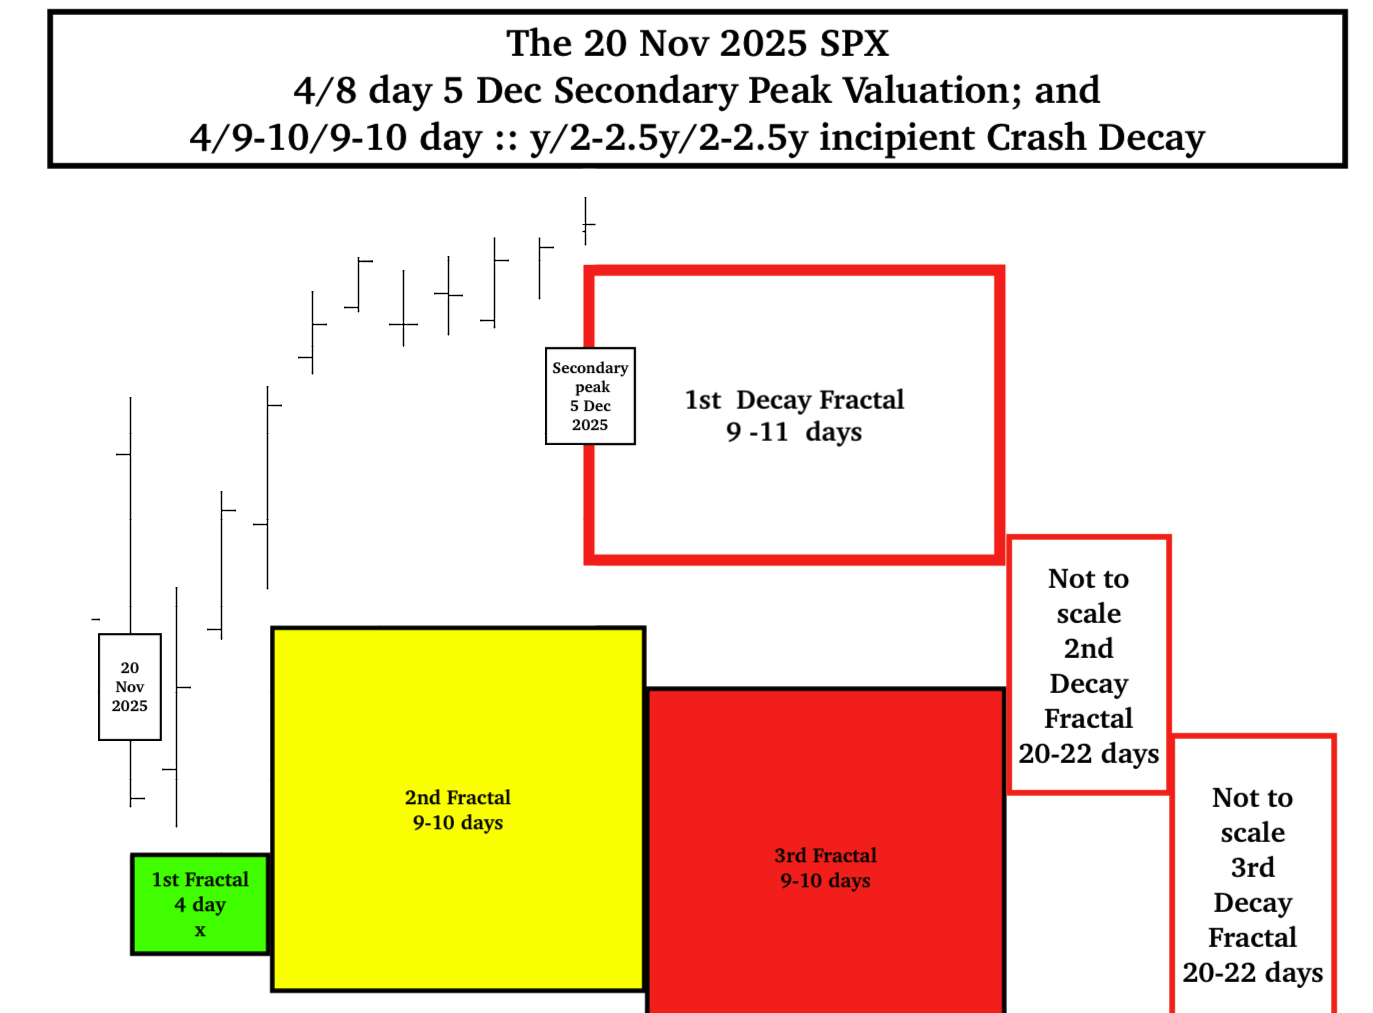
On 20 November 2025 the asset debt system self-ordered a SPX 5/12 of 12-13/13-12 day :: x/2-2.5x/2-2.5x fractal series to initiate the terminal portion of the 12 Aug 1982 13/32 of 33 year :: x/2.5x 1st and 2nd fractal series; the terminal portion of a 13 Oct 2022 55/113 of 138 week :: x/2-2.5x 1st and 2nd fractal series, and the terminal portion of a 7 April 2025 53/122 of 133-134 day :: x/2-2.5x 1st and 2nd fractal series. The nonlinear crash will be during the last days of the December 2025 12-13 day 3rd fractal.
The incipient end December global equity crash will be an affirmation for those economists interpreting the copious data as showing extreme weakness of the American consumer, the American consumer-based economy, and the world economy. It will be a wake-up call for those who measure the economy primarily by equity market performance.
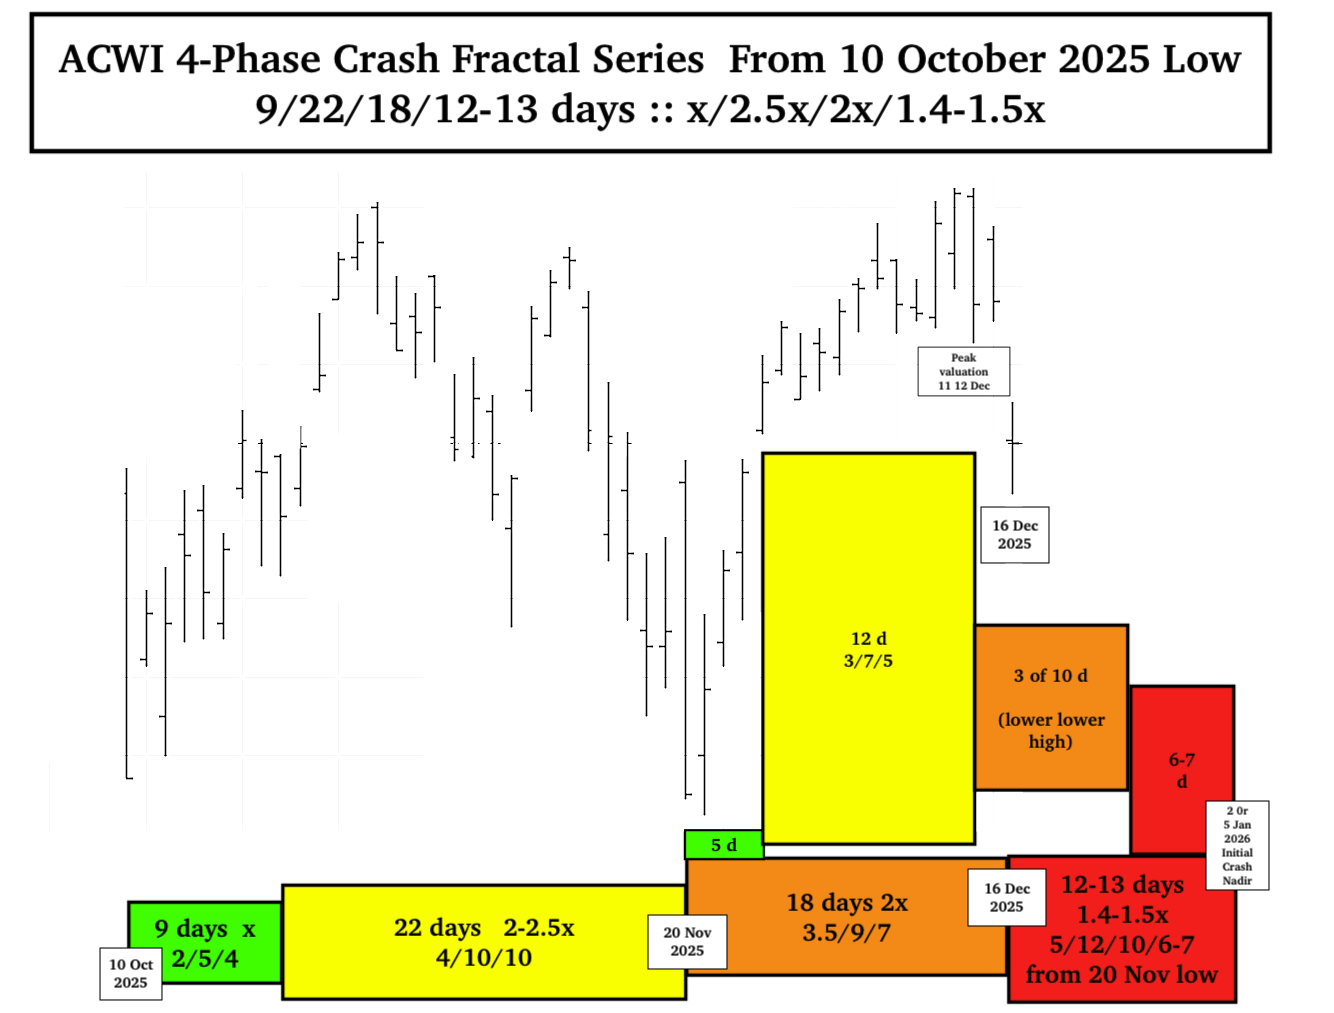
The 10 Oct to 20 November 2025 day fractal subseries is now observed as a 6/13/13 day :: x/2-2.5×2-2.5x fractal series with trend lines better seen on SPX futures. While the SPX has not exceeded its 29 Oct 2025 peak valuation, the Wilshire 5000 and the global ACWI, propelled by rotation of money into the ‘safer stocks of the DJIA’ had valuation peaks on 11 and 12 Dec 2025.
Will the end December 2025 initial lower low nonlinearity reach below the 7 April 2025 valuations? This nonlinearity is the beginning of about a 45 week progression to a final lower low valuation with an expected 80-90 % loss of equity valuation. There will be sharp valuation counter growth periods within this overall decay time frame.
Added 16 Dec 2025.
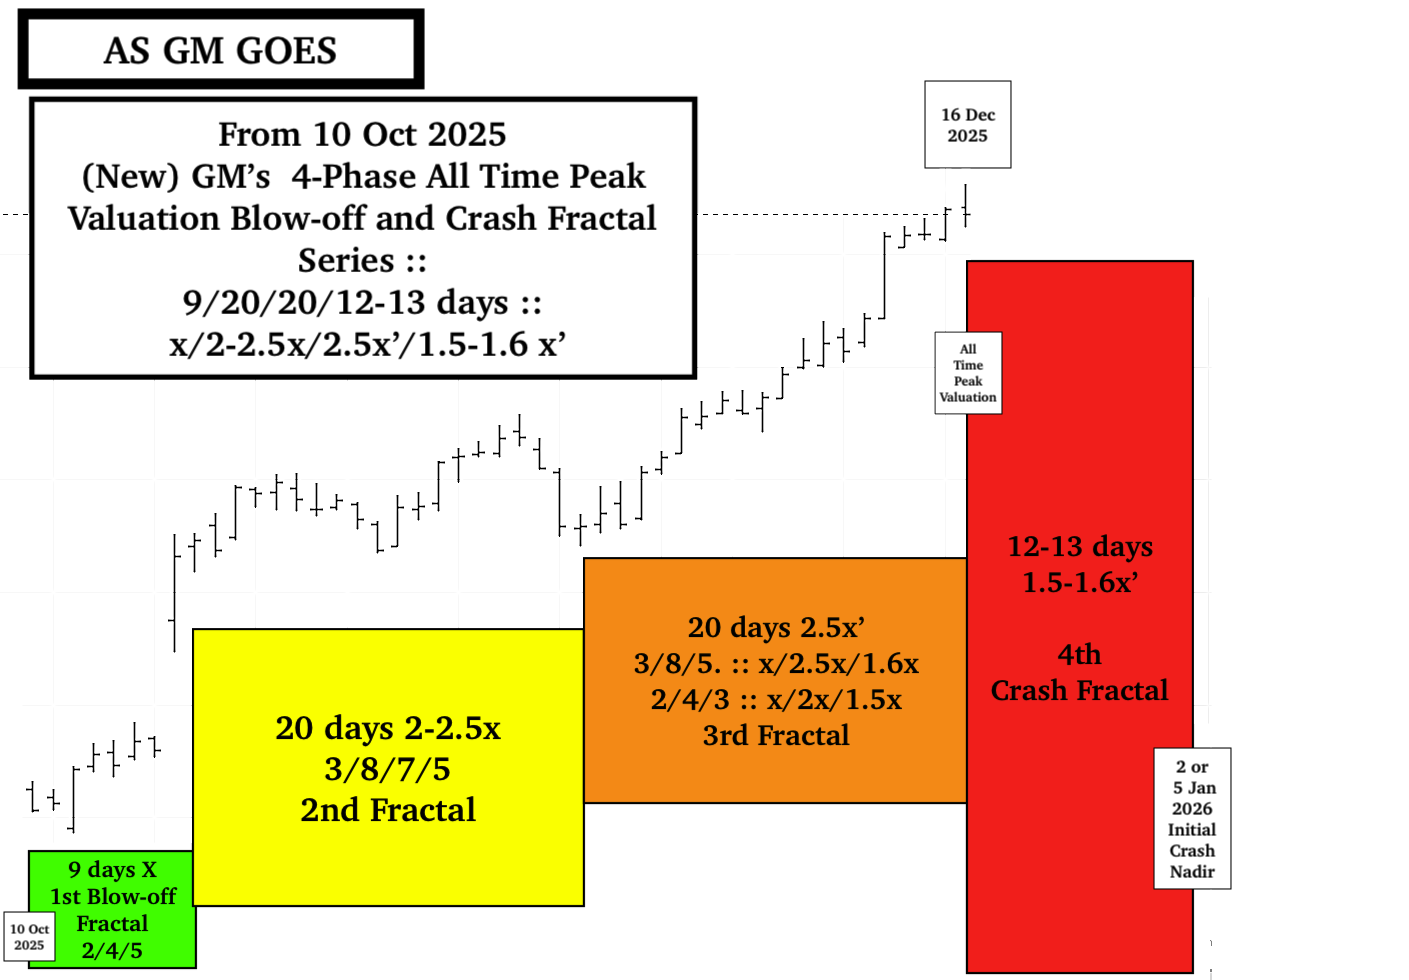
Blow-off intrahigh valuation for GM and gap lower valuation for the 92 trillion dollar equivalent ACWI …
The last of the speculative money has rotated into the ‘safest equities and major banking equities with blow-off valuation in both areas. Paradoxically the 92 trillion global equity composite ACWI had a gap down lower on 16 December, rising during the day but unable to fill the gap. Retrospectively both the 2-phase and 3 phase 7 April models may be correct with an initial targeted crash nadir on 2 or 5 Jan 2026.
Is there an underlying time-based self-assembly fractal order to the growth and decay of equity valuations in the US and global asset-debt macroeconomic system?
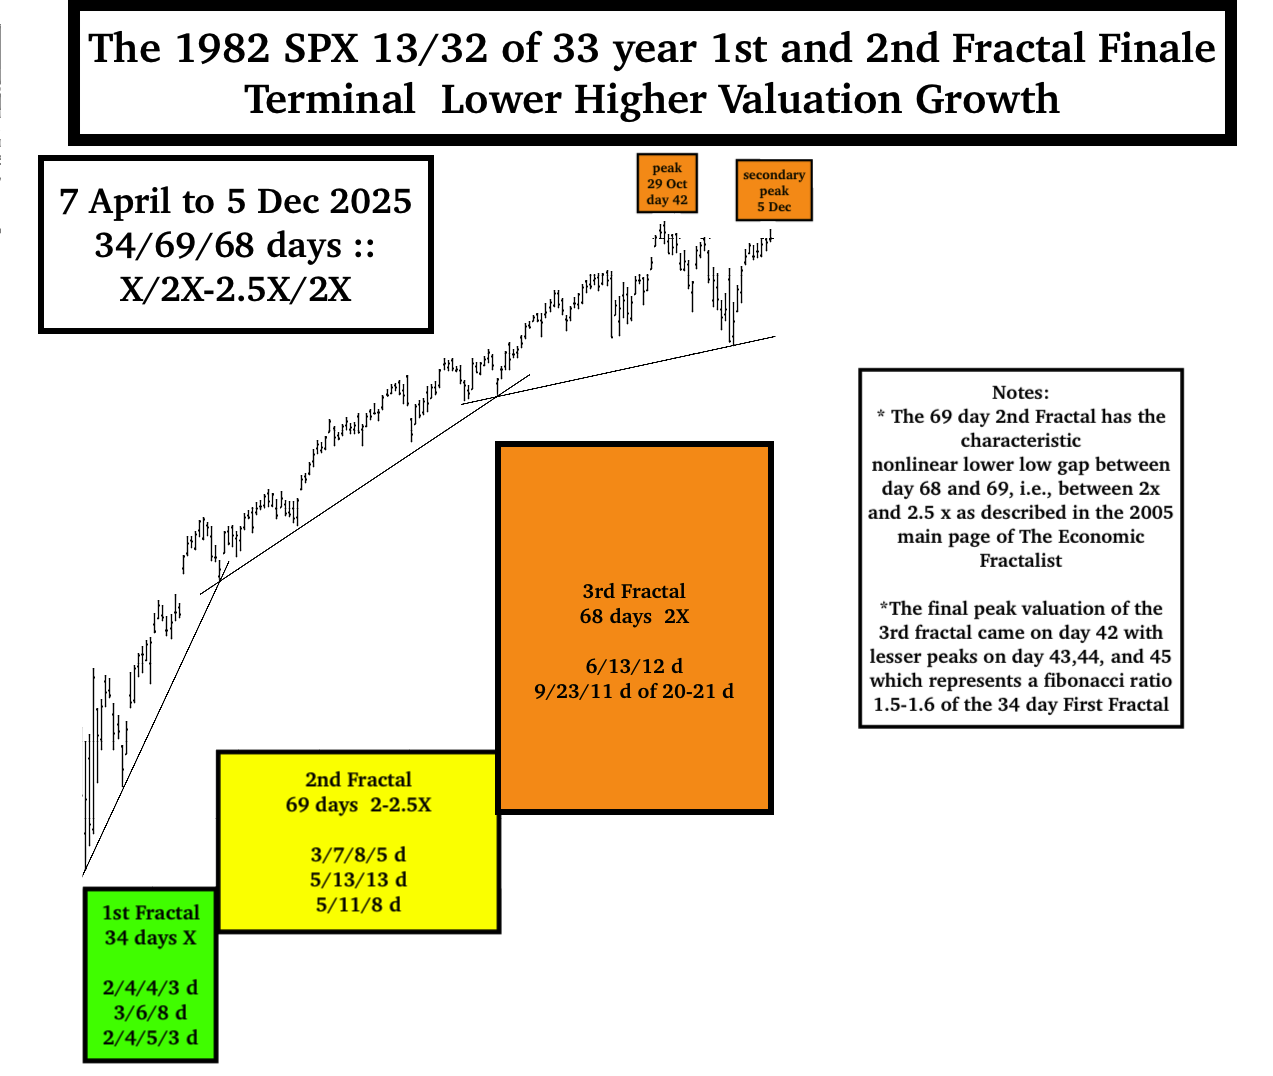
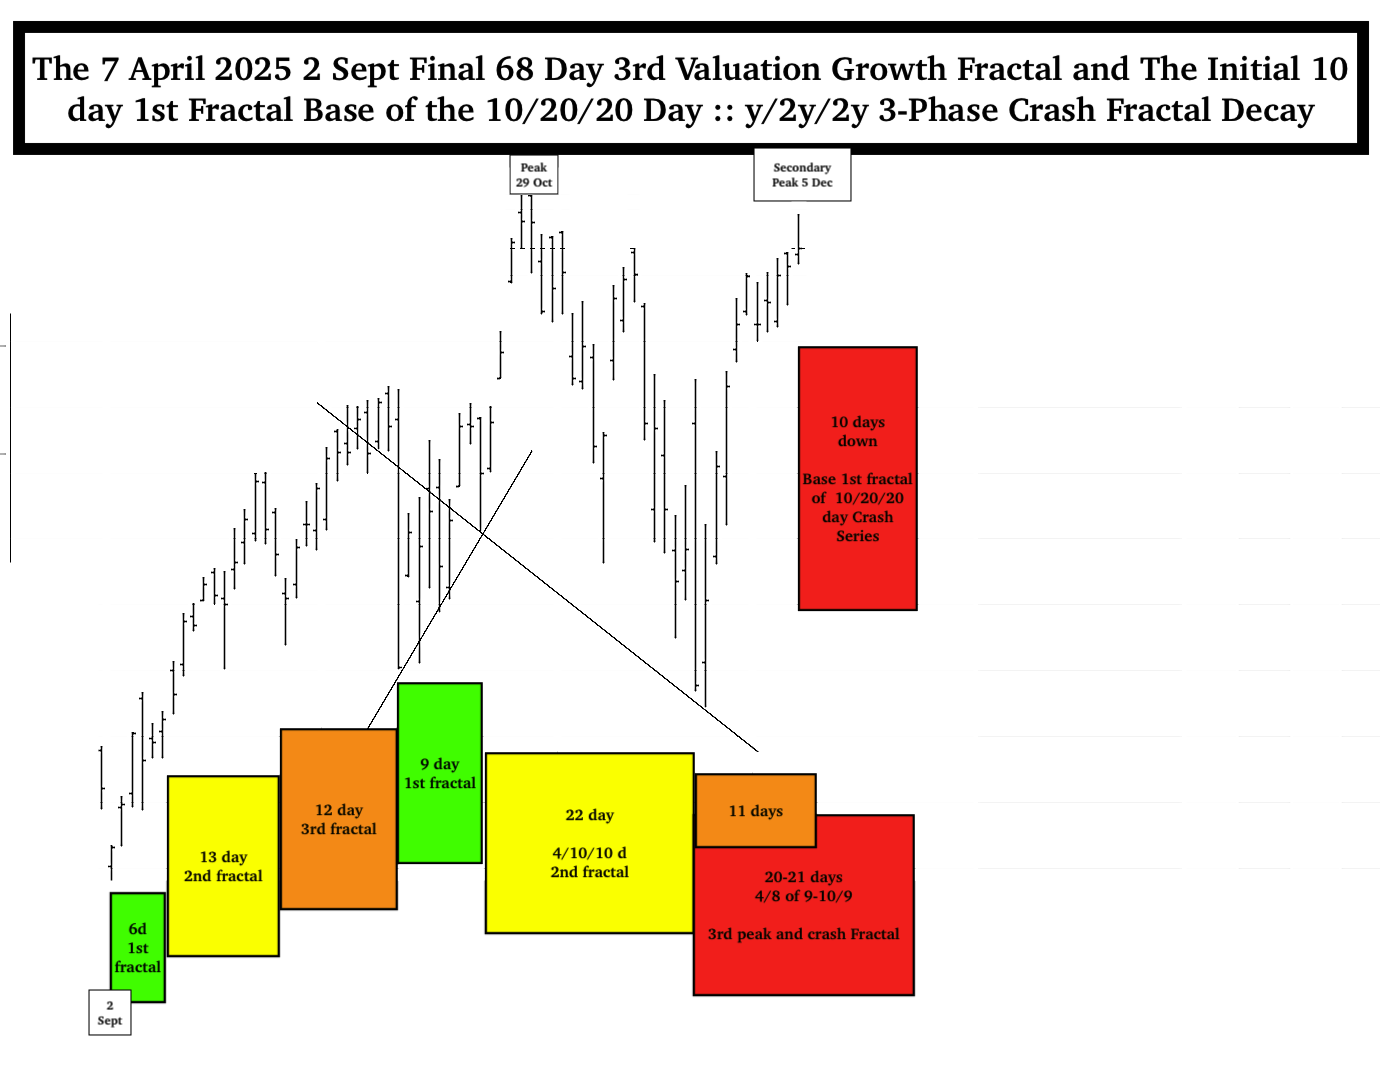
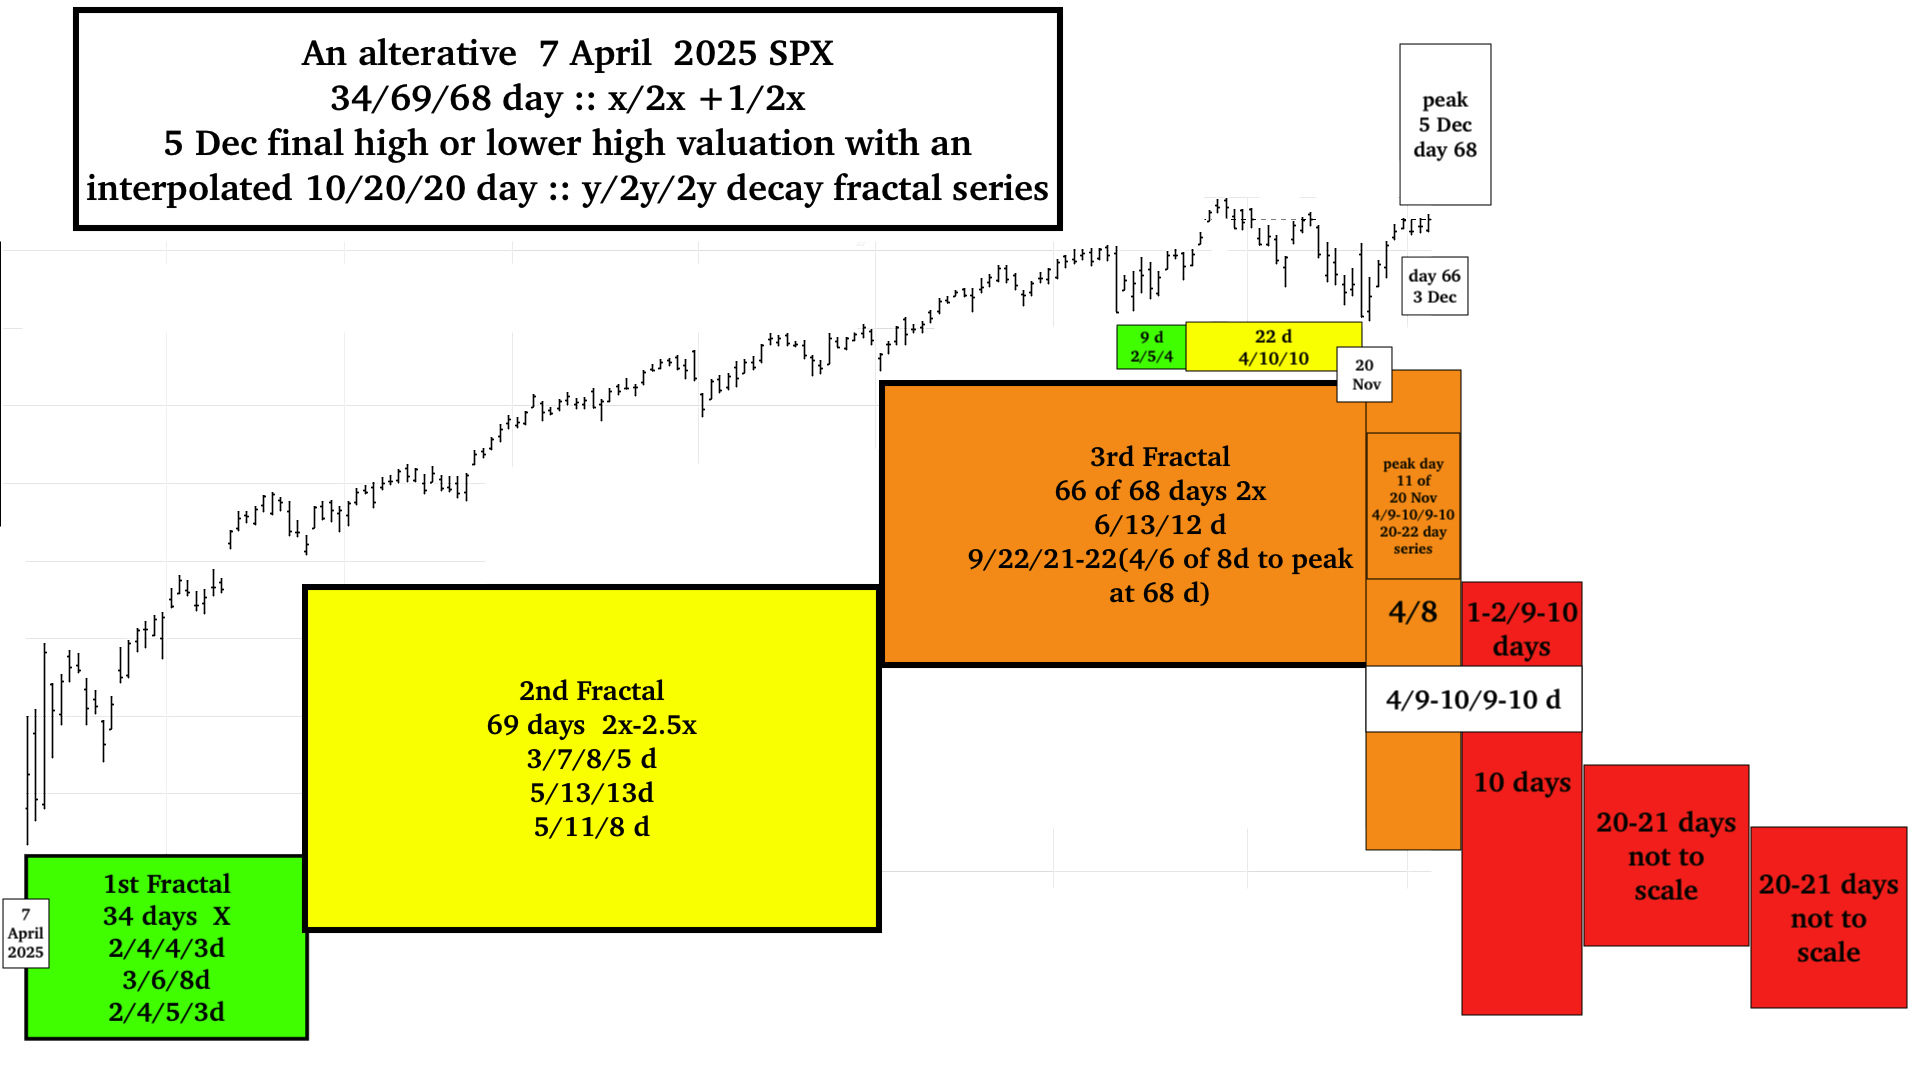
The self ordered valuation growth finale for the 1982 to 2026 large scale 13/32 of 33 year :: x/2.5x fractal series appears to be a 7 April 2025 to 5 December 2025 34/69/68 day :: x/2-2.5x/2x fractal growth series.
The SPX/ACWI/QQQ reached its all time valuation peak in the 3rd 68 day fractal of the 3-phase growth series (and average daily high grouping) on 29 October 2025, day 42 (and the one preceding and three subsequent days) , an average Fibonacci growth ratio of an average 1.6x of its 7 April 34 day 1st fractal ideal base of 28 days (the 2nd Fractal 69 days divided by 2.5). On day 68, 5 December the 3rd fractal reached its 2x final lower high. The 69 day second fractal shows the hallmark 2nd fractal characteristic nonlinear gapped lower low between day 68 and 69, i.e., 2x and 2.5x as described in the 2005 Main Page of the Economic Fractalist.
It is the 2005 hypothesis of this website that the asset-debt system self-orders equity valuation growth and decay by two simple time-unit based fractal equations or laws : a 4-phase fractal series: x/2-2.5x/2-2.5x/1.5-1.6x with respective units termed the 1st, 2nd, 3rd and 4th Fractal, and a 3-phase fractal series: x/2-2.5x/1.5-2.5x with respective units termed 1st, 2nd, and 3rd Fractals. In the 4-phase fractal series, the 3rd 2-2.5x fractal represents peak valuation growth or secondary final growth, all other end points in the 4-phase series and all end points the 3 phase fractal series represent nadir valuations. Fractal groupings are defined by underlying trendlines from the beginning to the end of the grouping where all intervening values are above the trendline. 2nd Fractals of both 3 and 4 phase fractals are characterized by a nonlinear lower low gap valuation in the terminal 2x to 2.5x portion of the 2nd fractal. The inception of fractal valuation decay is conjoined and interpolated with end fractal peak growth and vice versa. In terminal blow-off valuation growth, the first fractal can end on an aberrant additional unit high above the slope line and in the terminal blow-off series, the 3rd fractal peak of a 4 phase series can end at a near fibonacci 1.5-1.6x time range length of the 1st fractal or its ideal time (the length of the 2nd fractal divided by 2.5).
After the Buttonwood agreement in 1792 and an initiating 4 phase fractal series of 16 years, an 1807 4-phase US hegemonic fractal series of 36/90/90/54-57 years commenced with lows in 1842-43, 1932, a 90 year high in Nov 2021, and an expected low in 2074-77.
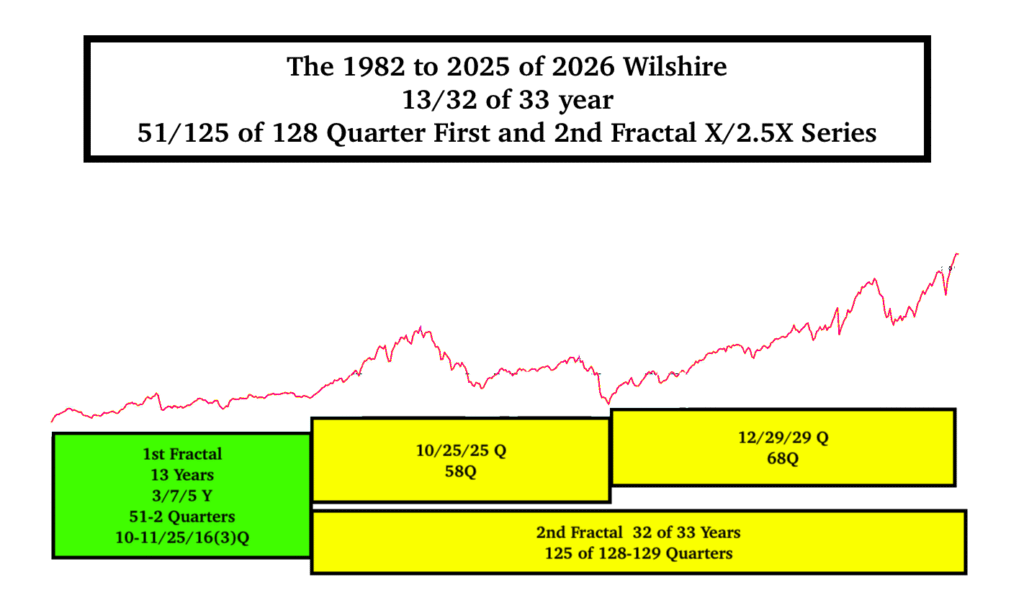
The 90 year 3rd and the 54-57 year 4th Fractals of this series starting in 1932, are composed of two fractal series: a 3-phase 10-11/20-21/20-21 year :: x/2x/2x series ending in 1982 and a 1982 13/currently 32 of 33/33/20 year series :: x/2.5x/2.5x/1.5-1.6x ending in 2074-76.
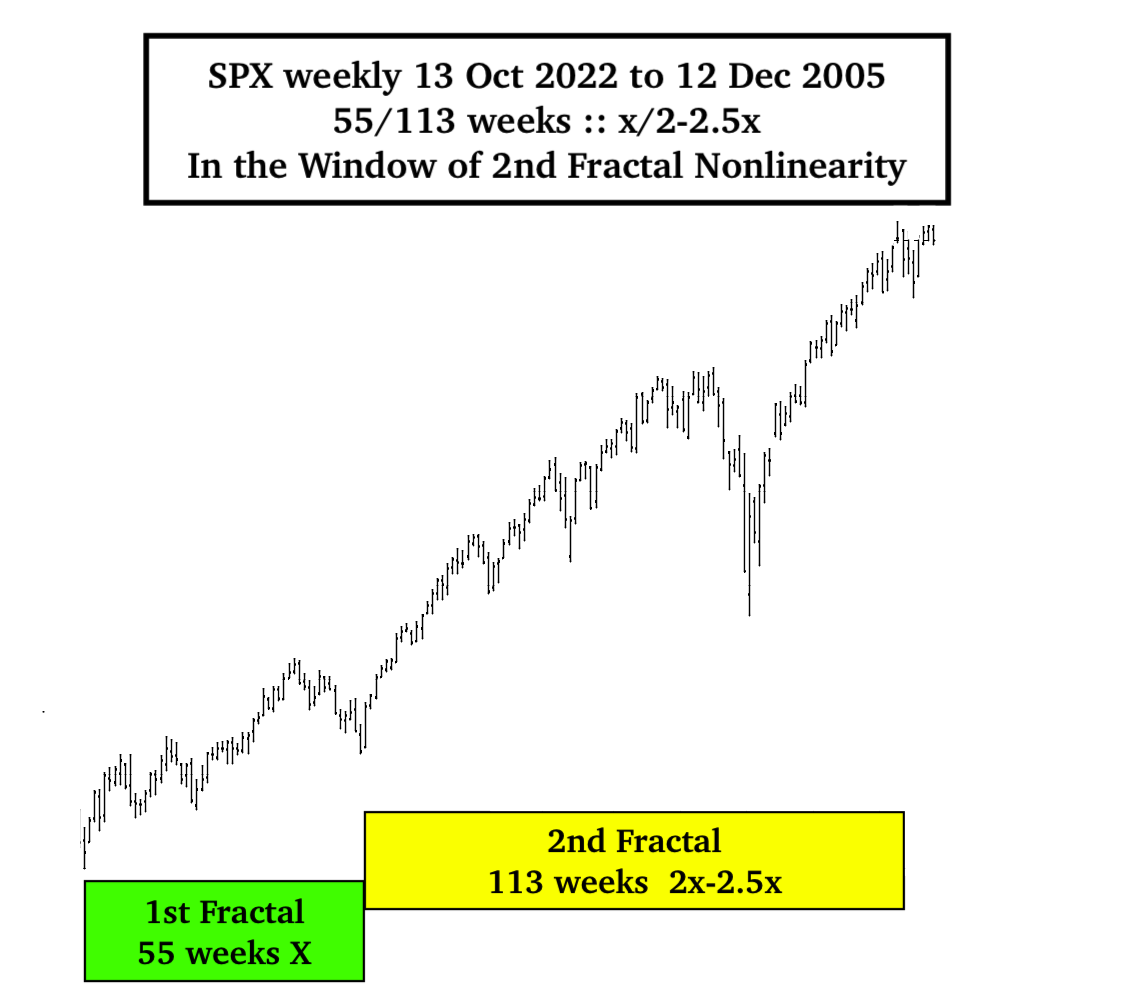
The 90 year 3rd fractal peaking Nov 2021 is interpolated in the 1982 13/33 :: x/2.5x first and second fractal series as shown below.
The 90 year 2.5x Nov 2021 valuation peak was later exceeded because of average annual US deficit to GDP governmental spending from 2020-2025 of 8.4%. This deficit to GDP spending compares to the long term annual average from 1948 to 2020 of 2.6%. The 2020-2025 deficit spending generated an average GDP growth of 2.9% vice a long term 3.15% which includes a negative 7% in 2009 of the great recession. Covid 2020 and 2021 15% and 12.4% deficit to GDP spending , supply chain disruptions, build back better spending , and the recent tax breaks for billionaires have contributed to the peacetime massive deficit spending.
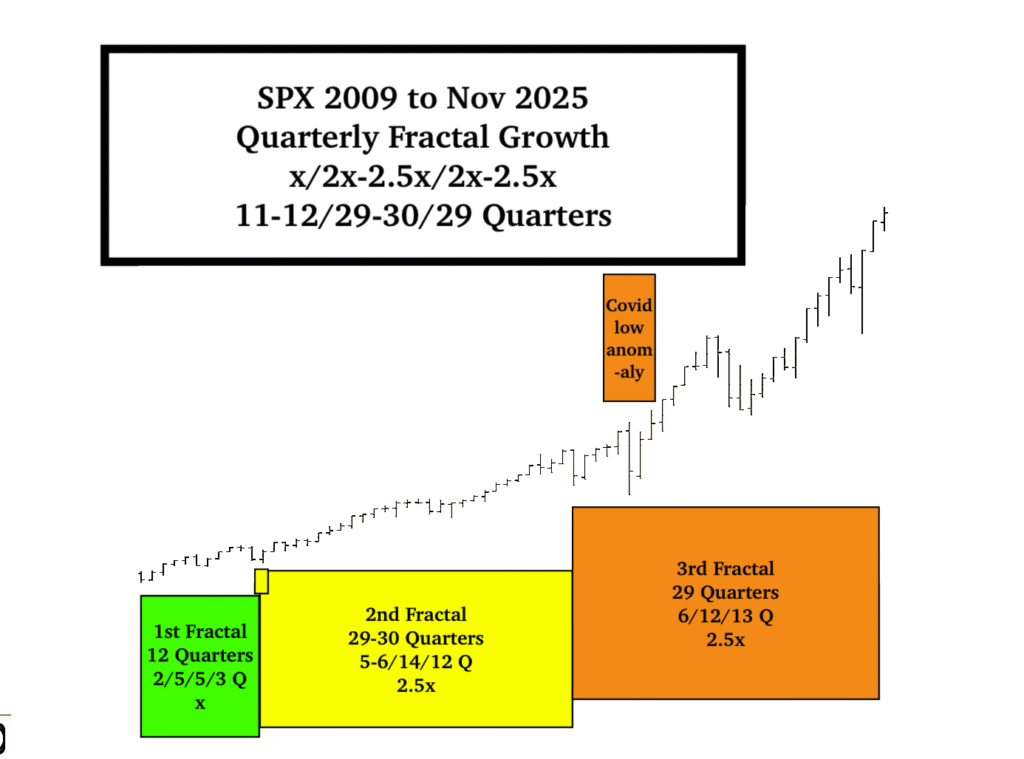
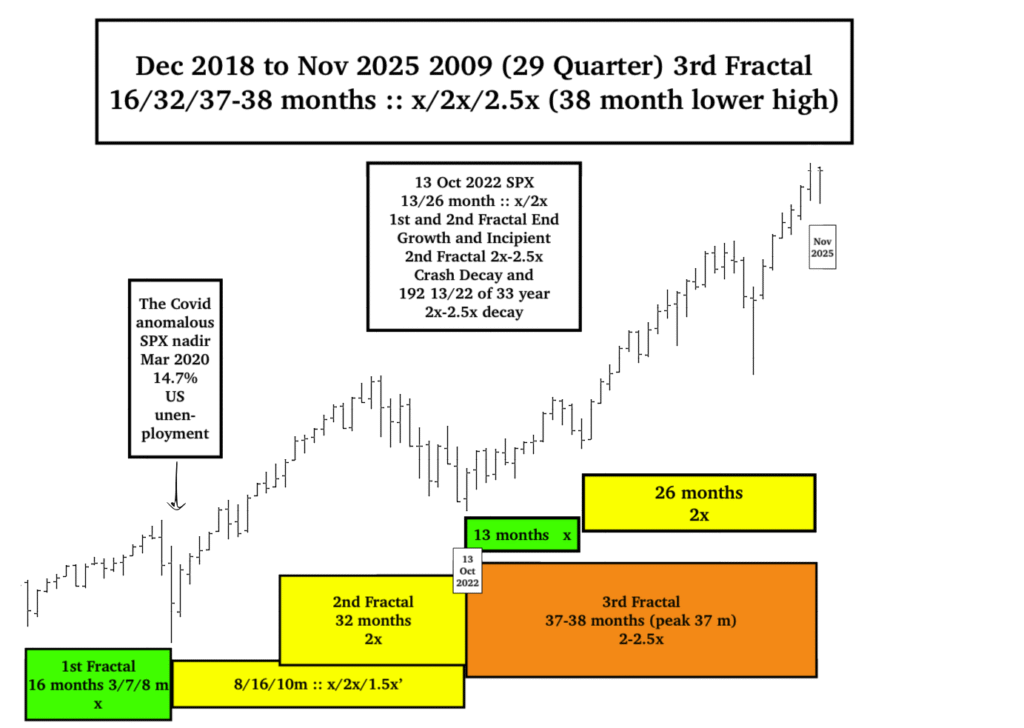
US Equity (and the global equity composite) valuations peaked on 28/29 Oct 2025 at over 220% of US GDP – an all time historical high. What causes the timing of peak equity valuation? With corporate buy backs and long term capital gains equities are the most taxed advantaged asset class within the macroeconomic asset-debt system and their valuations self order extension to the longest possible fractal growth. Accompanying this tax advantage, fractal length to peak is ultimately determined by ongoing credit expansion produced by a sufficient population of three debtor entities -governmental, corporate, and consumer borrowed spending – willing and able to go into further debt – given the cost of ongoing consumer ADL’s (activities of daily living including insurance premiums), job and wage expectations, payments on accumulated debt, perceived business opportunities, concurrent asset valuation prices and expectations of asset future valuations, and political pressure to control deficit spending. Credit expansion by governmental deficit to GDP spending is the dominant force among the three entities. The October 2025 peak valuation ended the 11-12/29/29 Quarterly :: x/2.5x/2.5x maximum growth of the 3-phase fractal series starting March 2009. (This was preceded by a 10/25/25 Quarter :: x/2.5x/2.5x 3 phase series starting 1994. (see above graph)
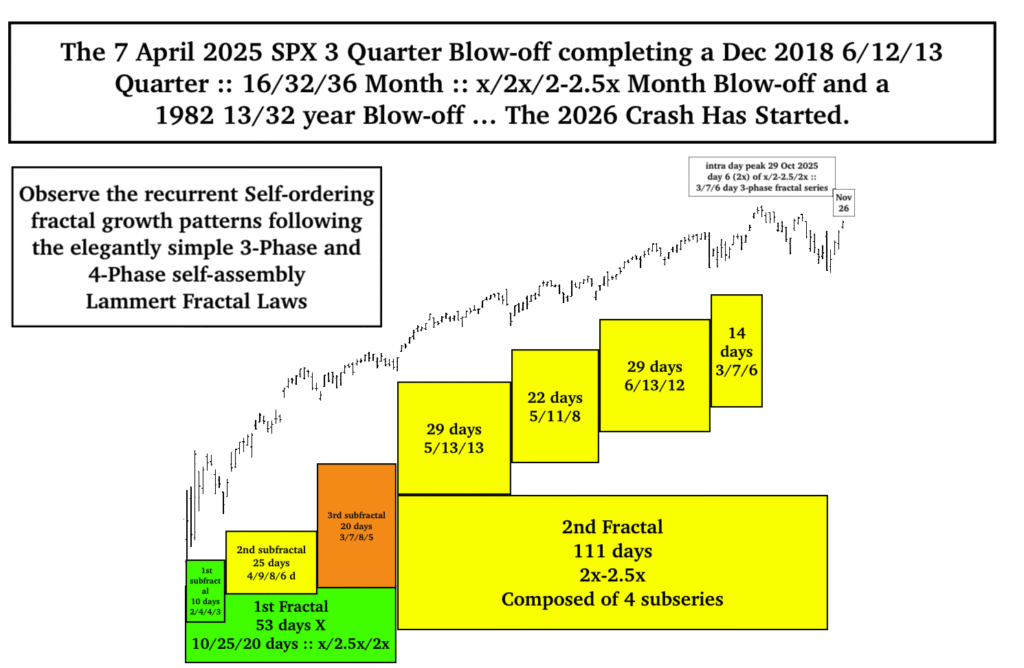
The 3rd 29 Quarter Fractal of the SPX ‘s current 2009 12/29/29 quarter :: x/2.5x/2.5x 3-phase fractal growth series -started with a nadir in December 2018 and is composed of a 6/12/13 quarter :: 16/32/39 month :: x/2x/2.5x fractal subseries (as of Dec 2025). The Global Covid shock anomaly with unemployment spiking from 3.9% in late 2019 to 14.7% in April 2020 produced an anomaly in fractal equity valuation growth with Q6 of the 1st Fractal 6Q subseries having a lower valuation nadir than Q1. A lower valuation fits with the associated credit contraction, offset in April 2020 with massive 15% and 12.4% GDP deficit spending creating the credit for stimulus checks and later MBS.
The final 13Q 3rd Fractal of the 2018 6/12/13 Q 3-phase series is composed of a 2/4/5/3 or 11 Q 4-phase series and 3 quarter fragment starting 7 April 2025.
Originally, because of the elegant paradox of interpolated fractals, the 3 quarter fragment was thought to be composed of a 53 /111 day :: x/2- 2.5x First and 2nd Fractal series: see below:
This was, however, a secondary interpolated fractal series rather than the correct primary self-ordering series: a terminal 3- phase fractal series of 34/69/68 days :: x/2-2.5x/2x as depicted below. The SPX/ACWI/QQQ reached its all time valuation peak in the 3rd 68 day fractal of the 3-phase growth series (and average daily high grouping) on 29 October 2025, day 42 (and the one preceding and three subsequent days) , a fibonacci growth ratio of an average 1.6x of its 7 April 34 day 1st fractal ideal base of 28 days (the 2nd Fractal 69 days divided by 2.5). A nonlinear lower low gap exist between day 68 and 69 of the 69 day second fractal, which was noted in the 2005 original web page, to be the terminal hallmark of a second fractal.
Fractal subfractal series self-ordering growth – of both the secondary interpolated 53/111 day :: x/2.5x 1st and 2nd fractal series and the actual primary 3-phase 34/69/42 (peak) 68 day (secondary peak) :: x/2-2.5x/1.5-1.6x– 2x terminal fractal growth series, which occur in the terminal portion of the 1982 13/32 of 33 of 33 year :: x/2-2.5x first and second fractal growth series, in the terminal portion of the 2009 11-12/29/29 quarter :: x/2.5x/2.5x fractal series, in the terminal portion of the 2018 16/32/39 month :: x/2x/2.5x fractal series – exquisitely have followed the above cited 3-phase and 4-phase fractal growth self-assembly laws. (See daily smaller subfractal series within the 1st, 2nd, and 3rd fractals in above image).
1929 and 2025 Initial Crashes
The 1807 to 1932 36/90 year :: x/2.5x and the 1982 to 2026 :: x/2.5x 1st and 2nd fractal fractal series (2nd fractal) crashes share the commonality that the initial crash sequence occurs in the terminal portion of end growth.
In 1929 the final daily 3-phase fractal growth series was a 4-5/10/9 day :: x/2x/2x fractal series with the 3 Sept 1929 peak valuation included in the 9 day 3rd Fractal. The initial first fractal decay was interpolated and initiated with that same 9 day 3rd fractal peak valuation and was a 4-phase 9/19/16/12 day :: x/2-2.5x/2x’/1.5x’ fractal decay series ending in Nov 1929 with a 50% loss in the DJIA.
In 2025, the initial crash started in the 68th final day of the 68 day 3rd fractal lower high valuation of a 7 April 2025 34/69/68 day series.
The initial crash decay series appear to be starting in the 3rd fractal of a 10 October 2025 9/22/20-22 day 3 phase fractal decay series. The final 20 November 20-22 day 3rd fractal appears to be self-ordered 4/8 of 9-10/9-10 day sub-series. The 2025 decay fractal series first base starts on 5 Dec, the 68th final day (the day the music stopped) and appears to be a possible self-assembled 2/5/5 day series or 3/8 day which is interpolated within the 20 Nov 4/8 of 9-10/8-10 day series.
Equity Market Power Law DistributionAnd2x to 2.5x Time-frame TerminalSecond Fractal Self-organized Criticality
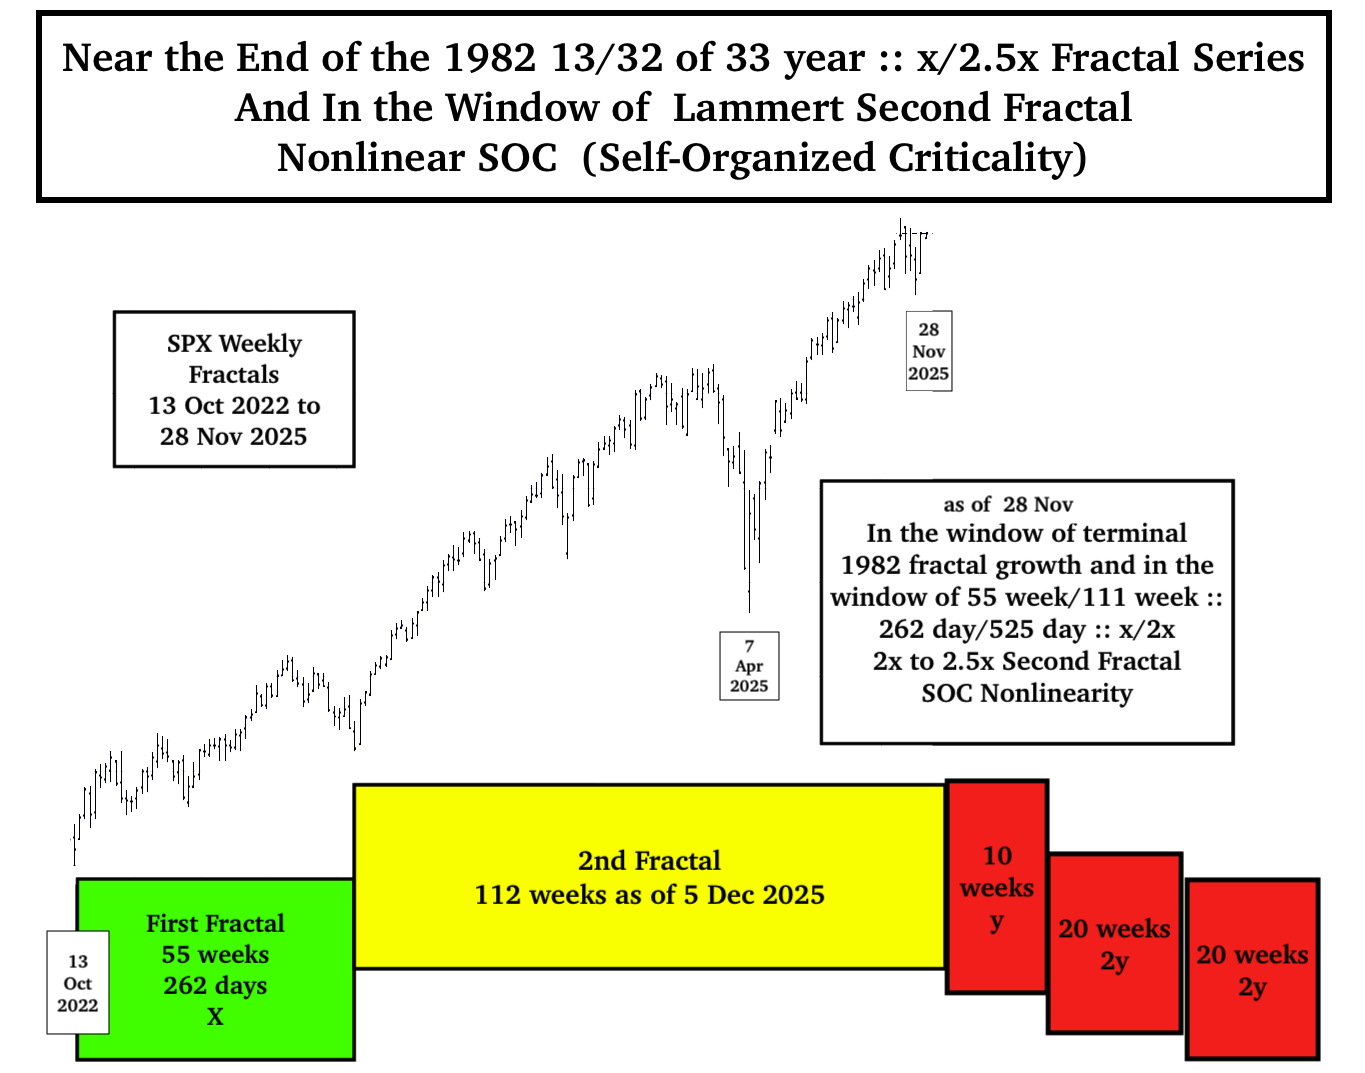
Like major earthquakes, major forest fires, and major solar flares as compared to smaller and very contained quakes, fires, and flares – the smaller time scale empirically observed nonlinear lower low gap ‘crash’ devaluations in the terminal 2x to 2.5x time frame of Lammert Asset-Debt Macroeconomic Valuation Equity 2nd Fractals represent ‘small contained nonlinear crashes’ and also appear to follow a power-law distribution, a characteristic signature of systems in a state of fractal Self-Organized Criticality (SOC). The asset debt system is now in the window of an 1982 major 13/32 of 33 year fractal series and 32 of 33 year second fractal SOC and a major crash.
The 1982-2026 13/32 of 33 year :: x/2-2.5x 1st and 2nd Fractal series is temporally far into the 2x-2.5x :: 26-33 year terminal portion of the 33 year 2nd Fractal with a 2009 maximal fractal growth series of x/2.5x/2.5x :: 12/29/29 Quarters with the 3rd 29 quarters represented by 16/32/39 months :: x/2x/2.5x peaking in the 37th month on 29 Oct 2025 with a lower high valuation in the 39th month on 5 Dec 2025.
As of 5 Dec 2025 the 13/27 month :: x/2x first and second fractals are composed of 55/112 weeks :: x/2x and 262/530 days :: x/2x-2.5x.
After 29 Oct 2025 global peak (SPX/ACWI) equity valuation fractal growth and the 5 Dec 2025 secondary peak valuation, the 1982 asset-debt macroeconomic system, following a power law distribution, is in the extreme terminal 1982 2x-2.5x – and the terminal 13 Oct 2022 2x-2.5x – Second Fractal window of nonlinearity and a major crash SOC (Self-Organized Criticality.)
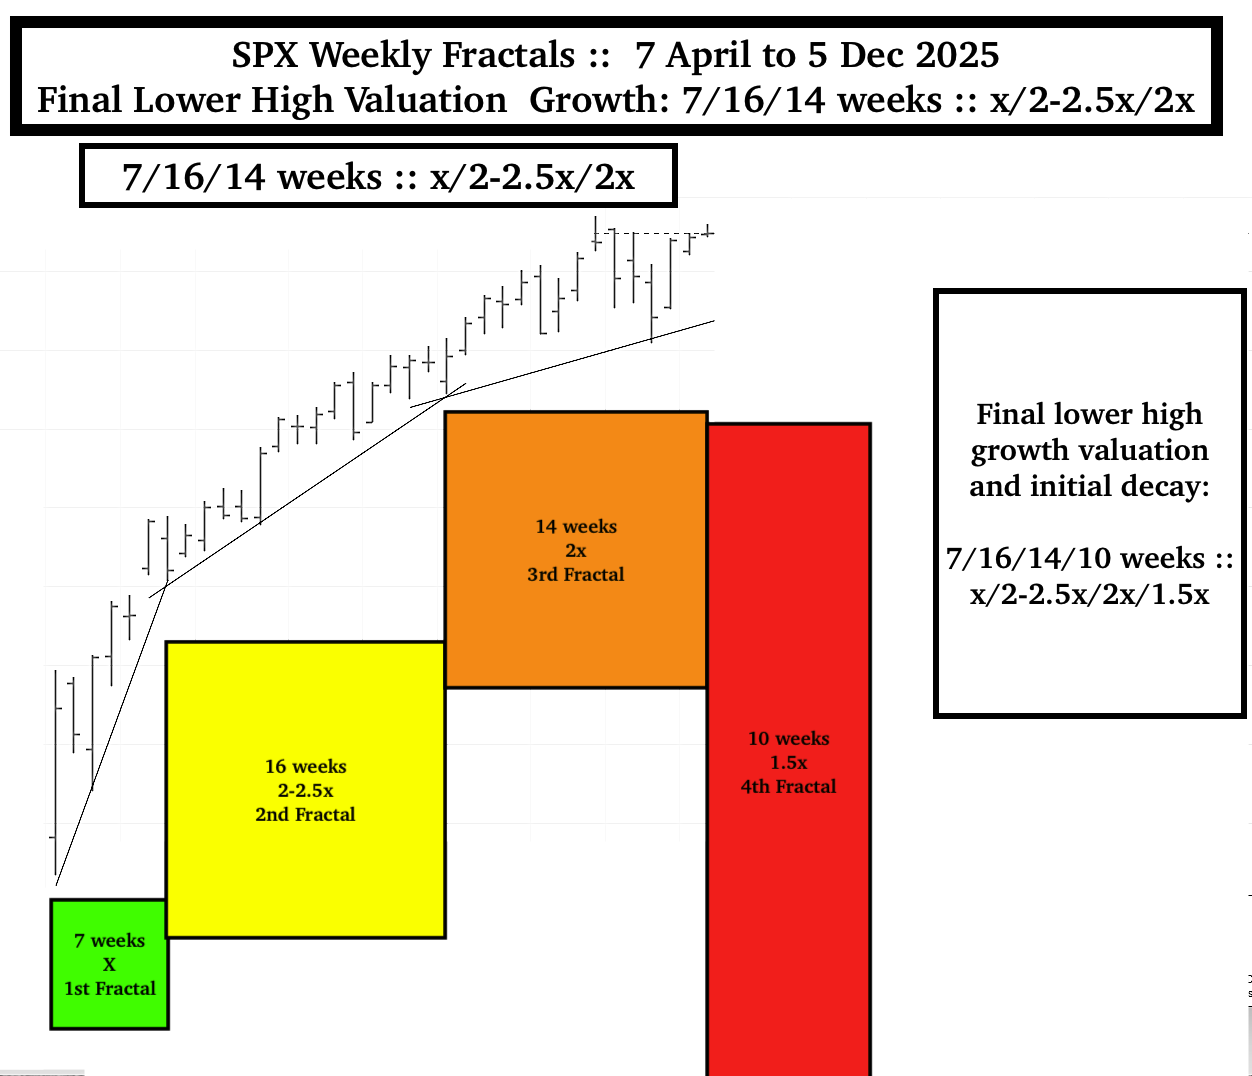
(Below) The initial 10 week 1st fractal of above 10/20/20 week 3 phase fractal crash decay series is consistent with a 7 April 2025 7/16/14/10-11 week 4-phase peak growth and incipient decay series :: x/2-2.5x/2x/1.5x … matching the 4-phase fractal series described in 2005 opening Main Page of the Economic Fractalist. See below image …
The ideal growth fractal time sequence is X, 2.5X, 2X and 1.5-1.6X. The first two cycles include a saturation transitional point and decay process in the terminal portion of the cycles. A sudden nonlinear drop in the last 0.5x time period of the 2.5X is the hallmark of a second cycle and characterizes this most recognizable cycle. After the nonlinear gap drop, the third cycle begins. This means that the second cycle can last anywhere in length from 2x to 2.5x. The third cycle 2X is primarily a growth cycle with a lower saturation point and decay process followed by a higher saturation point. The last 1.5-1.6X cycle is primarily a decay cycle interrupted with a mid area growth period. Near ideal fractal cycles can be seen in the trading valuations of many commodities and individual stocks. Most of the cycles are caricatures of the ideal and conform to Gompertz mathematical type saturation and decay curves.
G. Lammert
This page was last updated on 15-May-2005 01:21:59 PM .
Below is an alternative model with a 4 phase 7 April 2025 34/69/68/50-51 day :: x/2-2.5x/2x/1.5x fractal series with a 3rd fractal 68 day final high or secondary high on 5 December 2025. The characteristic nonlinear lower gap between day 68 and 69 (2x and 2.5x) identifies the 2nd fractal.